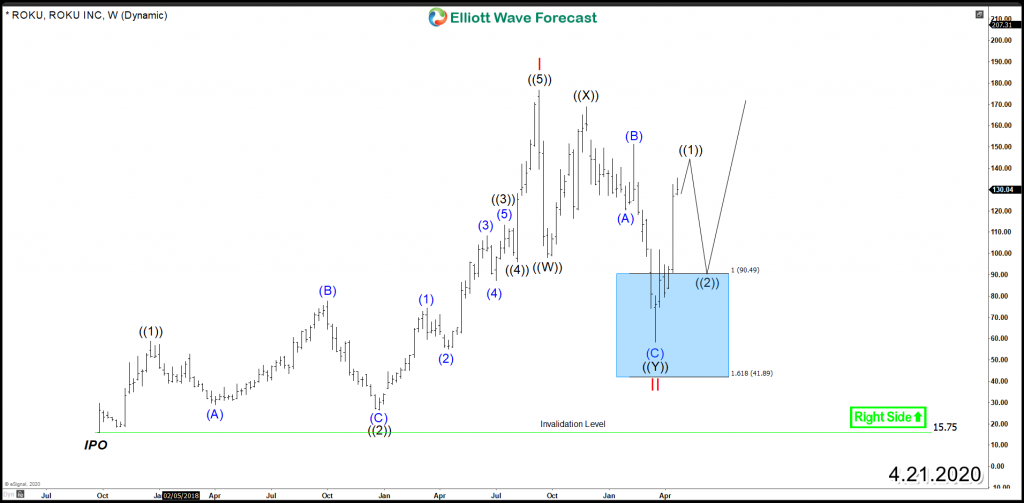
Last year, the streaming TV ROKU (NASDAQ:ROKU) ended the entire rally since IPO as an impulsive 5 waves advance which is a bullish structure followed by a Double Three corrective structure. Based on the Elliott Wave Theory, after an instrument ends the correction it will either resume the rally within the main trend or bounce in 3 waves at least.
ROKU did a 7 swings pullback from September 2019 peak toward equal legs area $90 – $41 where it ended the decline on 16 of March 2020 and managed to find buyers around the blue box to start the next leg higher. The key level for the stock is the 2019 peak $176.5 because only a break above that level will open a bullish sequence supporting the daily rally and aim for a minimum target at equal legs area $219 – $257 with a potential extension toward $318.
ROKU Weekly Chart
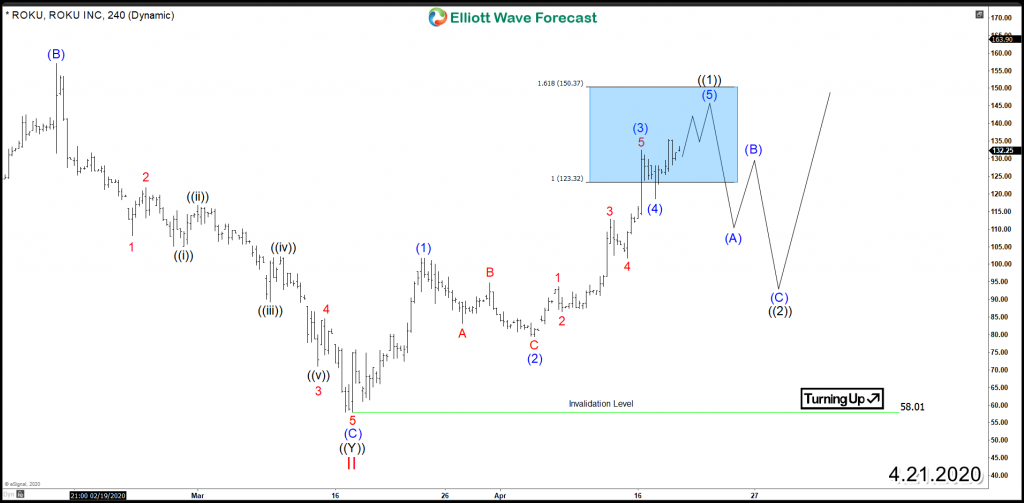
The current cycle from $58 low is mature as it reached the target area at $123 – $150 unfolding as 5 waves advance which is suggesting that ROKU will be soon looking to ended it and start a corrective pullback which is expected to remain supported in 3, 7 or 11 swings against March 2020 low before a similar rally takes place within the 4 Hour cycle.
ROKU 4H Chart
ROKU still can’t compete with the giant Netflix or other names like Amazon Prime, Disney Plus, Hulu , ect … However the steady growth of the company is the key attracting all type of investors and Hedge Funds interested in these type of stock during the current Pandemic situation.
Get more trading and investing ideas for the Stock Market by trying out our services 14 days to learn how to trade our blue boxes using the 3, 7 or 11 swings sequence. You will get access to our 78 instruments updated in 4 different time frames, Live Trading & Analysis Session done by our Expert Analysts every day, 24-hour chat room support and much more.
Back


