
The Power of 3-7-11 and the Grand Super Cycle: How We Saw the Bullish Turn in April 2025 Back on April 9, 2025, while World Indices were dropping sharply and global sentiment had turned overwhelmingly bearish, we published an article that challenged the fear-driven narrative. We explained why selling was not the right approach and […]
-

Royal Caribbean Cruises (NYSE: RCL) Super Bullish Nest In Progress
Read MoreRoyal Caribbean Cruises Ltd (NYSE: RCL), is one of the best performing stocks in recent years with +1300% up from 2020 lows. In our previous article, we identified the initial bullish structure setting up the current rally. Likewise, we’ll continue exploring the weekly path based on Elliott Wave Theory. In 2023, we explained that RCL was […]
-

Berkshire Hathaway (BRK.B) Elliott Wave Analysis
Read MoreBerkshire Hathaway (BRK.B) Elliott Wave Update: Bullish Outlook with a Clear Invalidation Level Berkshire Hathaway (BRK.B) continues to present a strong bullish setup from an Elliott Wave perspective. Our analysis across multiple timeframes suggests that the stock remains in a larger impulsive cycle, with recent price action confirming the expected wave structure. Below, we will […]
-

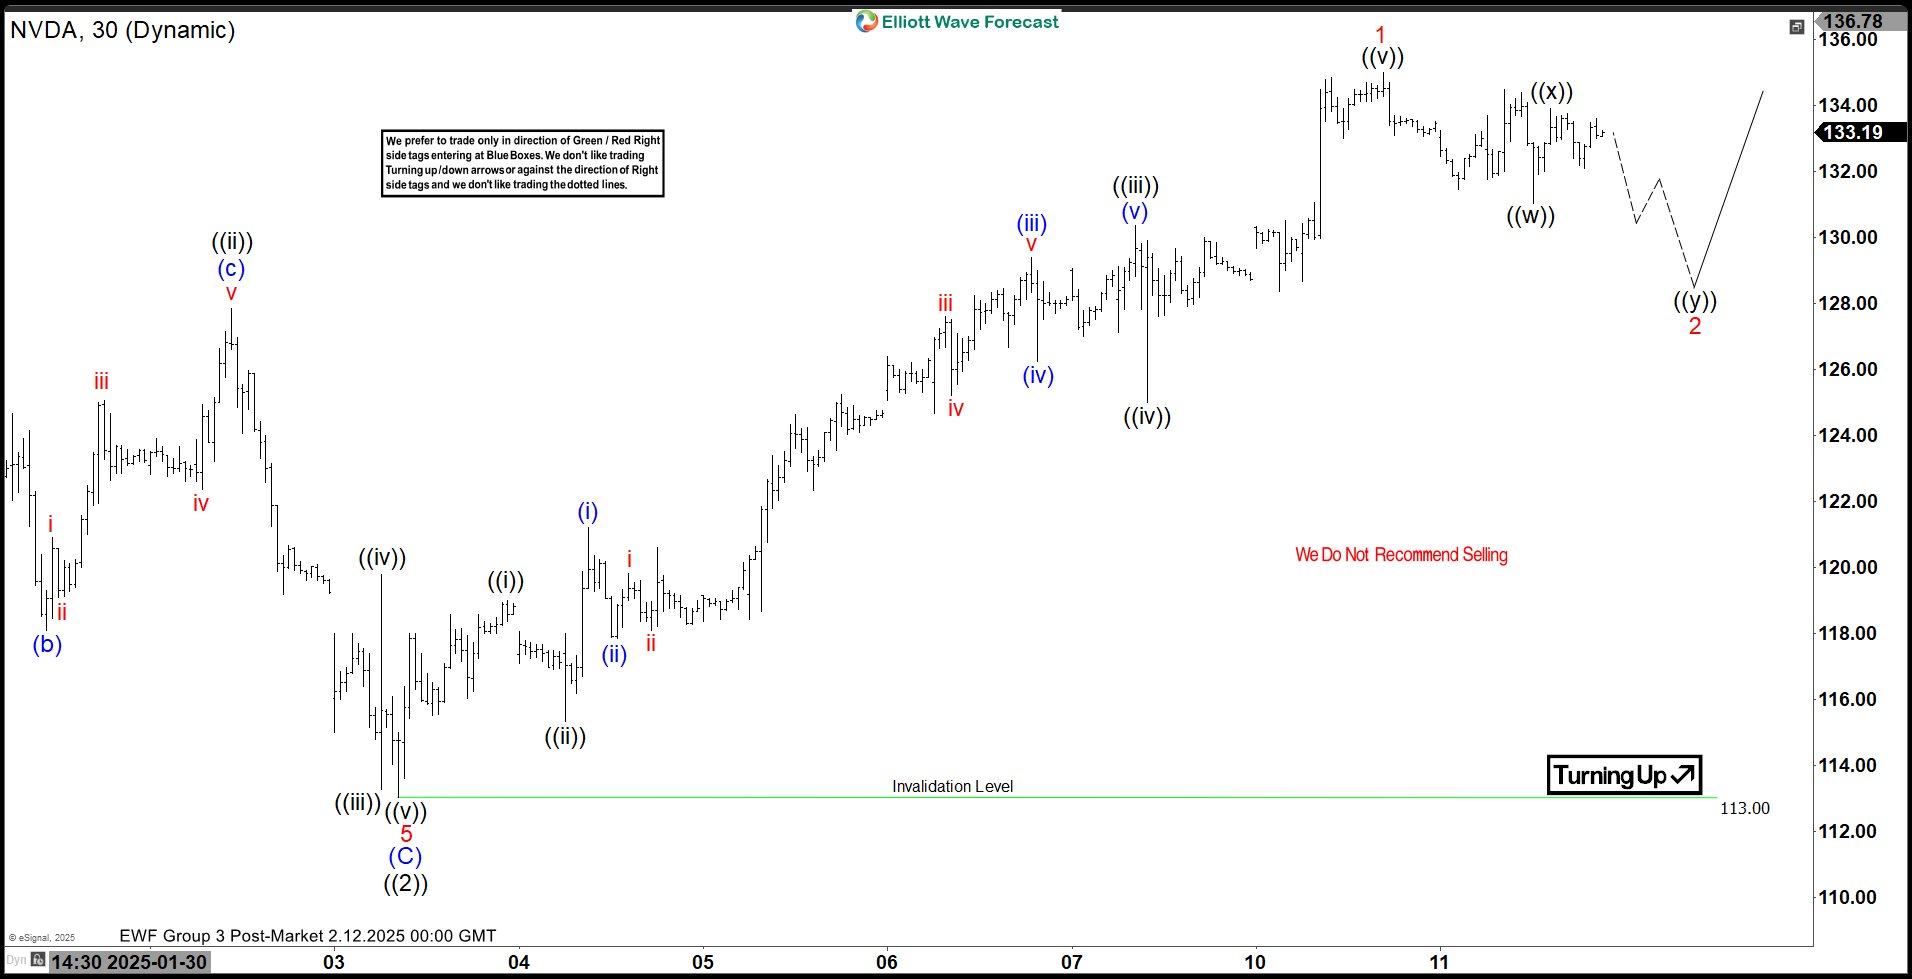
Elliott Wave View: Nvidia (NVDA) Looking for a Double Correction
Read MoreNvidia (NVDA) has started the next leg higher and pullback should find support. This article and video look at the Elliott Wave path.
-

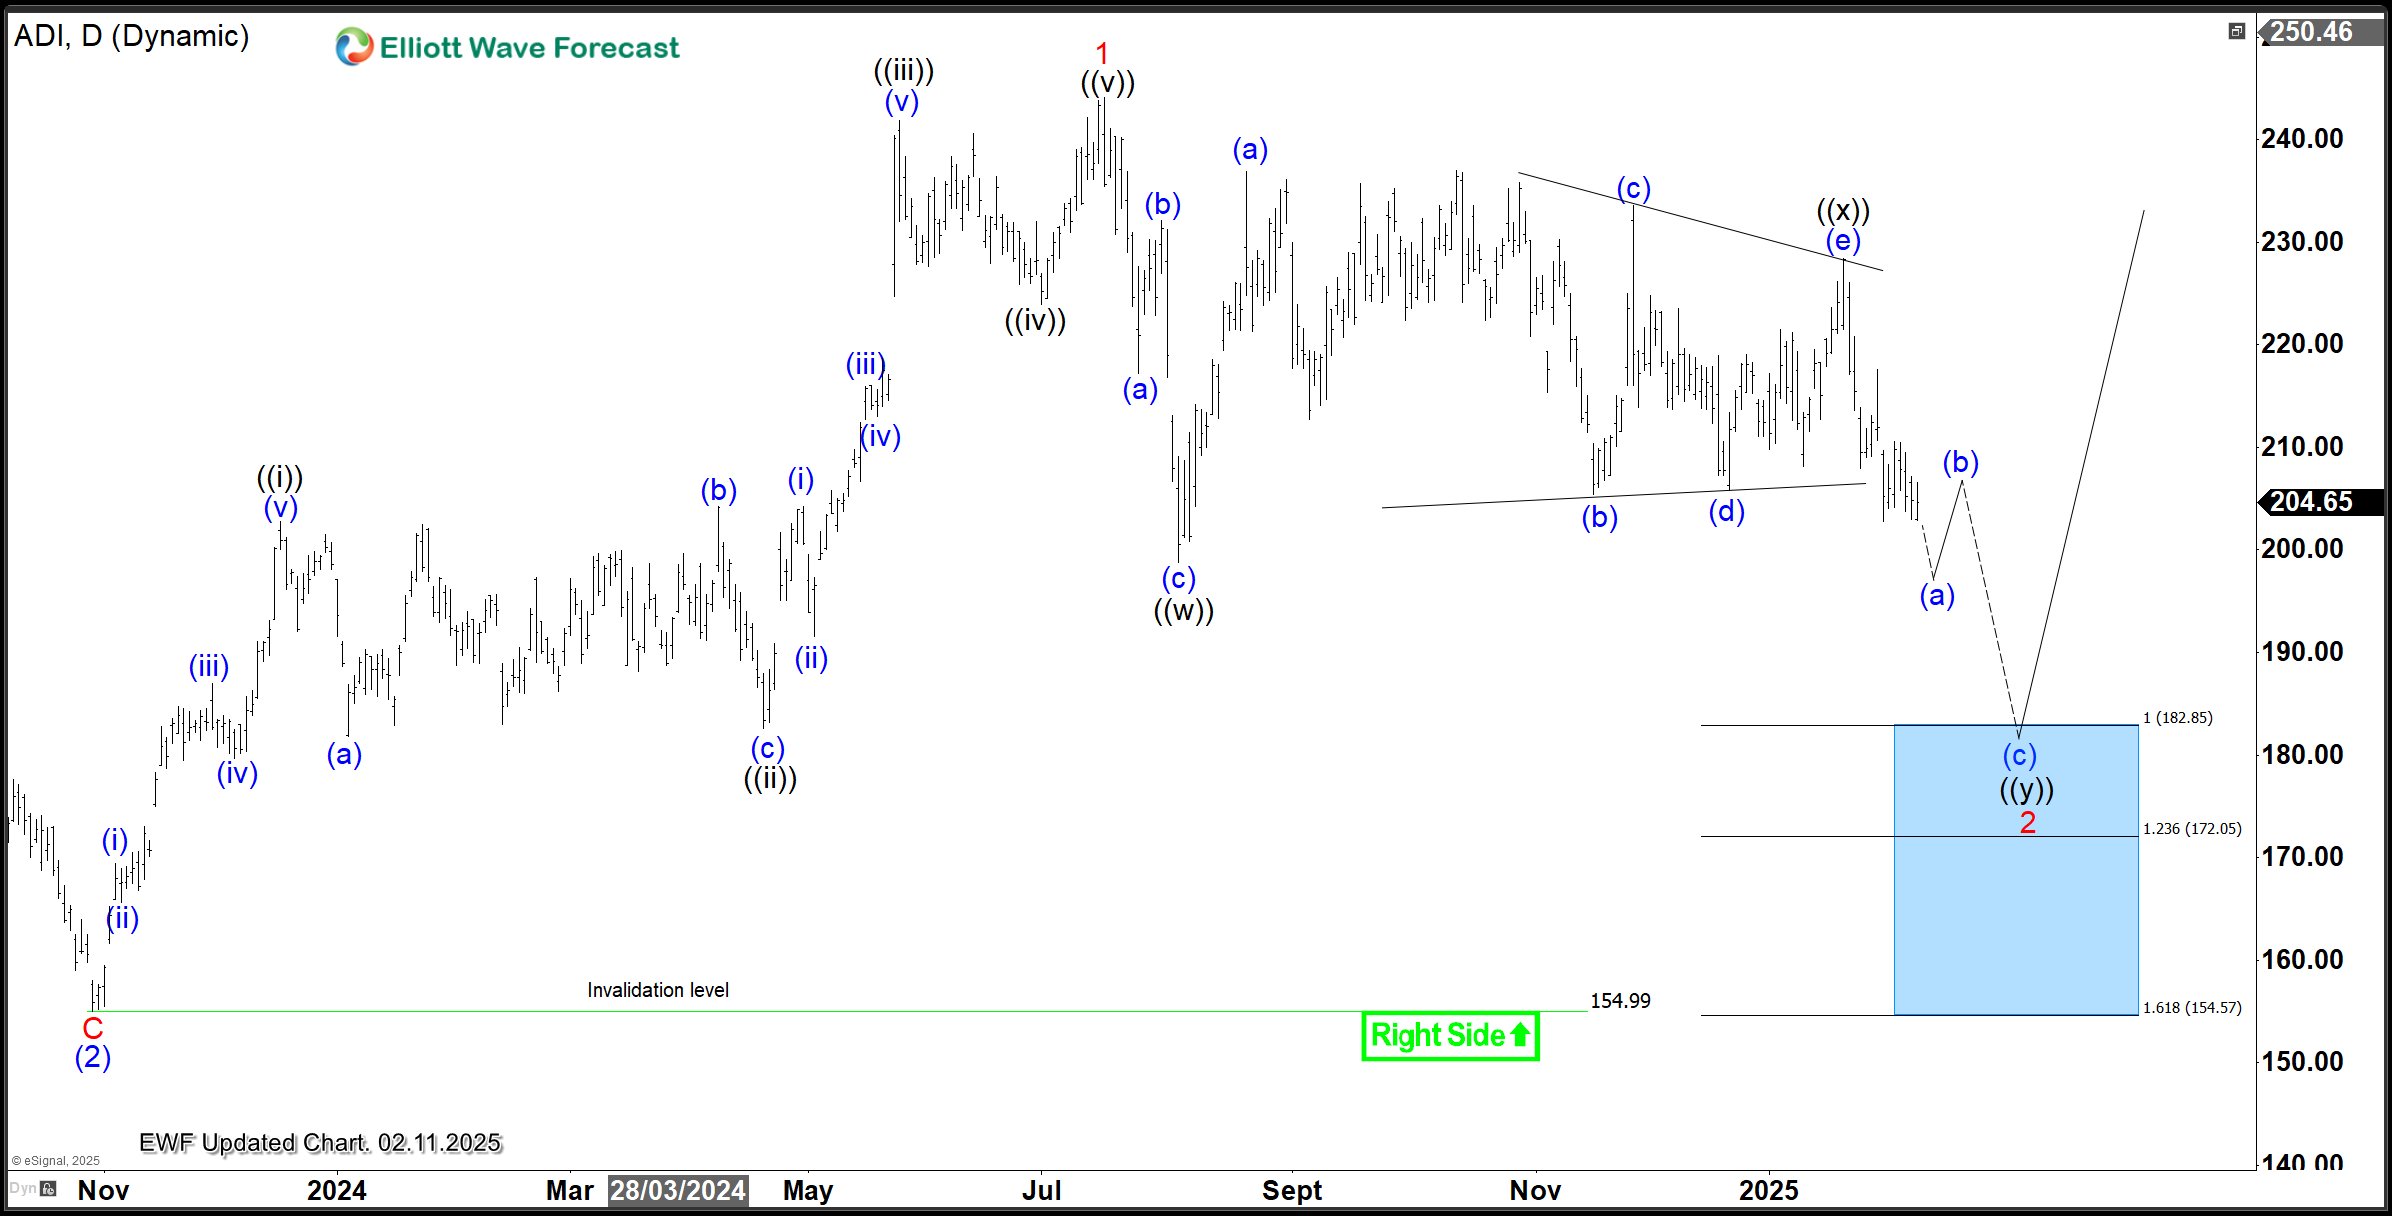
ADI Analysis: Buyers Await Next Blue Box After Booking Profit
Read MoreHello traders, welcome to another blog post discussing trading opportunities from the blue box. In this one, the spotlight will be on the Analog Devices, Inc. ADI. The post aims to reveal where to buy the ADI stock. Analog Devices, Inc. ADI is a global leader in designing and manufacturing integrated circuits and analog, mixed-signal, […]
-

SPDR Health Care ETF $XLV: 5 Waves Ended – Corrective Pullback Underway
Read MoreHello Traders! Today, we’ll dive into the 4H Elliott Wave structure of SPDR Health Care ETF ($XLV) and explain why the corrective pullback could present an excellent buying opportunity. Let’s analyze the price action and forecast the next steps. 5 Wave Impulse Structure + ABC correction $XLV 4H Elliott Wave View February 11th 2025: The 4H Elliott […]
-

Dell Technologies (DELL) Elliott Wave Analysis: Bullish Trend Resumes
Read MoreDELL’s Elliott Wave structure suggests the completion of a corrective wave IV, with a bullish continuation in progress. The larger timeframe chart reinforces the bullish outlook for Dell Technologies Inc. (DELL). It shows a long-term uptrend, with the stock completing a major wave II correction in 2022 before resuming its advance. Wave III peaked, followed […]