

The Power of 3-7-11 and the Grand Super Cycle: How We Saw the Bullish Turn in April 2025 Back on April 9, 2025, while World Indices were dropping sharply and global sentiment had turned overwhelmingly bearish, we published an article that challenged the fear-driven narrative. We explained why selling was not the right approach and […]
-
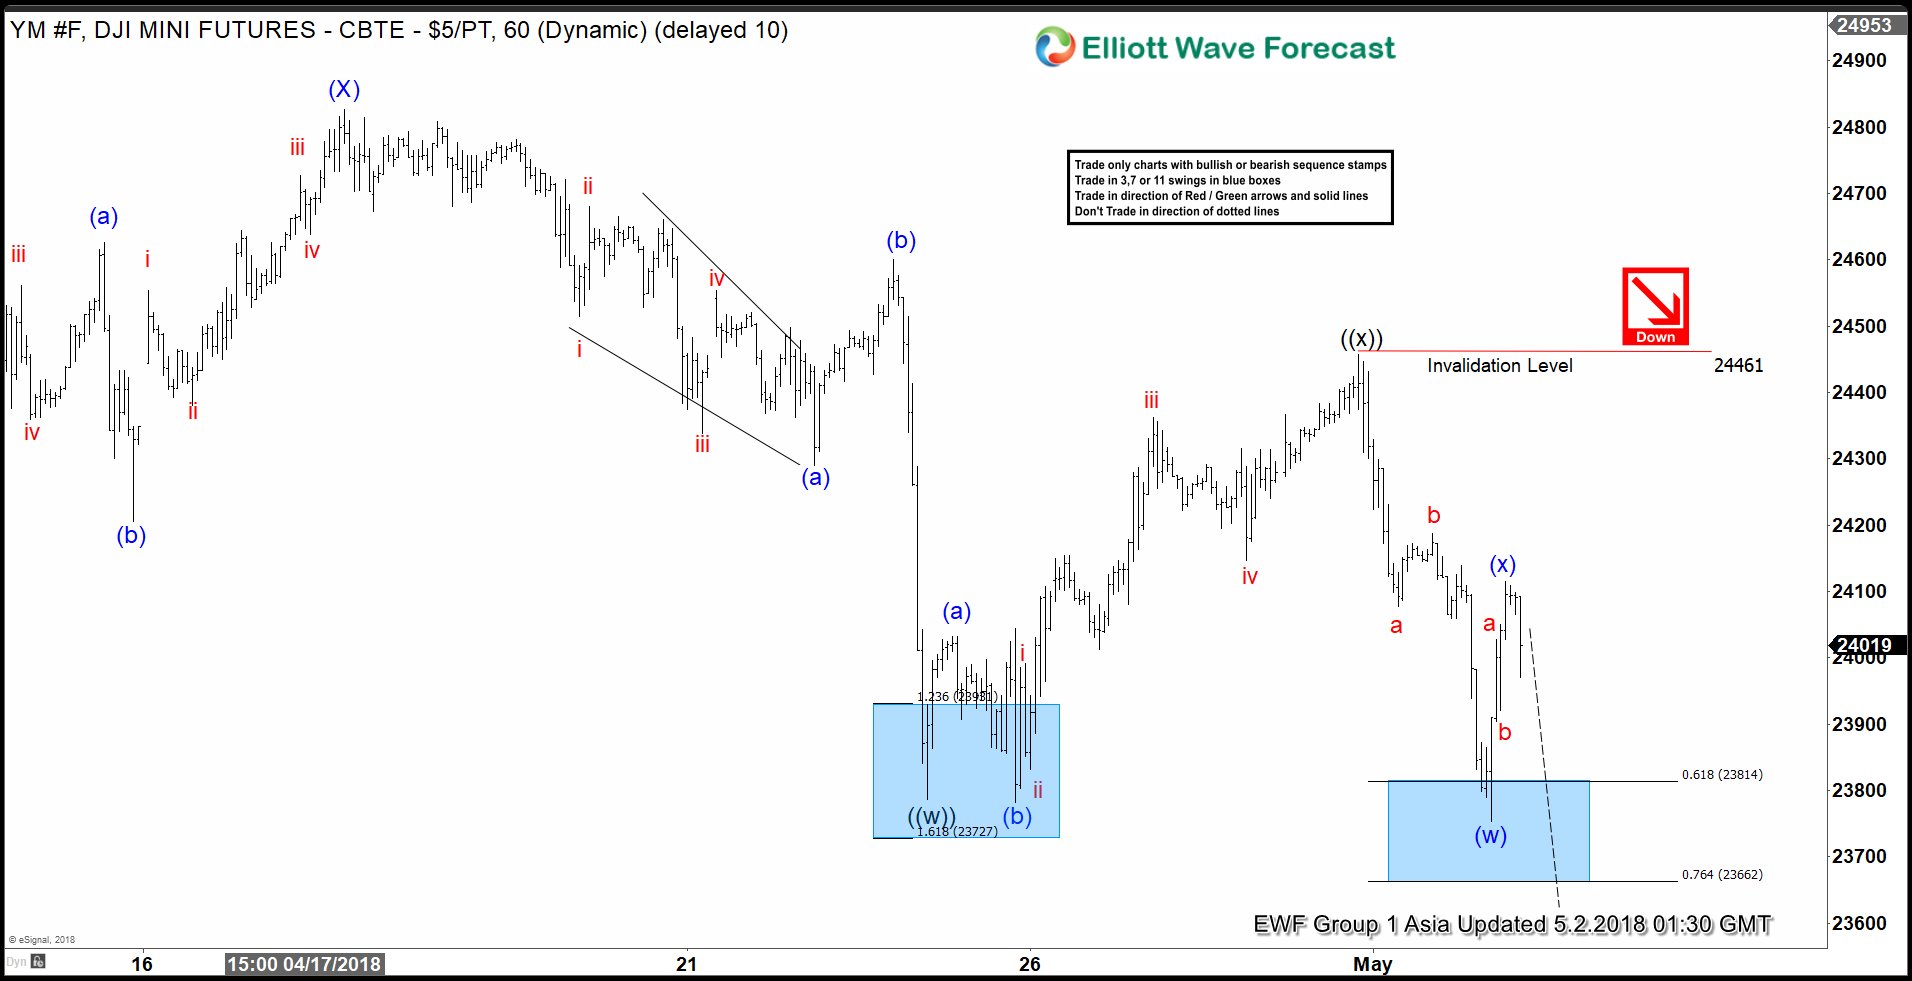
Dow Jones Elliott Wave View: Calling Lower
Read MoreDow Jones Elliott Wave view in short-term cycles suggests that the rally to 24827 on 4/17/2018 high ended Intermediate wave (X). Below from there, Intermediate wave (Y) remains in progress as overlapping structure suggesting that the move lower is corrective in nature. The move lower from 24827 peak is proposed to be unfolding as an Elliott […]
-
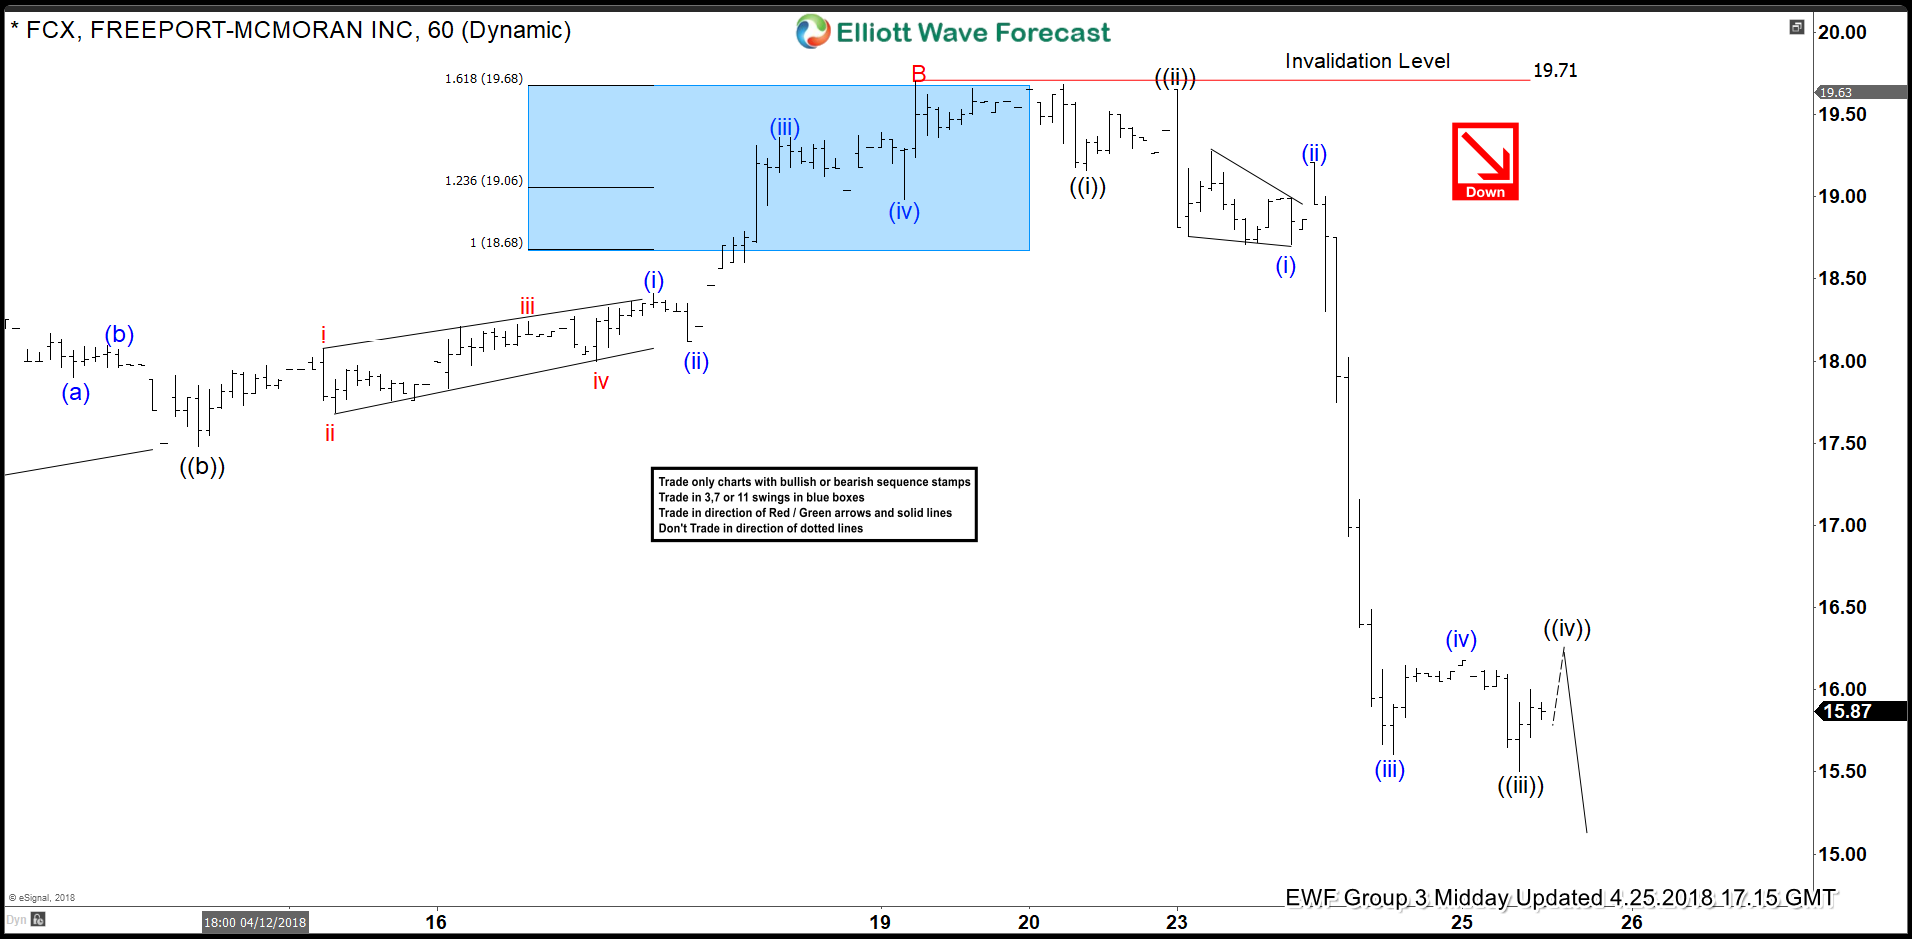
FCX Elliott Wave View: Extending Lower As Impulse
Read MoreFCX Elliott Wave view in short-term cycles suggest that the cycle from January 25th, 2018 peak is unfolding as Elliott wave flat correction. When Minor wave A ended in 3 swings at 16.51 and bounce to 19.71 April 19 high ended Minor wave B. Below from there, the stock reacted lower strongly and made new lows […]
-
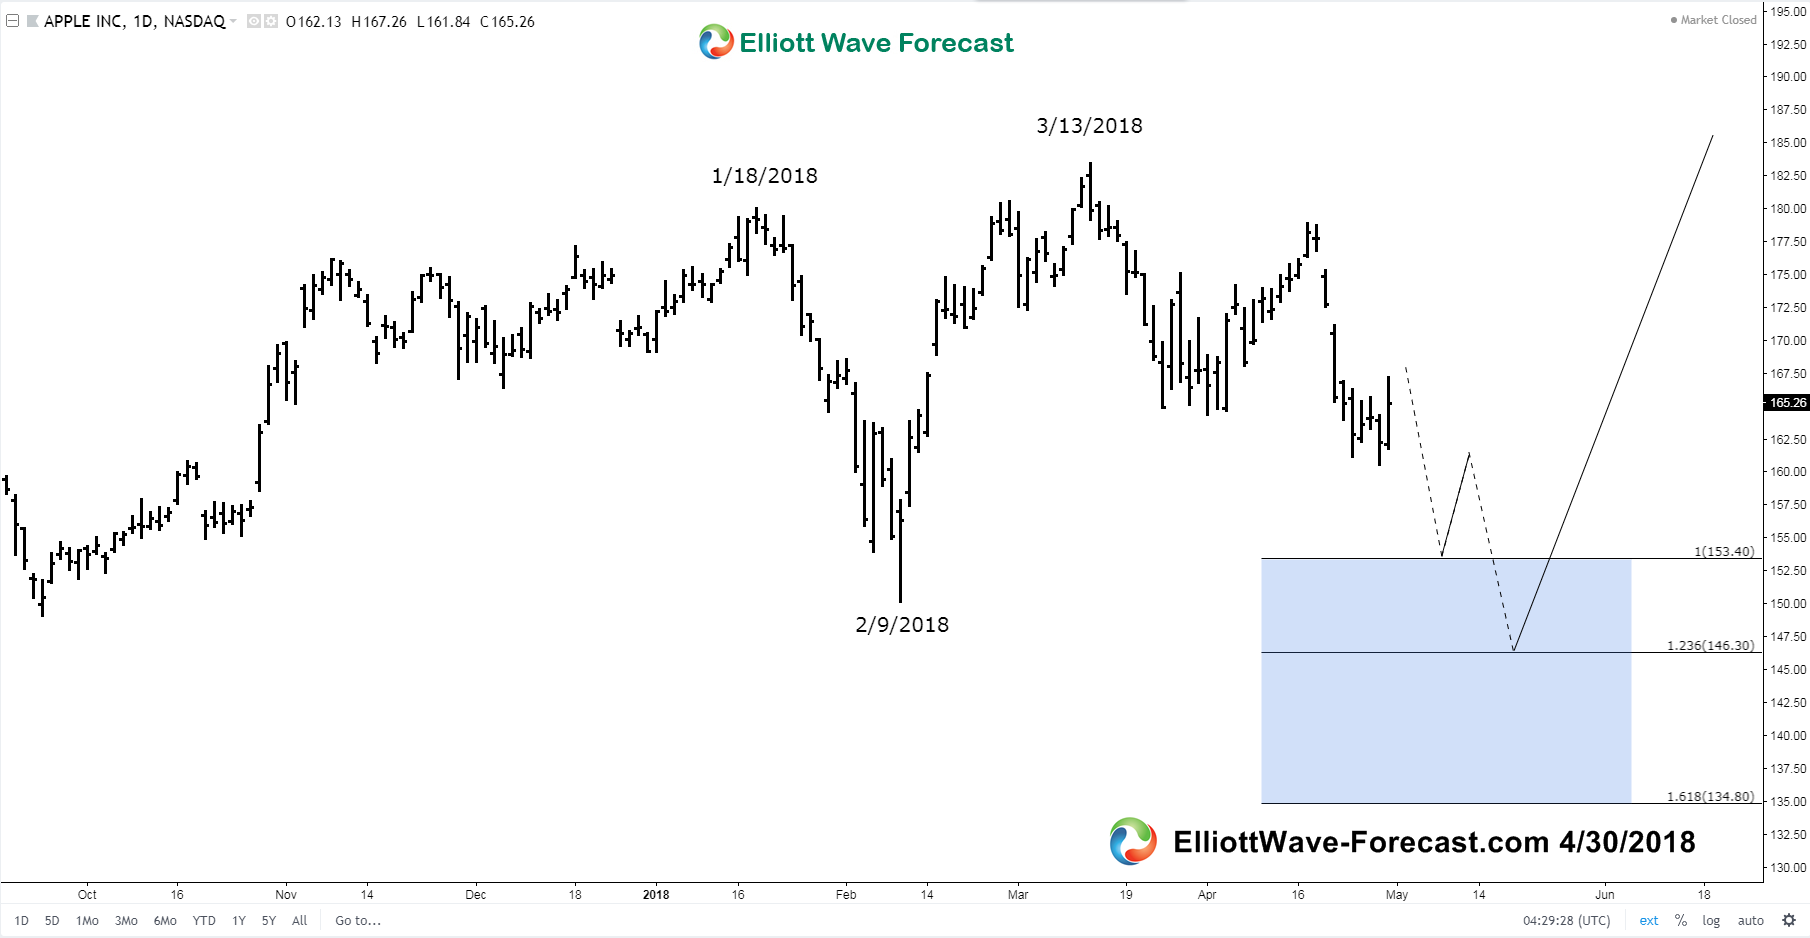
$AAPL Apple Expanded Flat from the 1/18/18 highs?
Read More$AAPL Apple Expanded Flat from the 1/18/18 highs? Is $AAPL Apple in an Expanded Flat from the 1/18/18 highs? Longer term on monthly and weekly charts it obviously appears that Apple remains in an uptrend. I will try to explain where the instrument can reach in the expanded flat from the 1/18/18 highs. I will […]
-
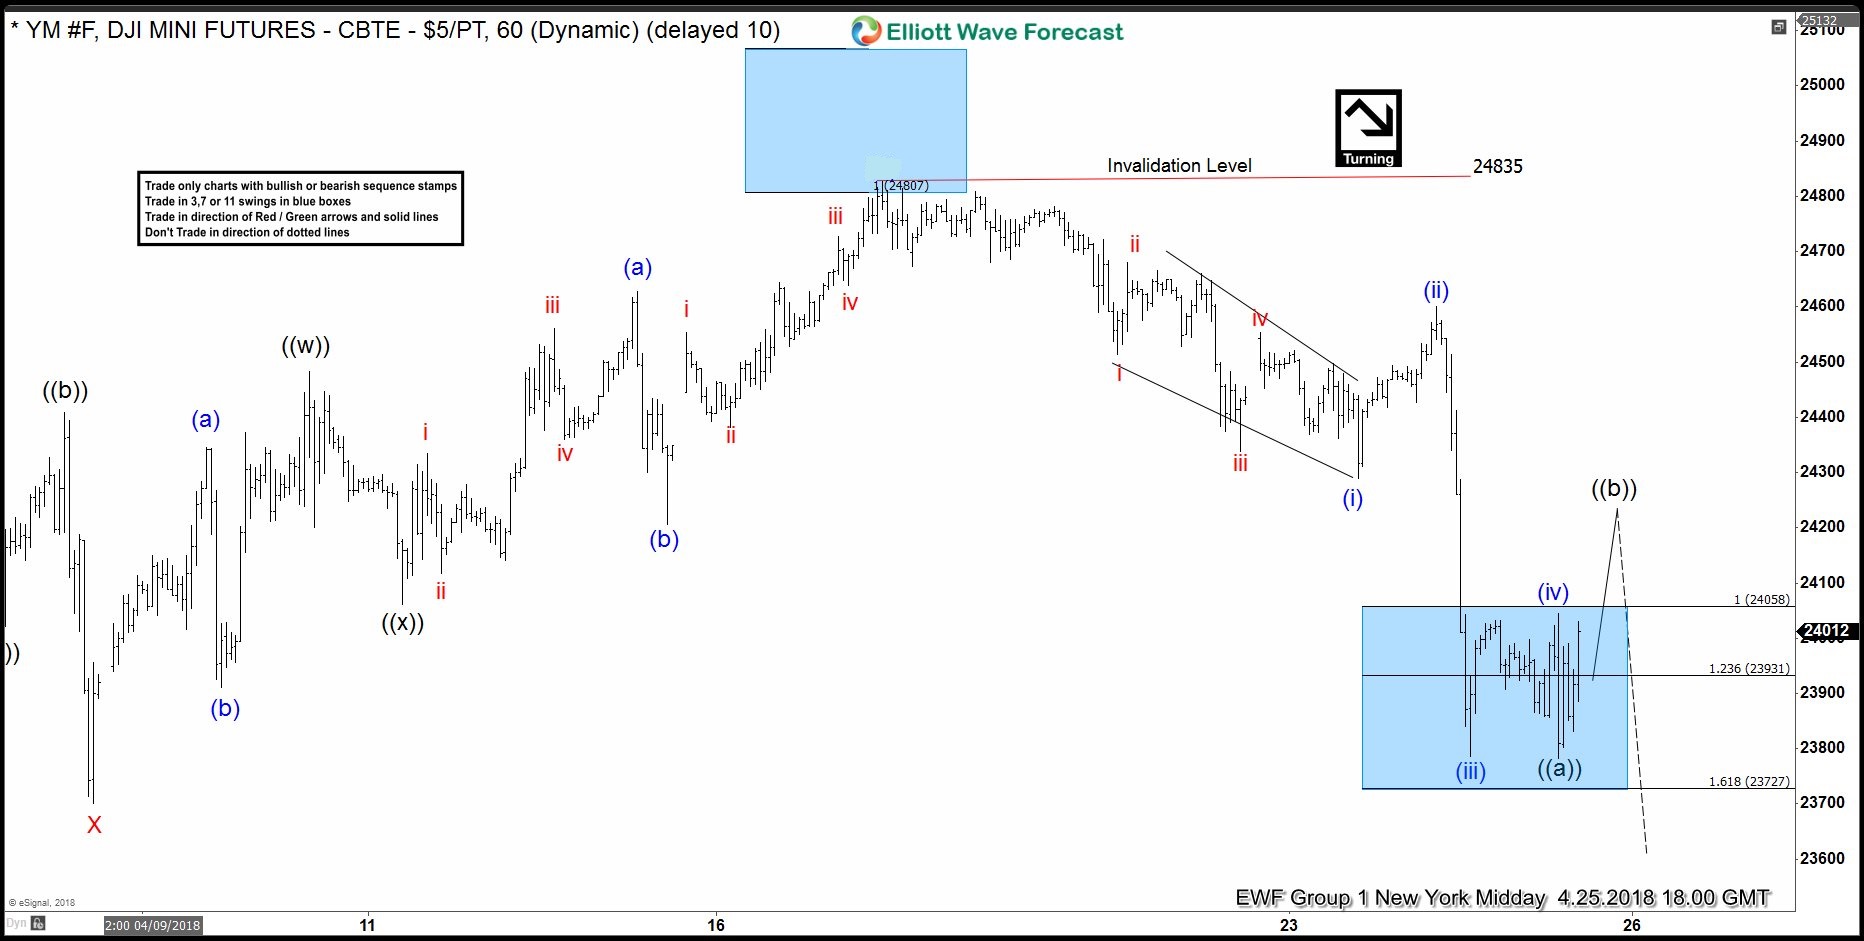
Dow Jones Elliott Wave: Calling The Turn From Inflection Area
Read MoreIn this blog, we will have a look at past Elliott Wave structures of the Dow Jones. In the chart below, you can see the 1-hour NY updated chart which we presented to our clients on the 04/16/18. Calling for an Elliott Wave double correction higher as the internals from red W-X-Y proposed to be unfolding […]
-
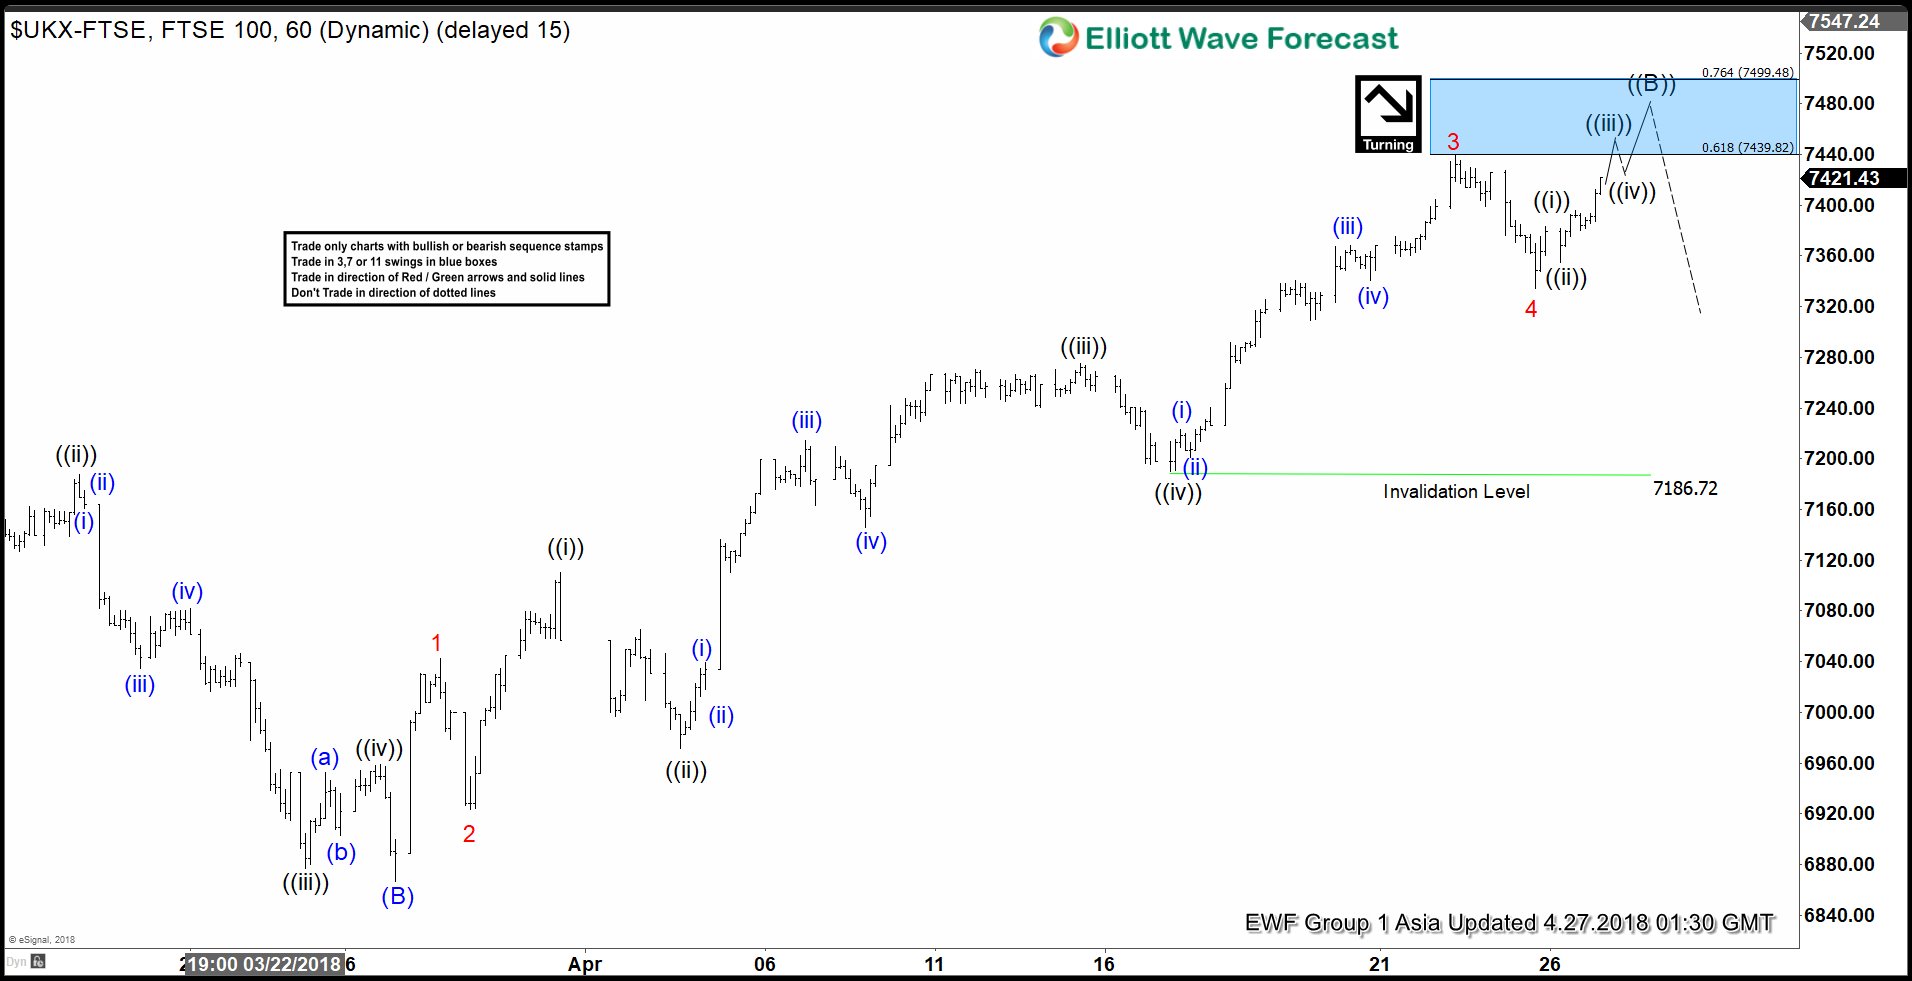
Does Elliott Wave View Suggest A Turn In FTSE Is Imminent?
Read MoreShort-term Elliott Wave view in FTSE suggest that the decline to 3/26/2018 low 6866.94 ended intermediate wave (B). Above from there, Intermediate wave (C) of ((B)) remains in progress with a strong rally to the upside unfolding as Impulse Elliott Wave structure. The internal distribution of each wave within the rally is unfolding as 5 waves […]
-
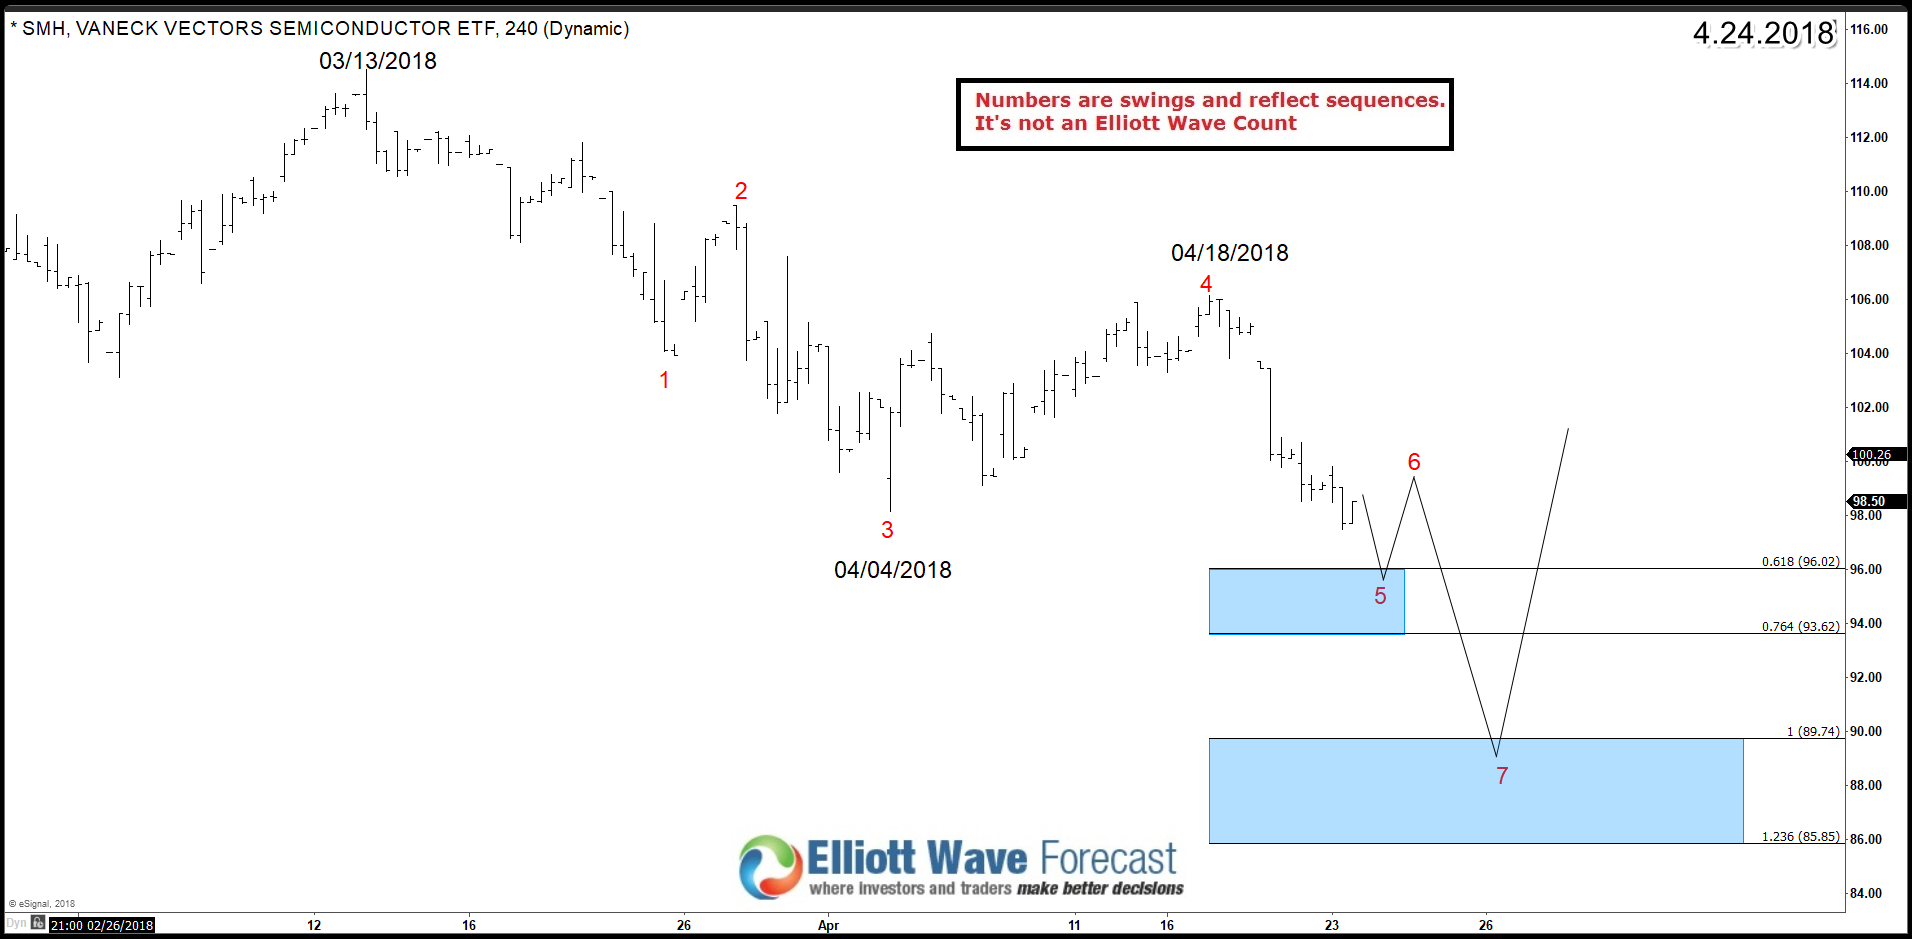
SMH Semiconductor ETF Leading the short term correction
Read MoreThe VanEck Vectors Semiconductor ETF (SMH) tracks a market-cap-weighted index of 25 of the largest US-listed semiconductors companies. Such companies include foreign companies that are listed on a U.S. exchange like Taiwan Semiconductor Manufacturing (TSM: NYSE) and also big technology companies like Intel (INTC: NASDAQ) or Nvidia (NVDA: NASDAQ). During this year, the Index made new all […]