

The Power of 3-7-11 and the Grand Super Cycle: How We Saw the Bullish Turn in April 2025 Back on April 9, 2025, while World Indices were dropping sharply and global sentiment had turned overwhelmingly bearish, we published an article that challenged the fear-driven narrative. We explained why selling was not the right approach and […]
-
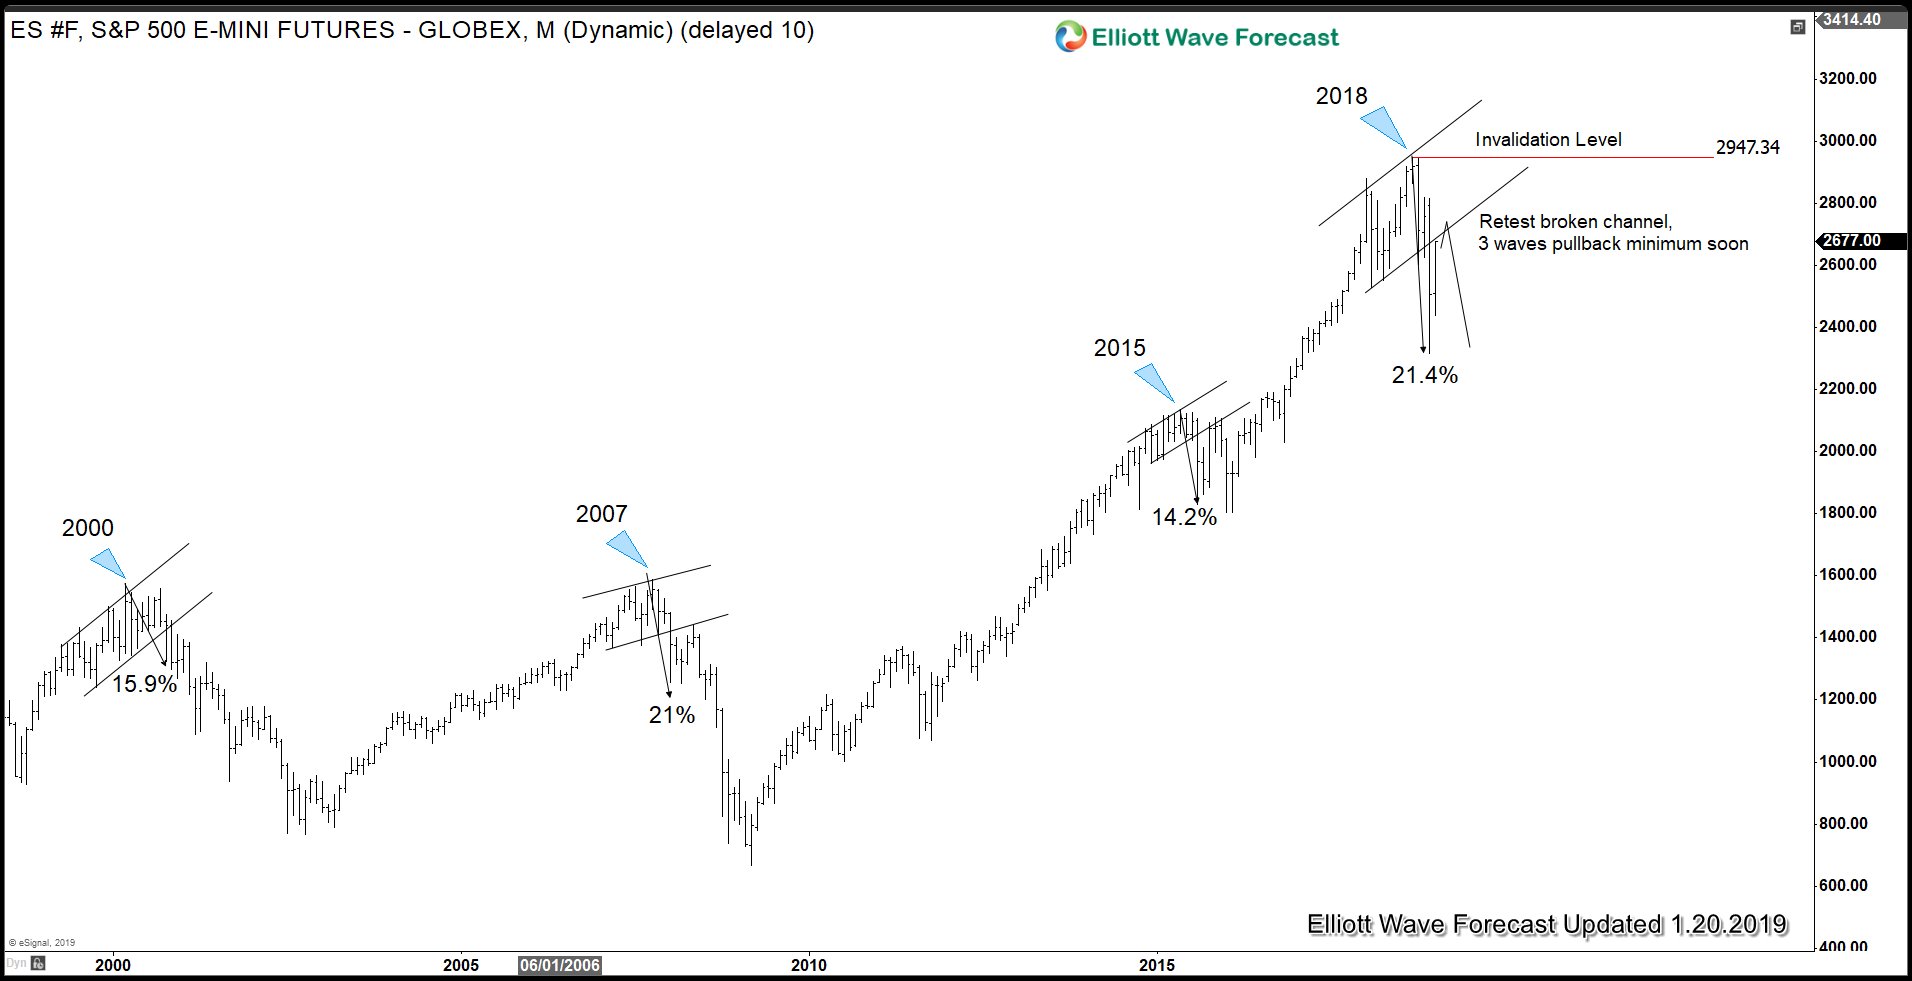
Is S&P 500 Ready to Make All-Time High?
Read MoreS&P 500 formed a significant high at 2947 on Sept 21, 2018 after a 342% rally in 10 years. During the entire rally from year 2009 low, there was no major correction in the Index, that is until last year. In less than 3 months, the Index has dropped 21.4% from the peak. The Index […]
-
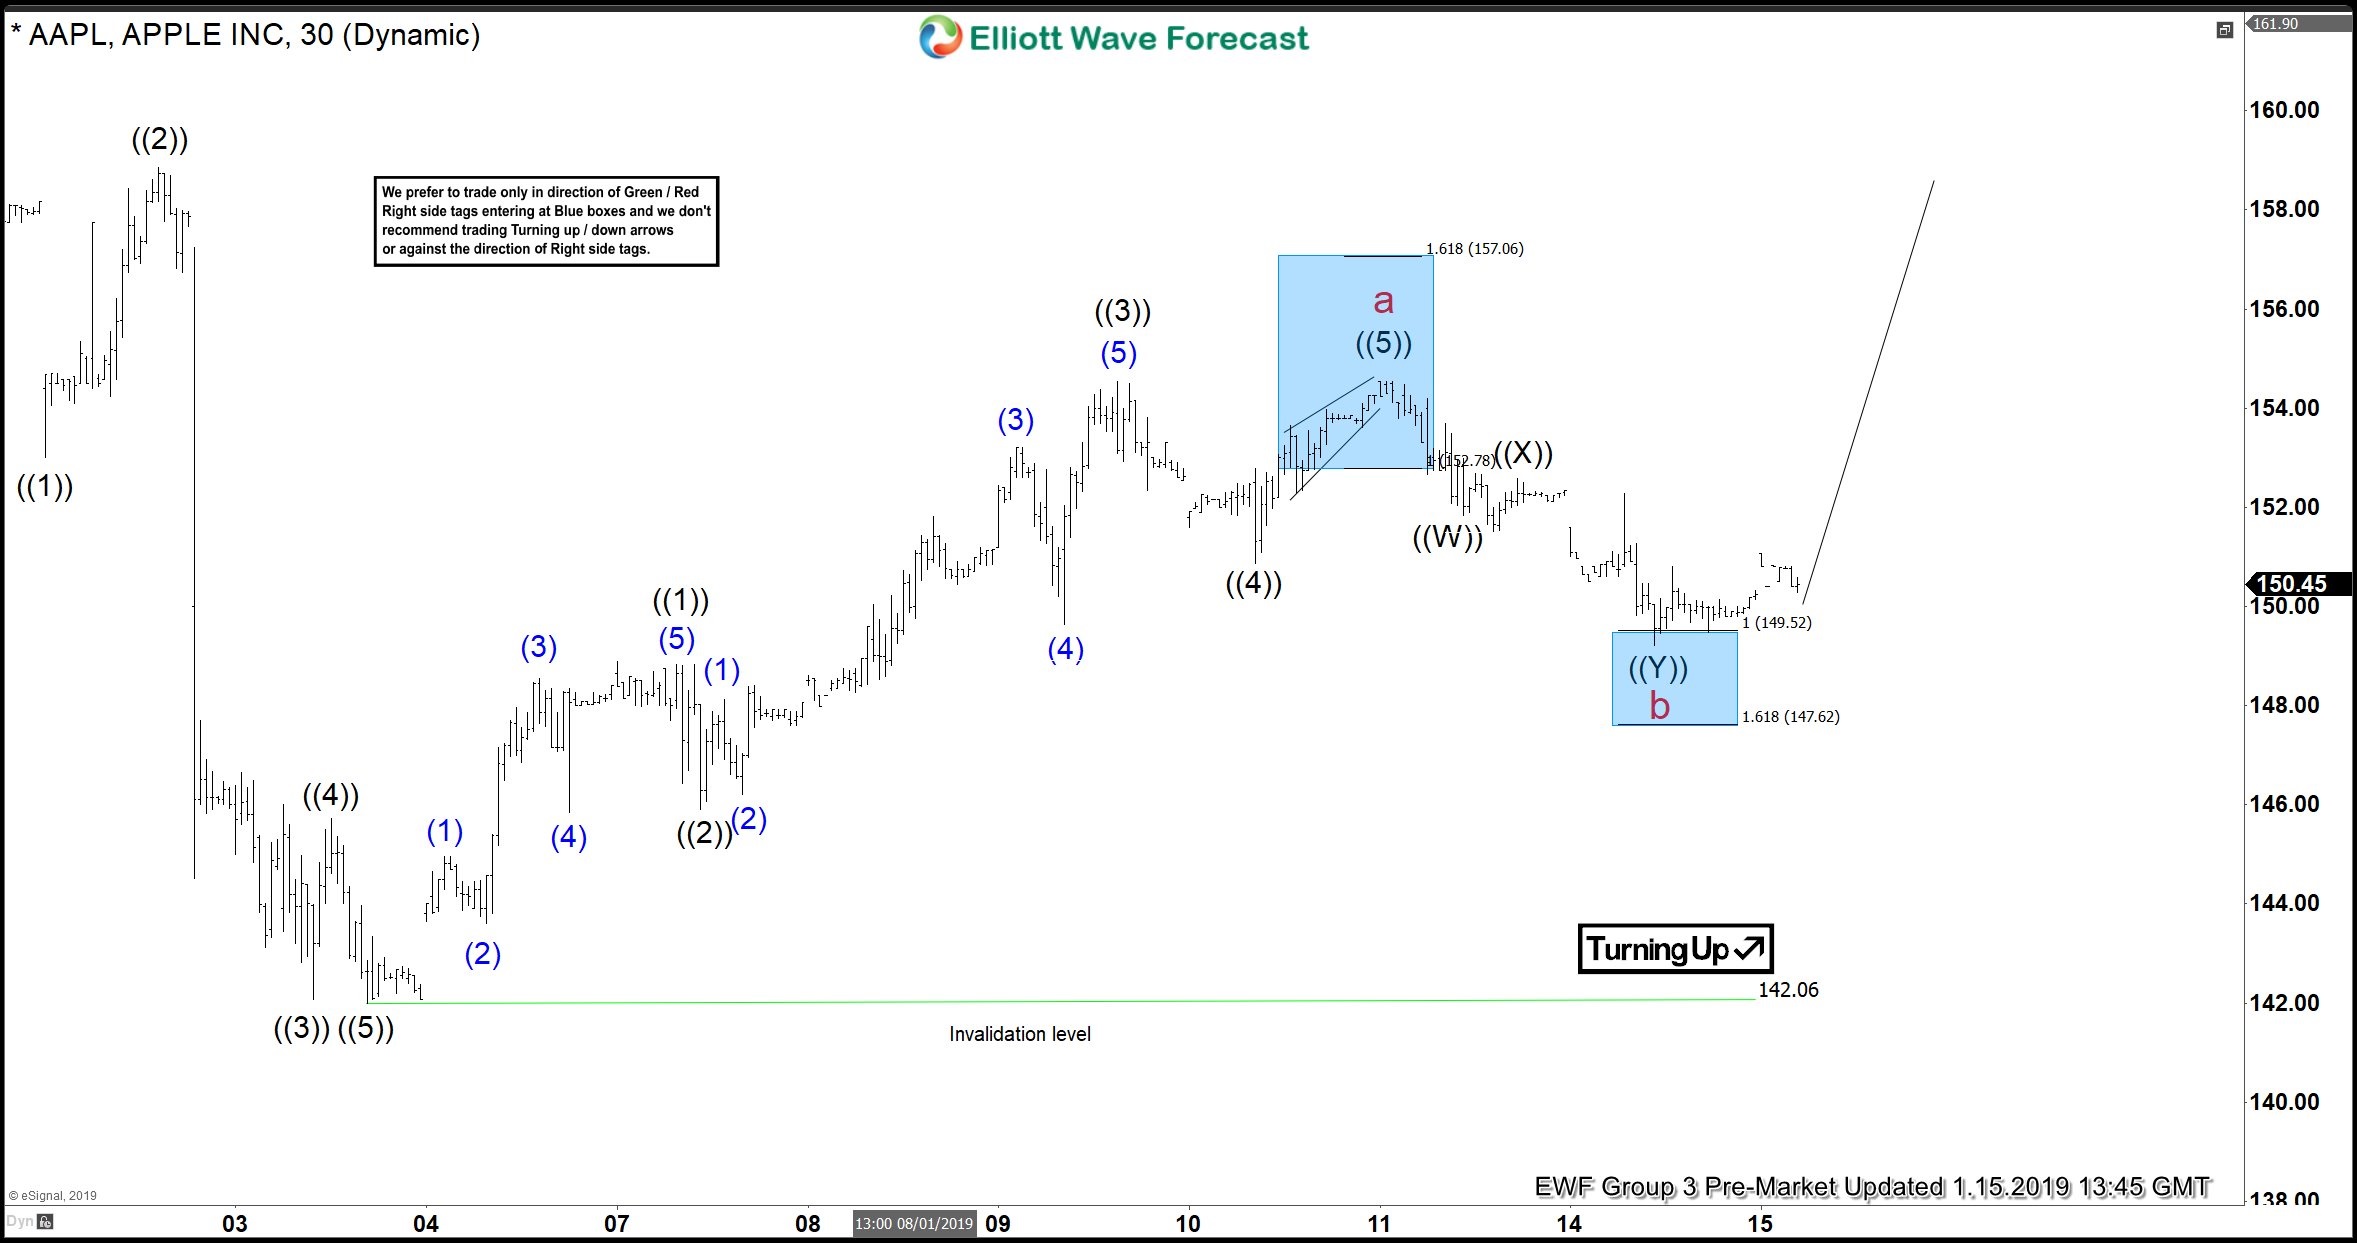
Apple Forecasting The Elliott Wave Bounce
Read MoreIn this technical blog, we are going to take a look at the past performance of Apple ticker symbol: $AAPL, 1 hour Elliott Wave charts that we presented to our clients. We are going to explain the structure and the forecast below. Apple 1 Hour Elliott Wave Chart From 01/13/2019 Above is the 1 Hour Elliott […]
-

Elliott Wave View: FTSE Can See Another Leg Higher
Read MoreShort term Elliott Wave view in FTSE suggests that the decline to 6534.59 ended wave ((A)). Wave ((B)) bounce is in progress as a zigzag Elliott Wave structure. Up from 6534.59, wave (A) ended at 7001.94. The internal of wave (A) unfolded as a 5 waves Impulse Elliott Wave structure. Wave 1 ended at 6752.54, […]
-
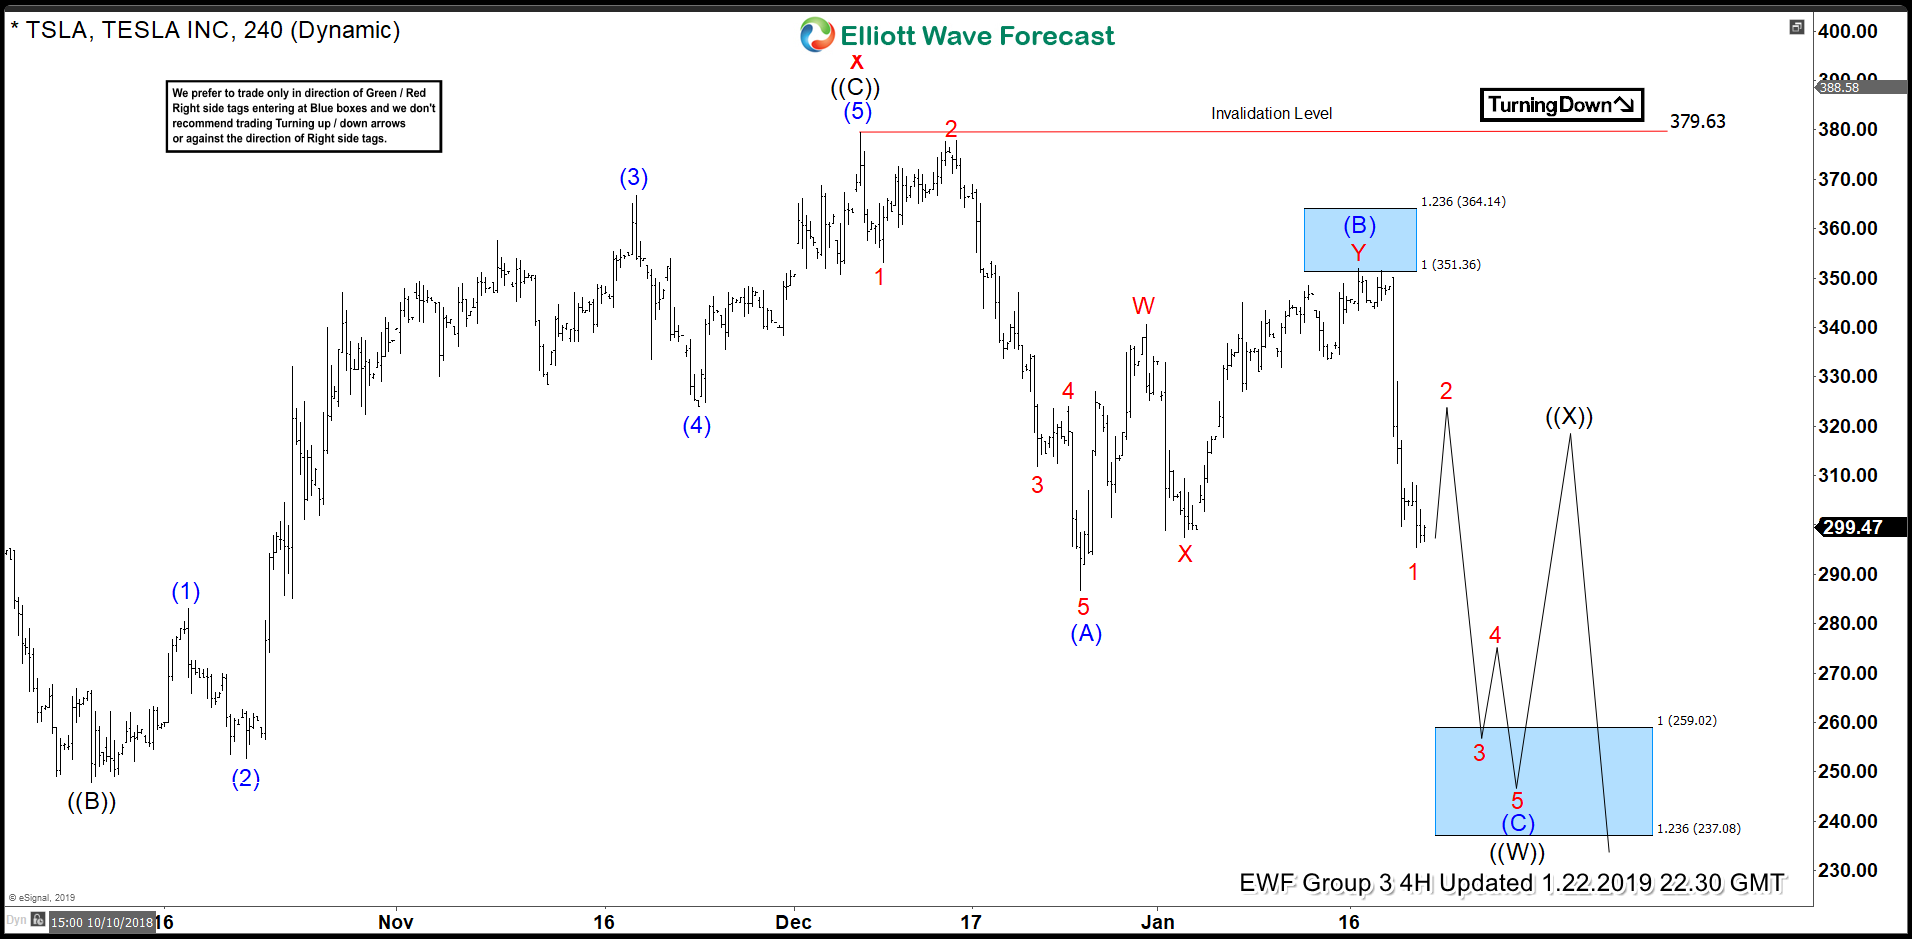
TSLA Leading Stocks Lower
Read MoreThe current price action and Elliott wave analysis suggest further declines for TSLA shares. Not even a full month into the new year TSLA shares have already seen 2 large declines. The first drop was blamed on a pricing adjustments for U.S. vehicles. The 2nd drop is being blamed over layoffs and unappealing guidance. Bearish […]
-
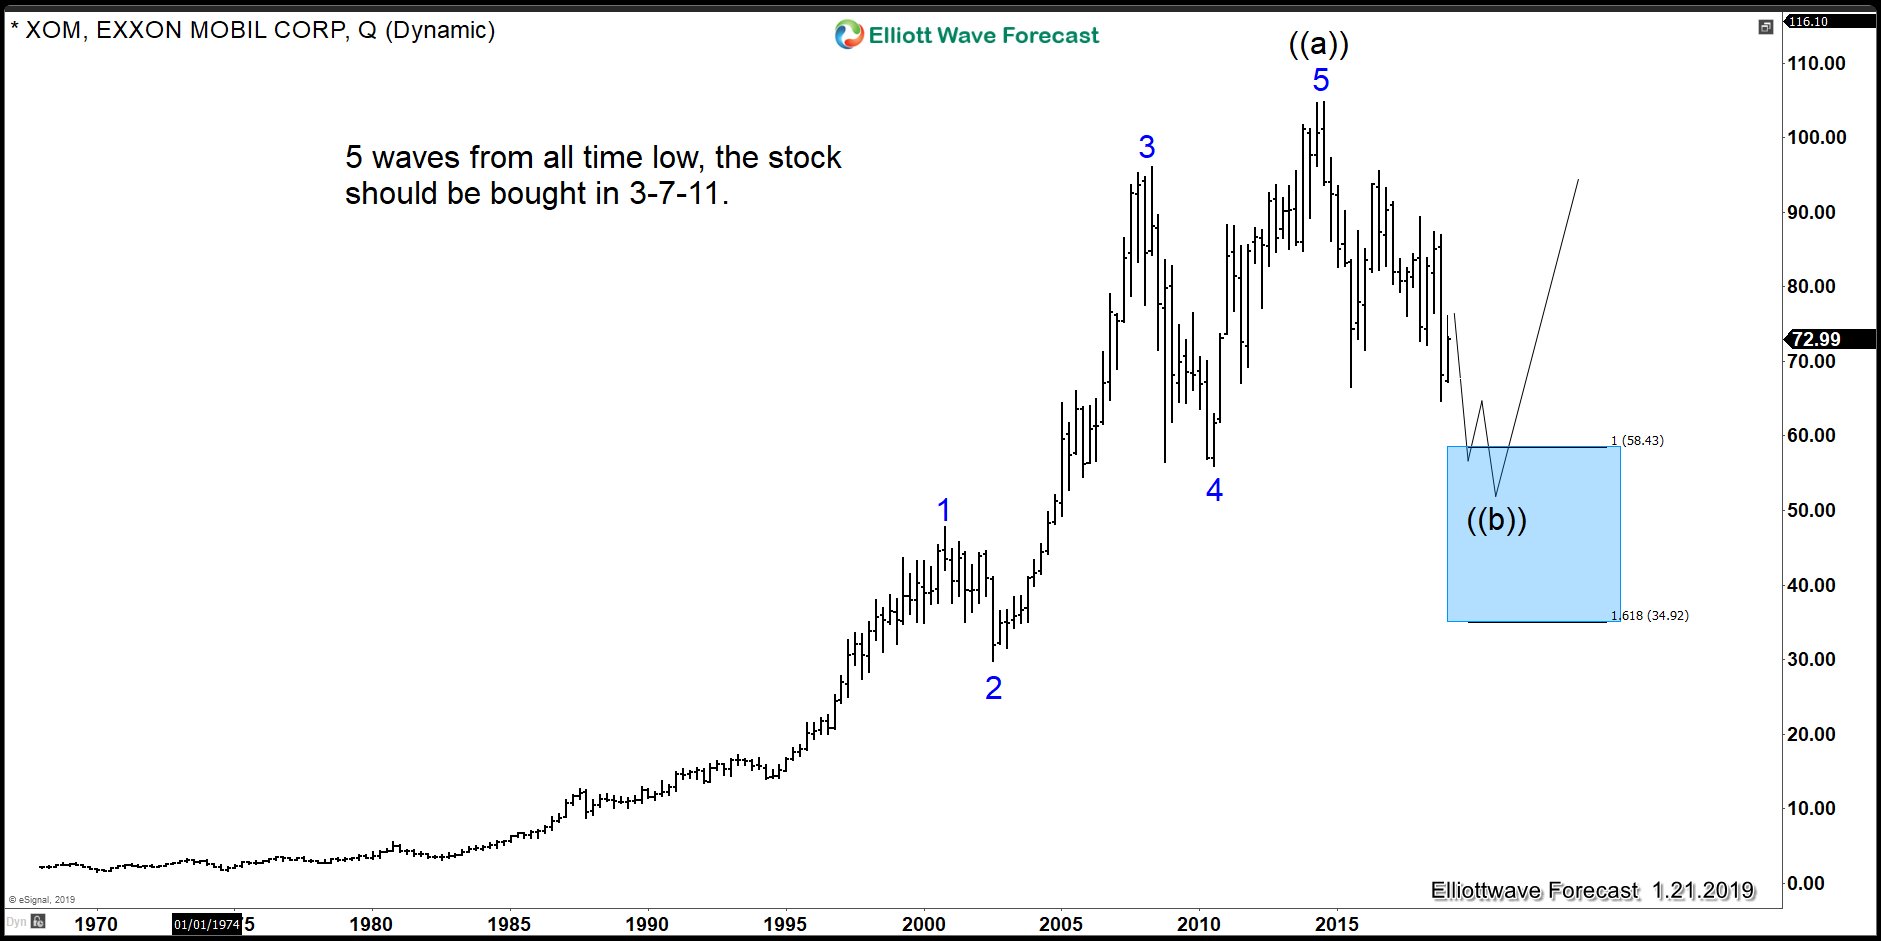
Exxon Mobil : An Elliott Wave Theory Pattern to Perfection
Read MoreThe Elliott Wave Theory is based on the idea that the market advances in 5 waves and pullback in 3 waves. The idea has become very famous and millions of traders around the world practice it. We at Elliott Wave Forecast have been introducing new ideas to make the theory better. We developed a system […]
-
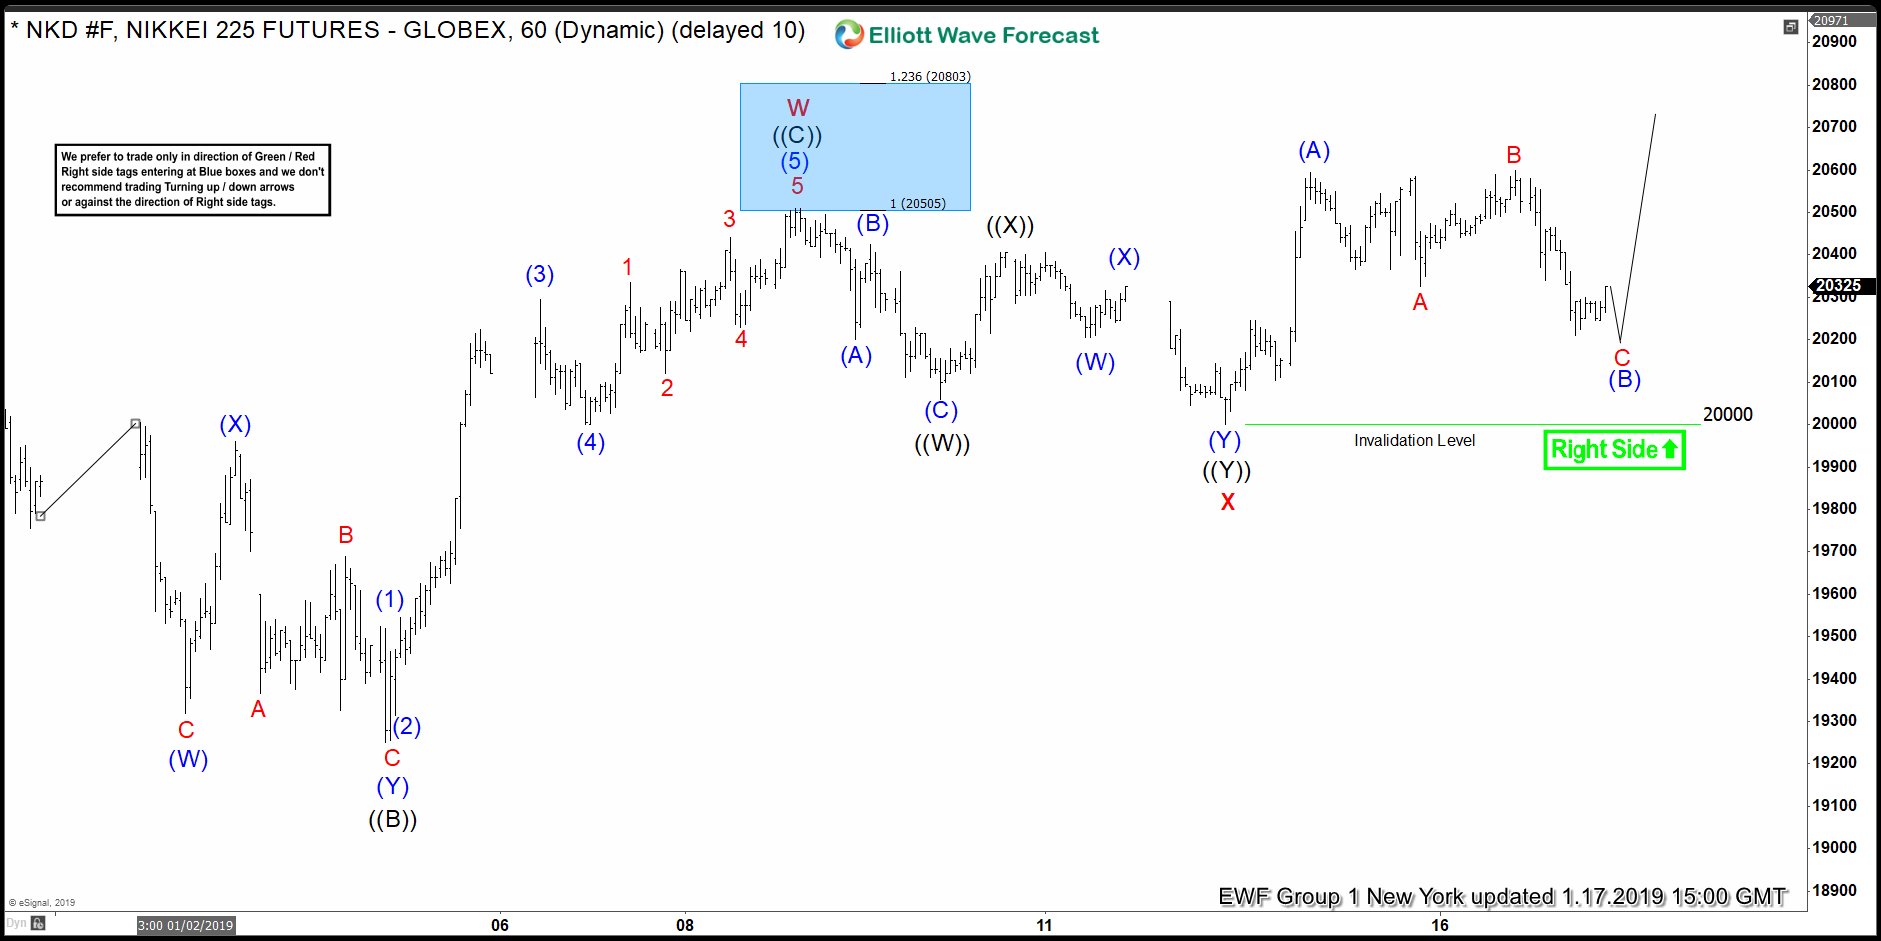
Elliott Wave Analysis: NIKKEI Rallies With The Right Side
Read MoreWelcome traders, today we look at a couple of 1 hour NIKKEI charts and its price action within 3 consecutive days. The following analysis will show how profitable and efficient it can be to trade with our philosophy and basic Elliott Wave analysis. First of all, we start on January 14 where the right side of […]