

The Power of 3-7-11 and the Grand Super Cycle: How We Saw the Bullish Turn in April 2025 Back on April 9, 2025, while World Indices were dropping sharply and global sentiment had turned overwhelmingly bearish, we published an article that challenged the fear-driven narrative. We explained why selling was not the right approach and […]
-
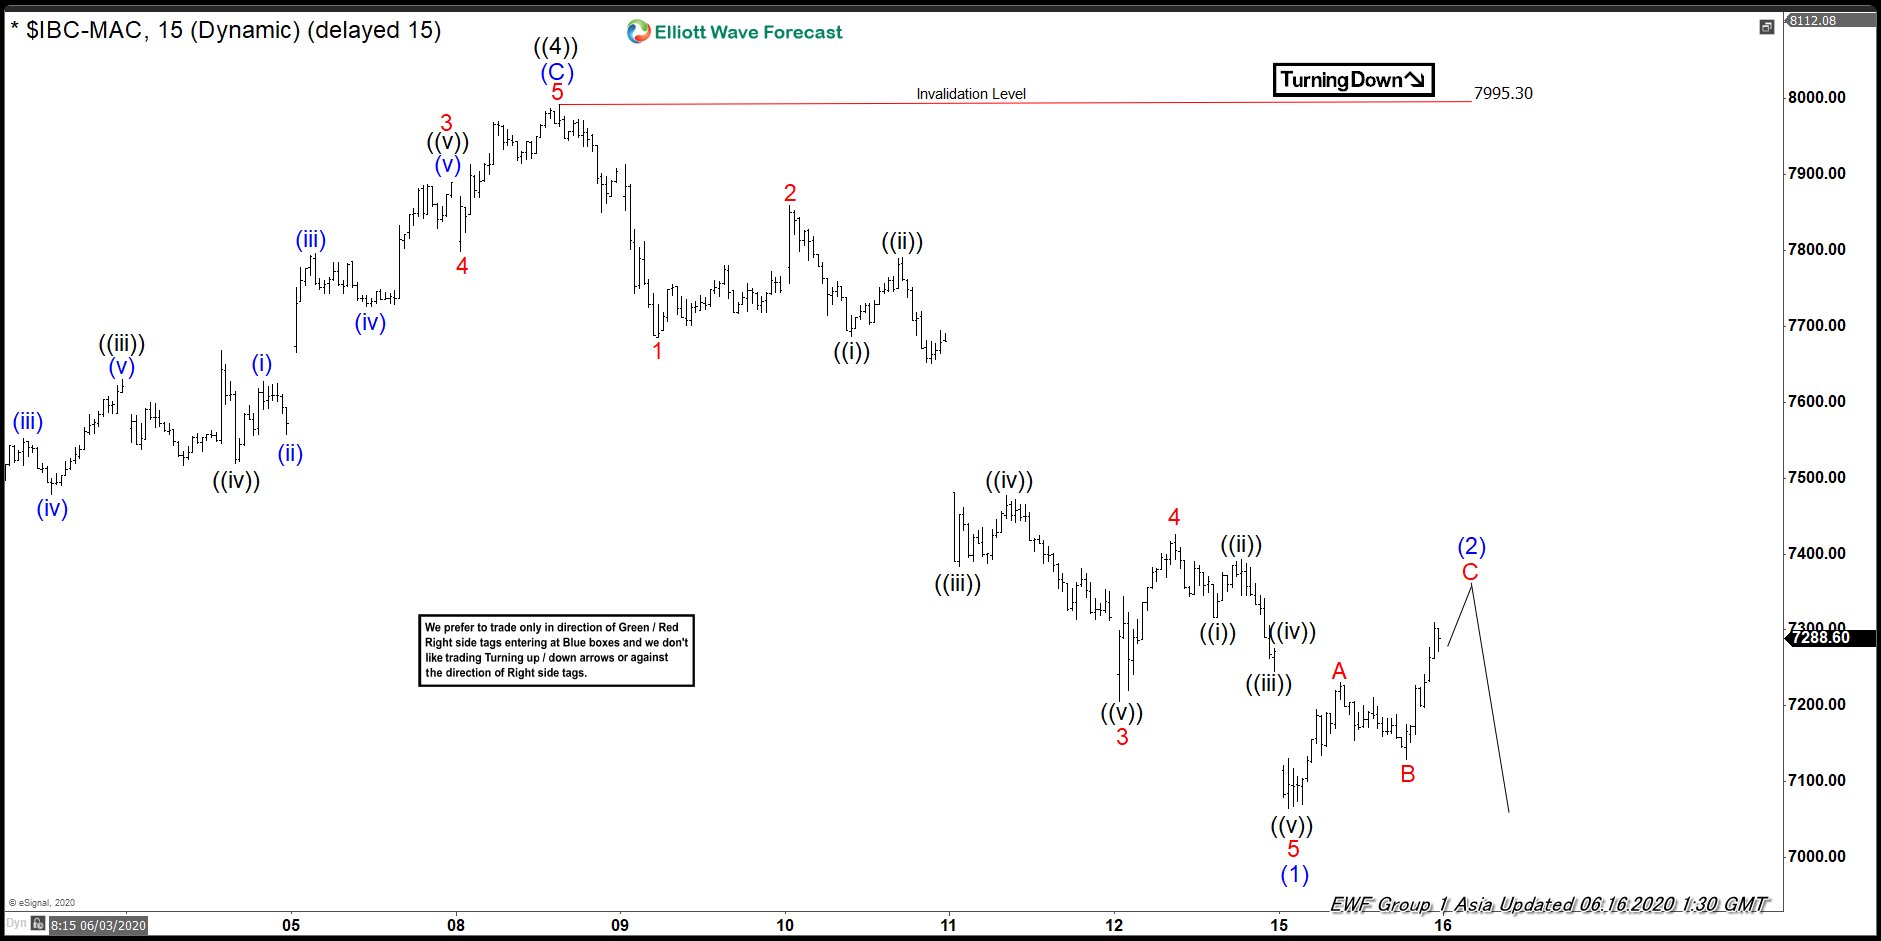
Elliott Wave View: IBEX Has Turned Lower
Read MoreIBEX ended cycle from 3.16.2020 low and starts to turn lower. This article and video look at the Elliott Wave path of the Index.
-
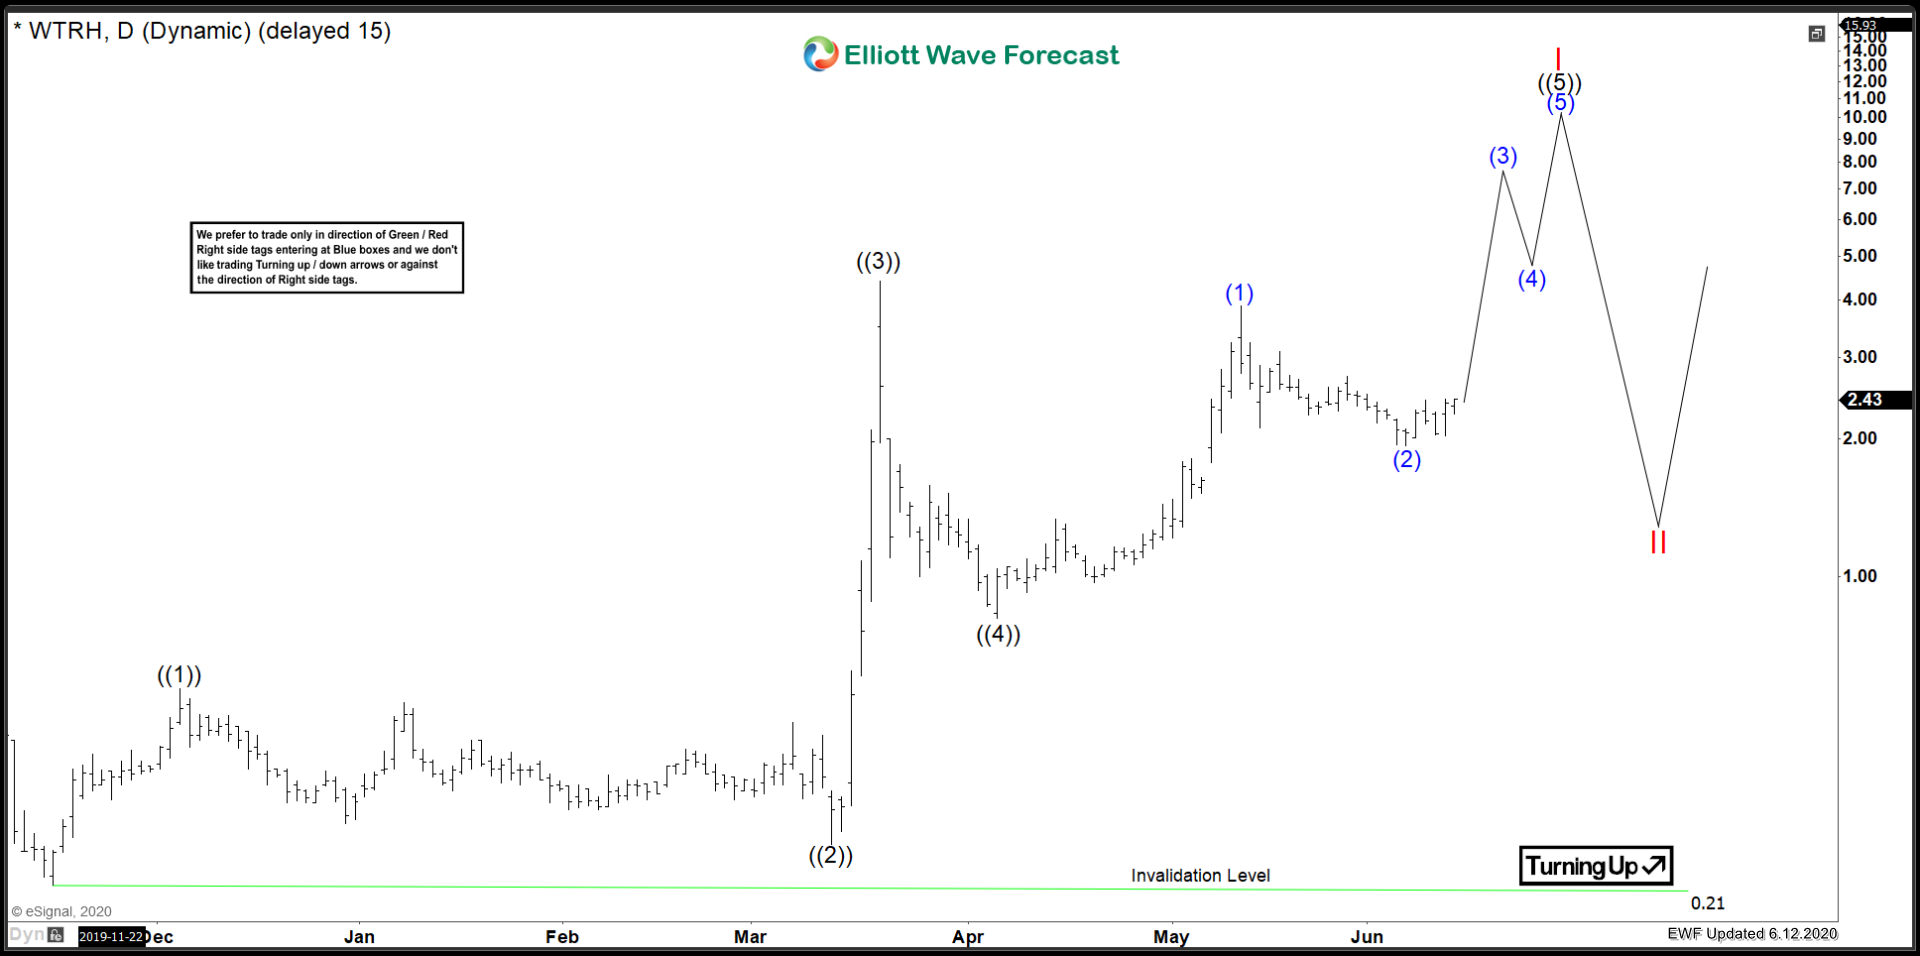
Waitr Holdings Inc ($WTRH) Incomplete Sequence
Read MoreThe next entry in the theme of Corona Virus stocks is Waitr Holdings Inc ($WTRH). Biotech and software are not the only sectors benefitting greatly from the COVID-19 outbreak. The food delivery services are also making huge gains since the lows. Waitr has had an unbelievable run, let’s take a look at the history of […]
-
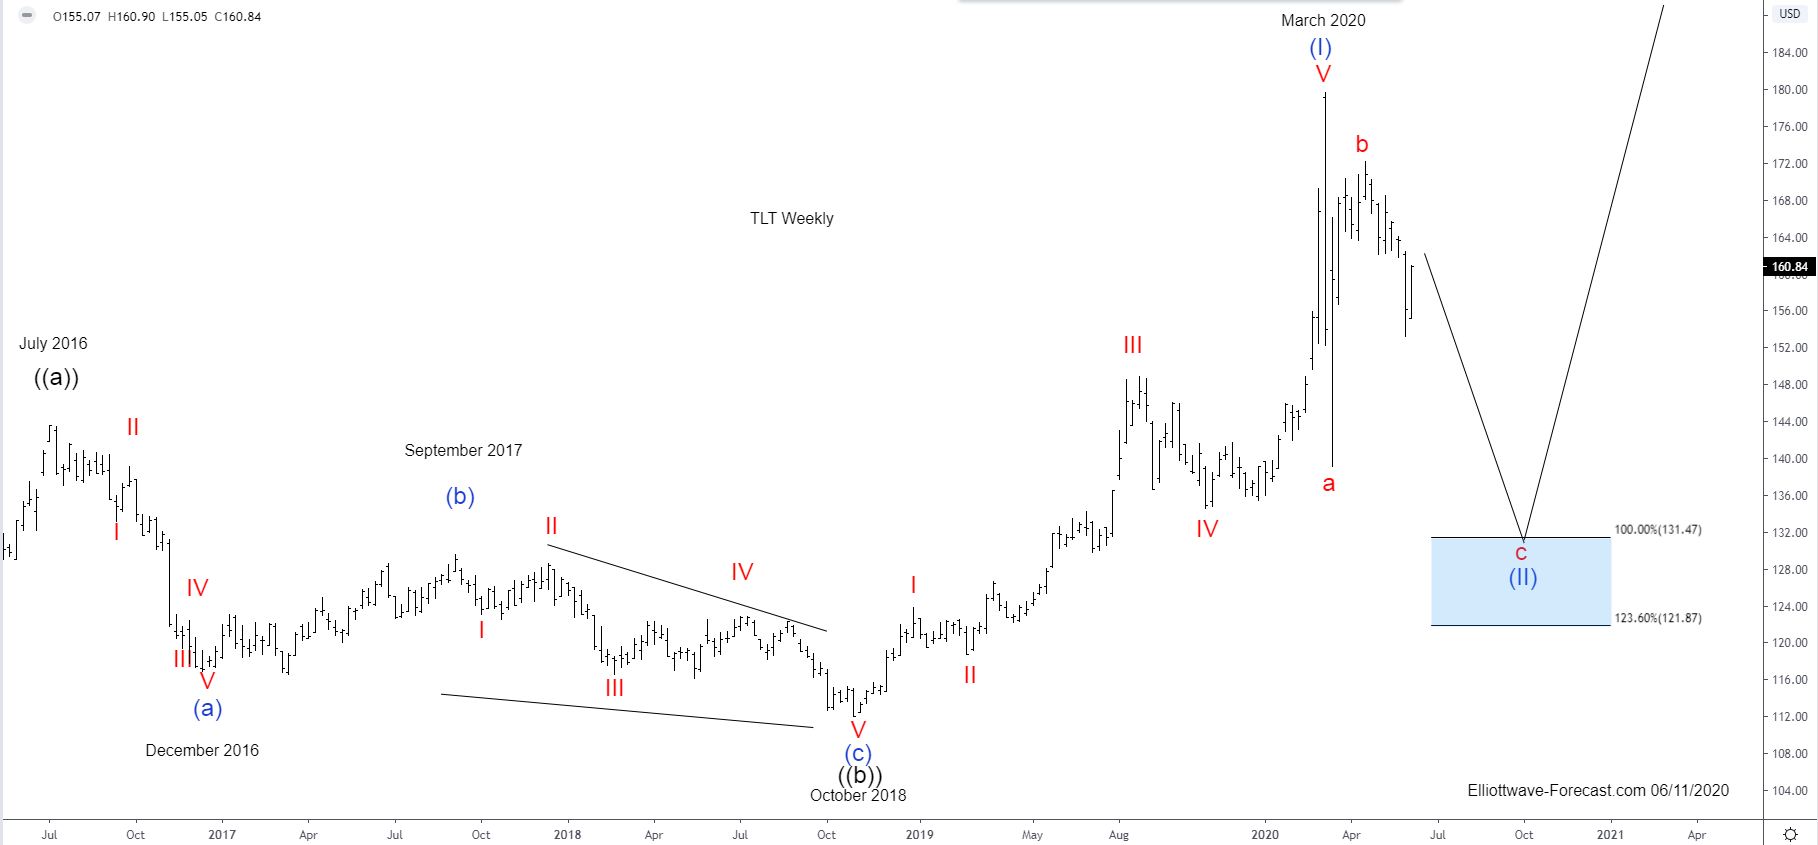
$TLT Elliott Wave & Longer Term Cycles
Read More$TLT Elliott Wave & Longer Term Cycles Firstly the ETF fund TLT inception date was on July 22, 2002. This instrument seeks to track the investment results of an index composed of or in U.S. Treasury bonds with maturities twenty years or more remaining. There is a lack of data before July 22, 2002. This is established. This […]
-

American Airlines (AAL): A Turn Higher Taking Place
Read MoreIn this article, we will take a look at American Airlines (AAL). Currently, the instrument could be within the process of turning to much higher levels. American Airlines (AAL) was hit with selling pressure during the financial market sell-off in March 2020. Nevertheless, the whole Transportation Sector was already within a correction cycle before Covid-19 […]
-
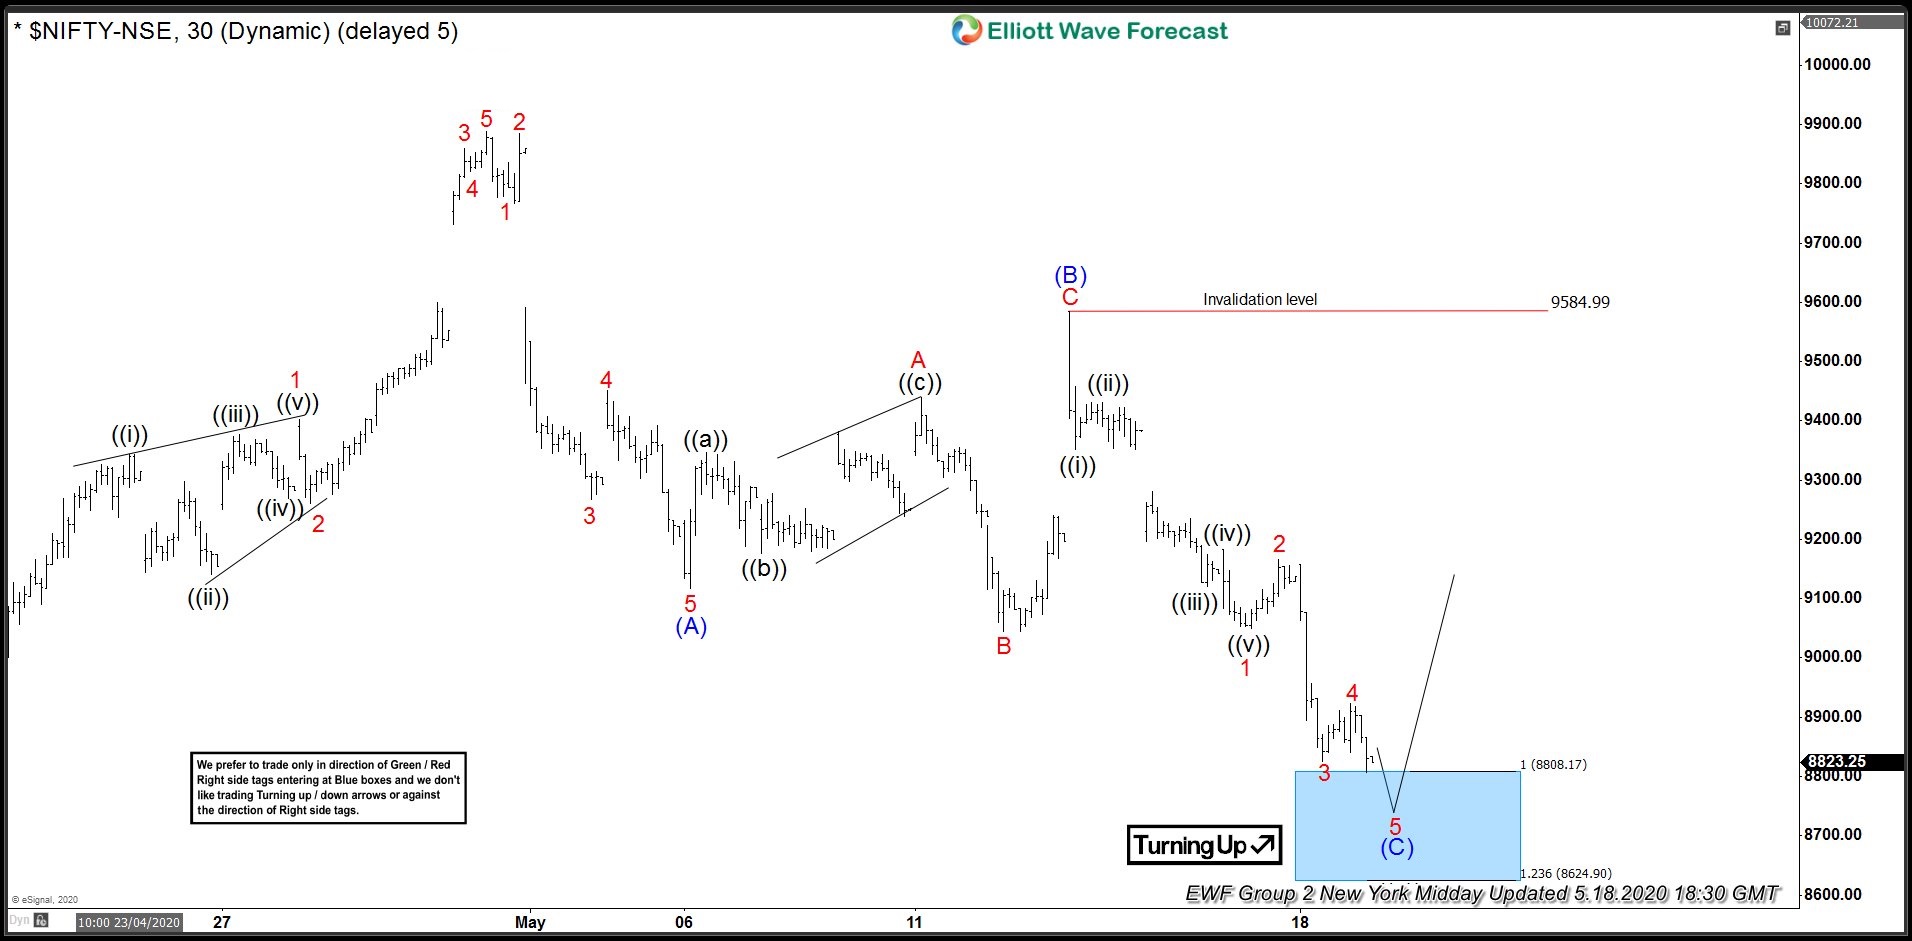
Nifty Reacted Higher Perfectly From Blue Box Area
Read MoreIn this blog, we take a look at the past performance of 1 hour Elliott Wave charts of Nifty index In which our members took advantage of the blue box areas.
-
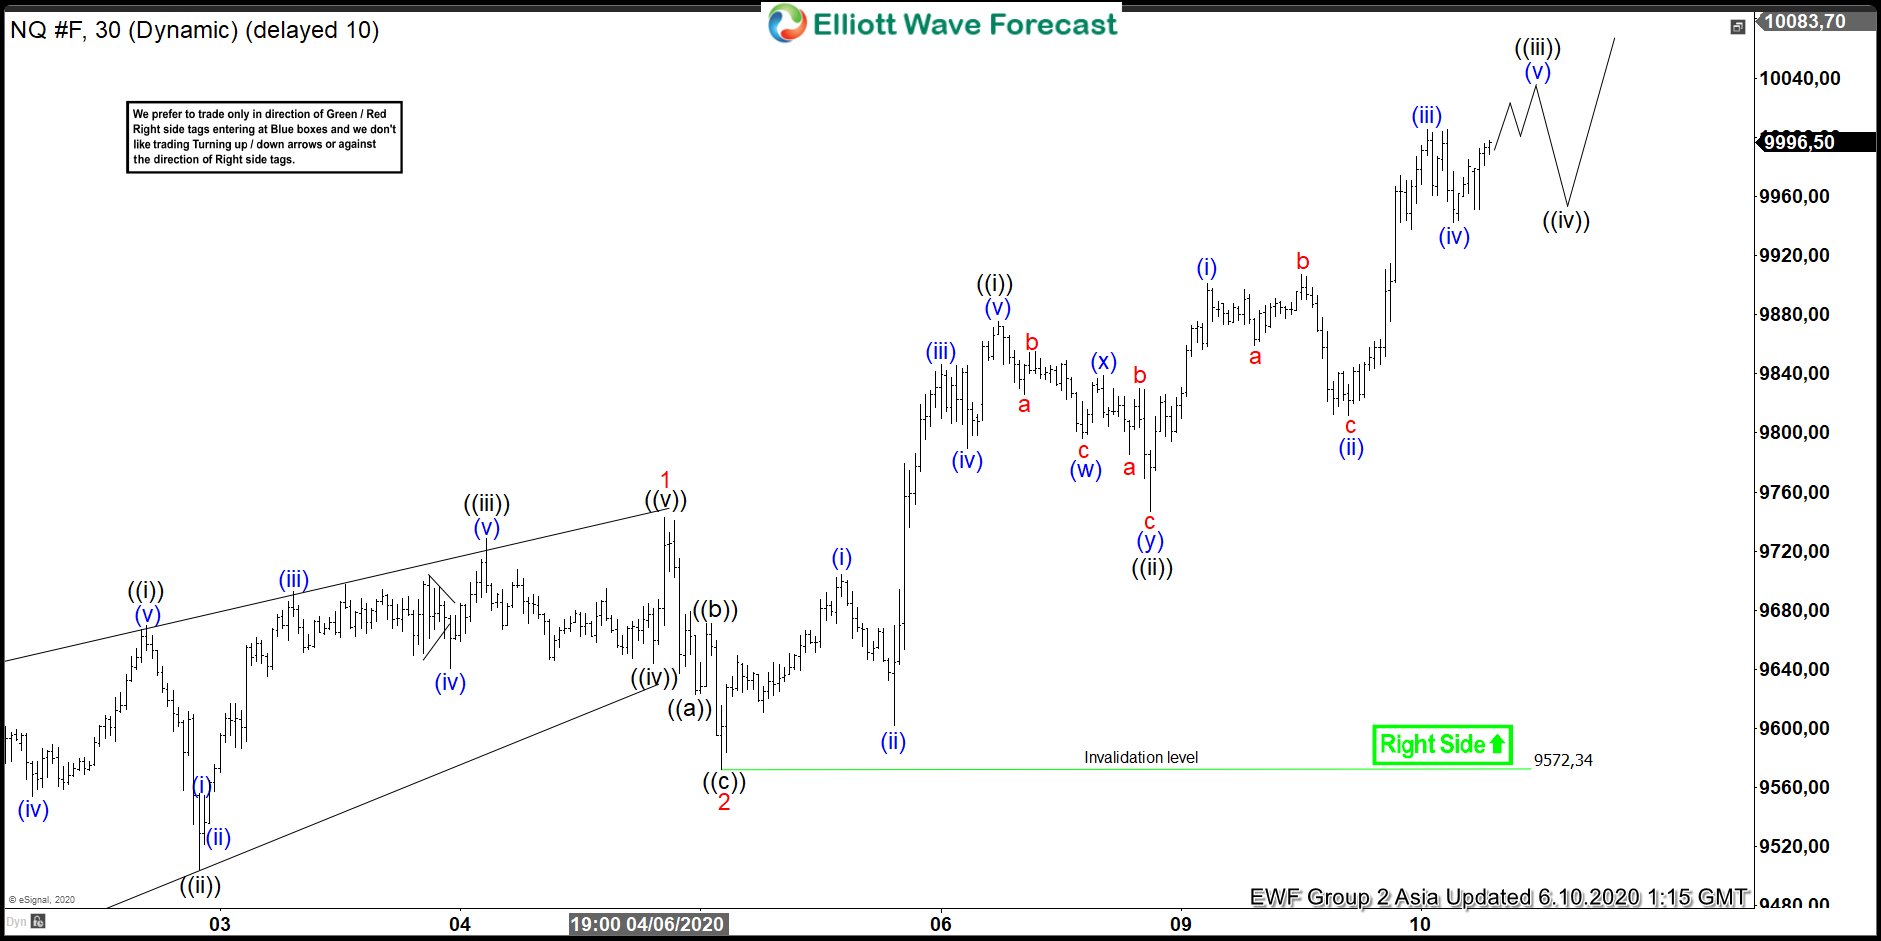
Elliott Wave View: Nasdaq Broke to All-Time High
Read MoreNasdaq (NQ_F) broke to new all time high and structure is showing incomplete impulse. This video and article look at the Elliott Wave path.