

The Power of 3-7-11 and the Grand Super Cycle: How We Saw the Bullish Turn in April 2025 Back on April 9, 2025, while World Indices were dropping sharply and global sentiment had turned overwhelmingly bearish, we published an article that challenged the fear-driven narrative. We explained why selling was not the right approach and […]
-
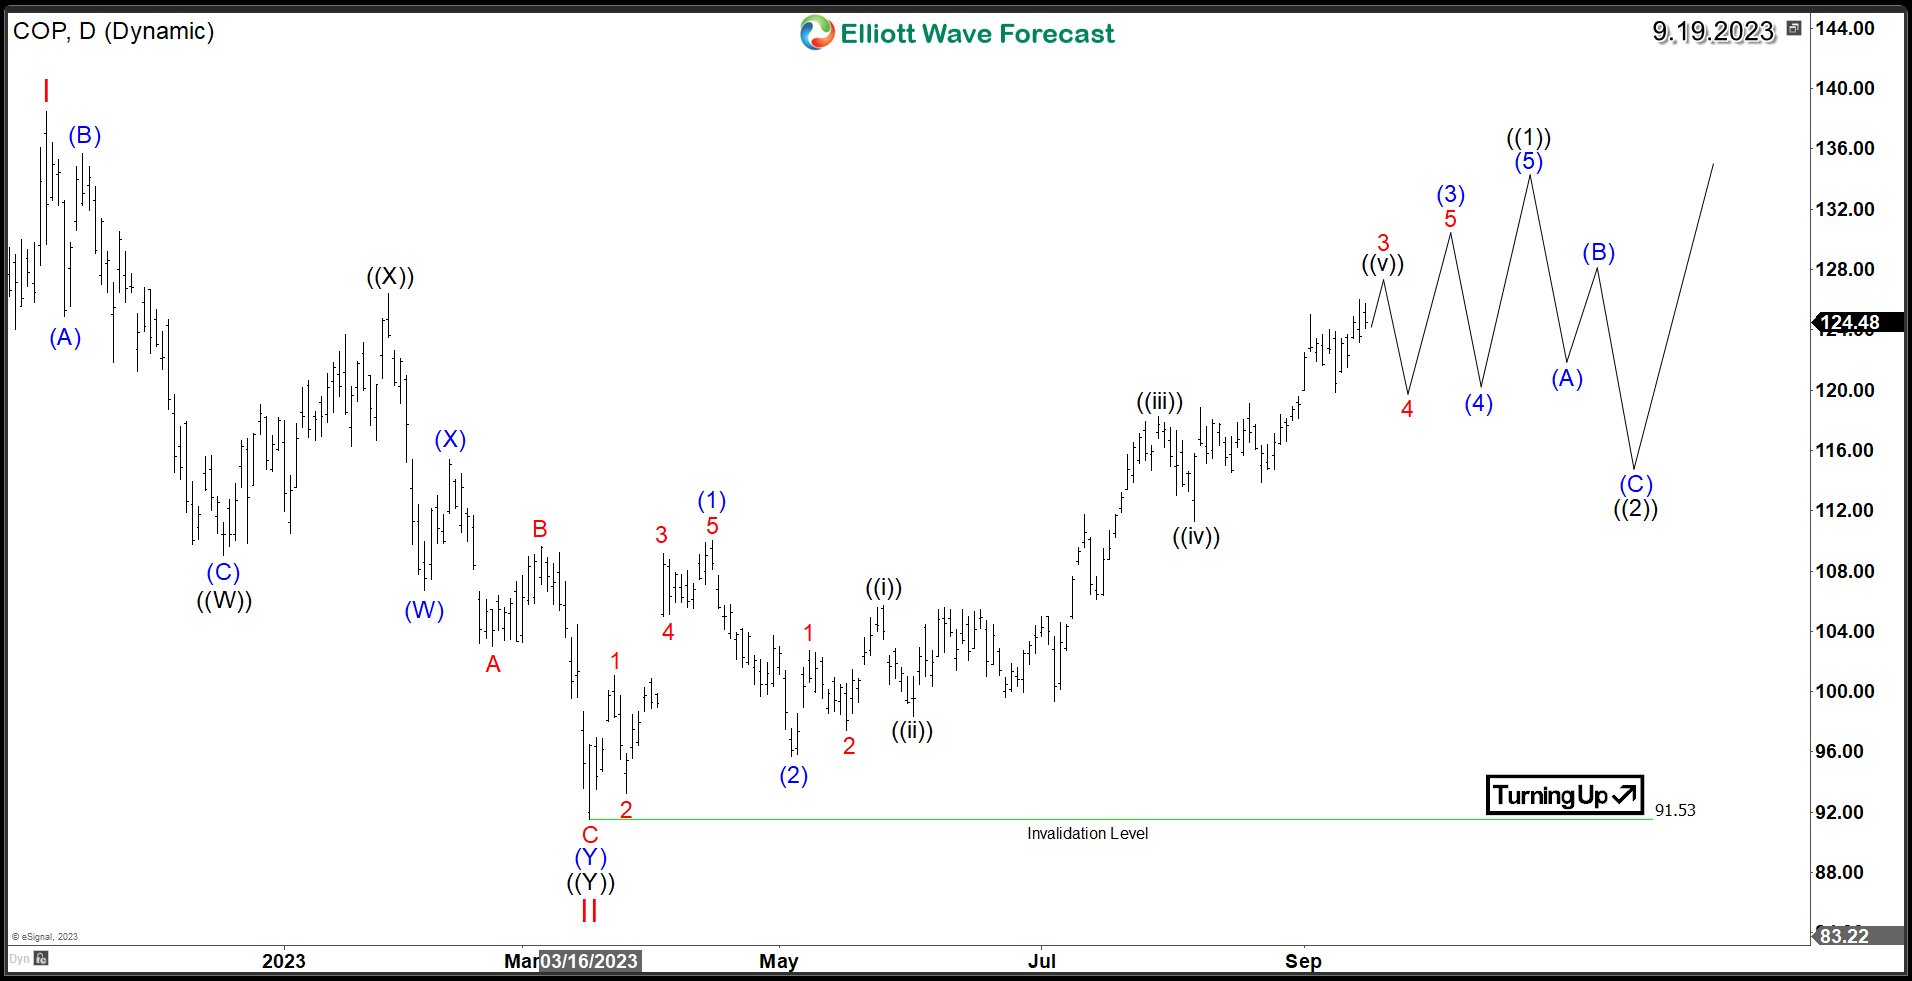
ConocoPhillips (COP) Paving the Path to Further Upside
Read MoreConocoPhillips (NYSE: COP), a prominent name in the realm of energy, has been demonstrating noteworthy strength in its recent market performance. This article delves into the company’s prevailing bullish trends and explores potential pathways for extending its upward trajectory based on the Elliott Wave Theory. The substantial 45% upswing in crude oil prices has significantly […]
-
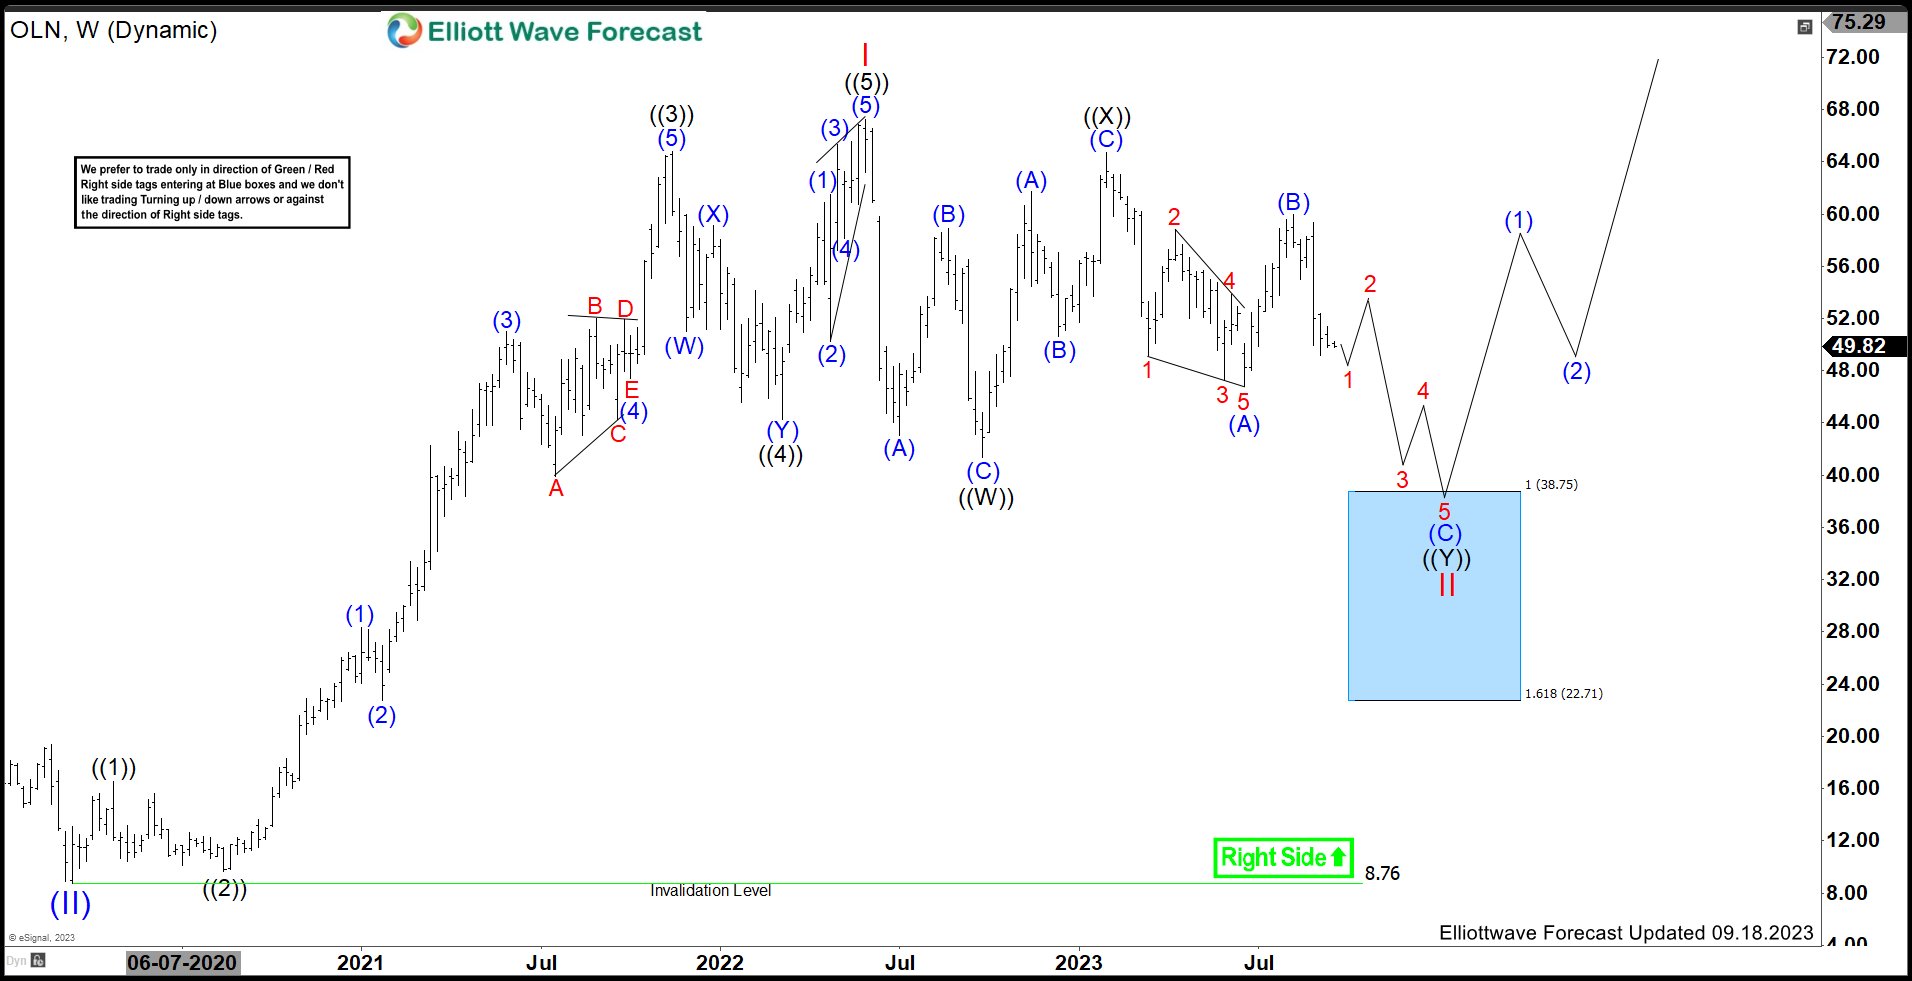
Olin Corporation (OLN) Should Continue Pullback Before Rally Resumes
Read MoreOlin Corporation (OLN) manufactures & distributes chemical products in the US, Europe, Asia Pacific, Latin America & Canada. It operates through three segments: Chlor Alkali products & Vinyals, Epoxy & Winchester. It is based in Clayton, Missouri, comes under Basic Materials sector & trades as “OLN” ticker at NYSE. OLN made all time high at […]
-
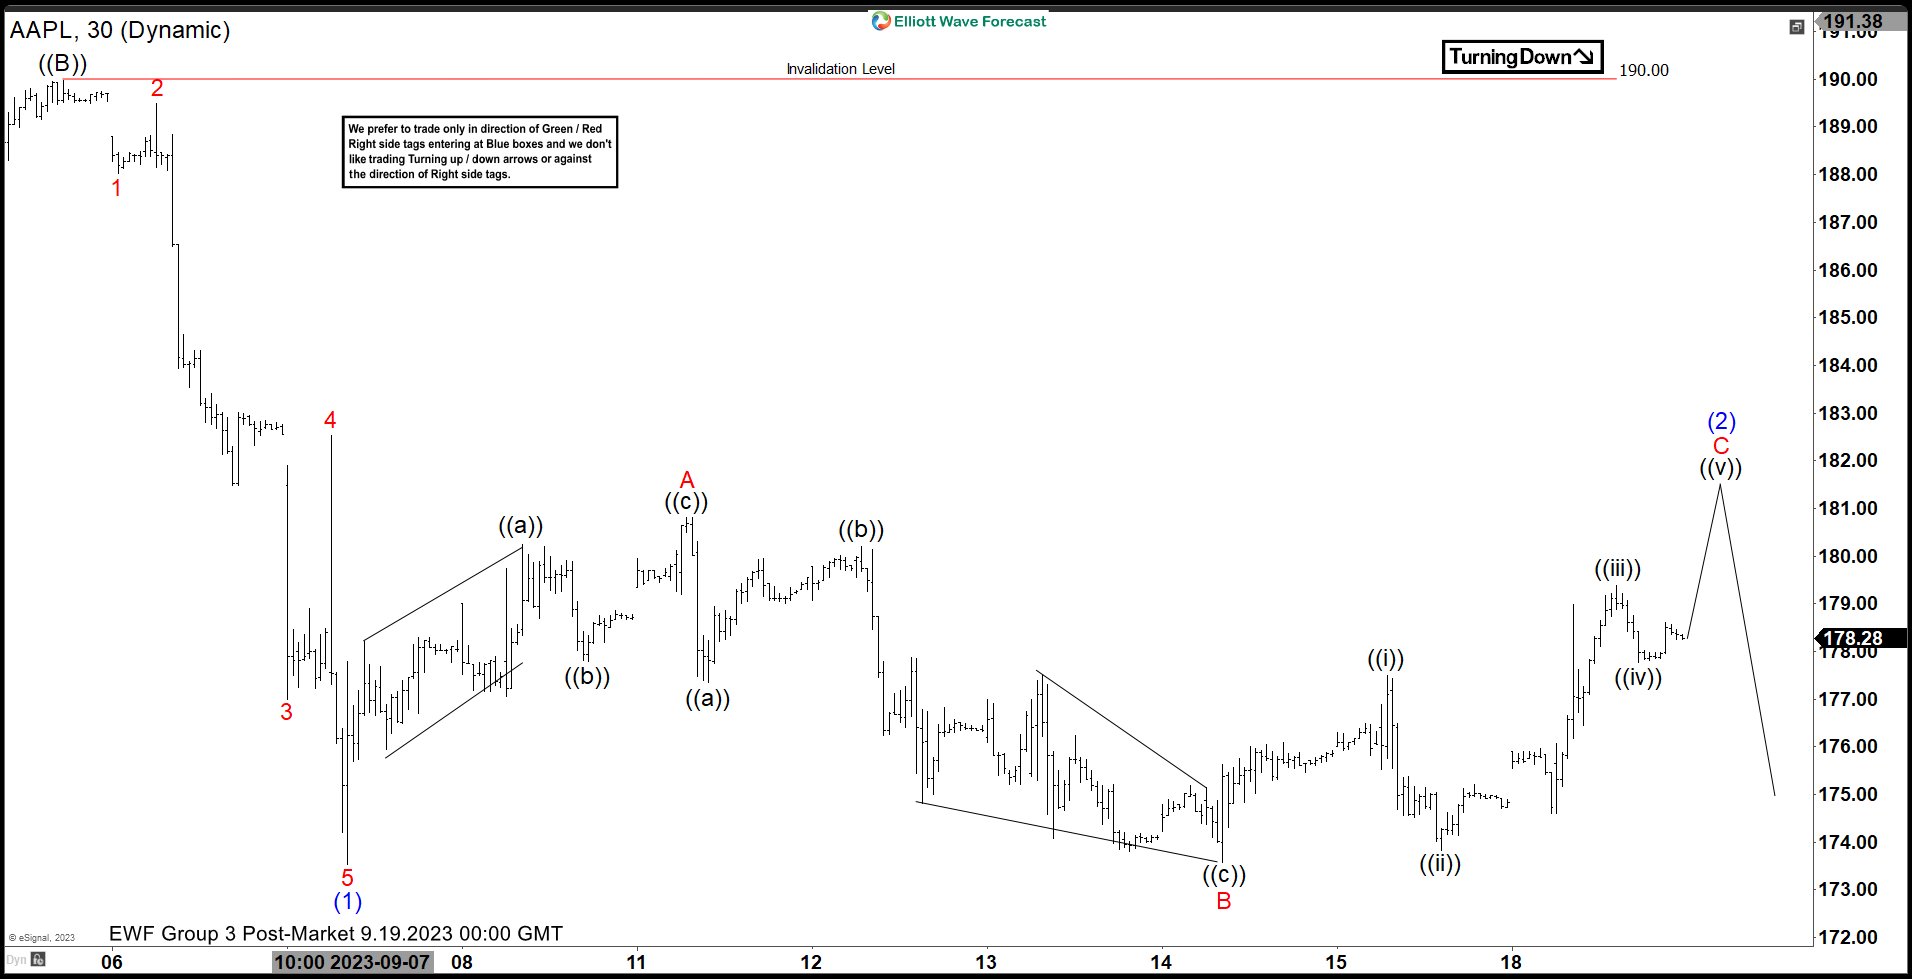
Apple (AAPL) Rally Should Fail for More Downside
Read MoreApple (AAPL) is doing a zigzag correction and near term rally should fail for more downside. This article and video look at the Elliottwave path.
-
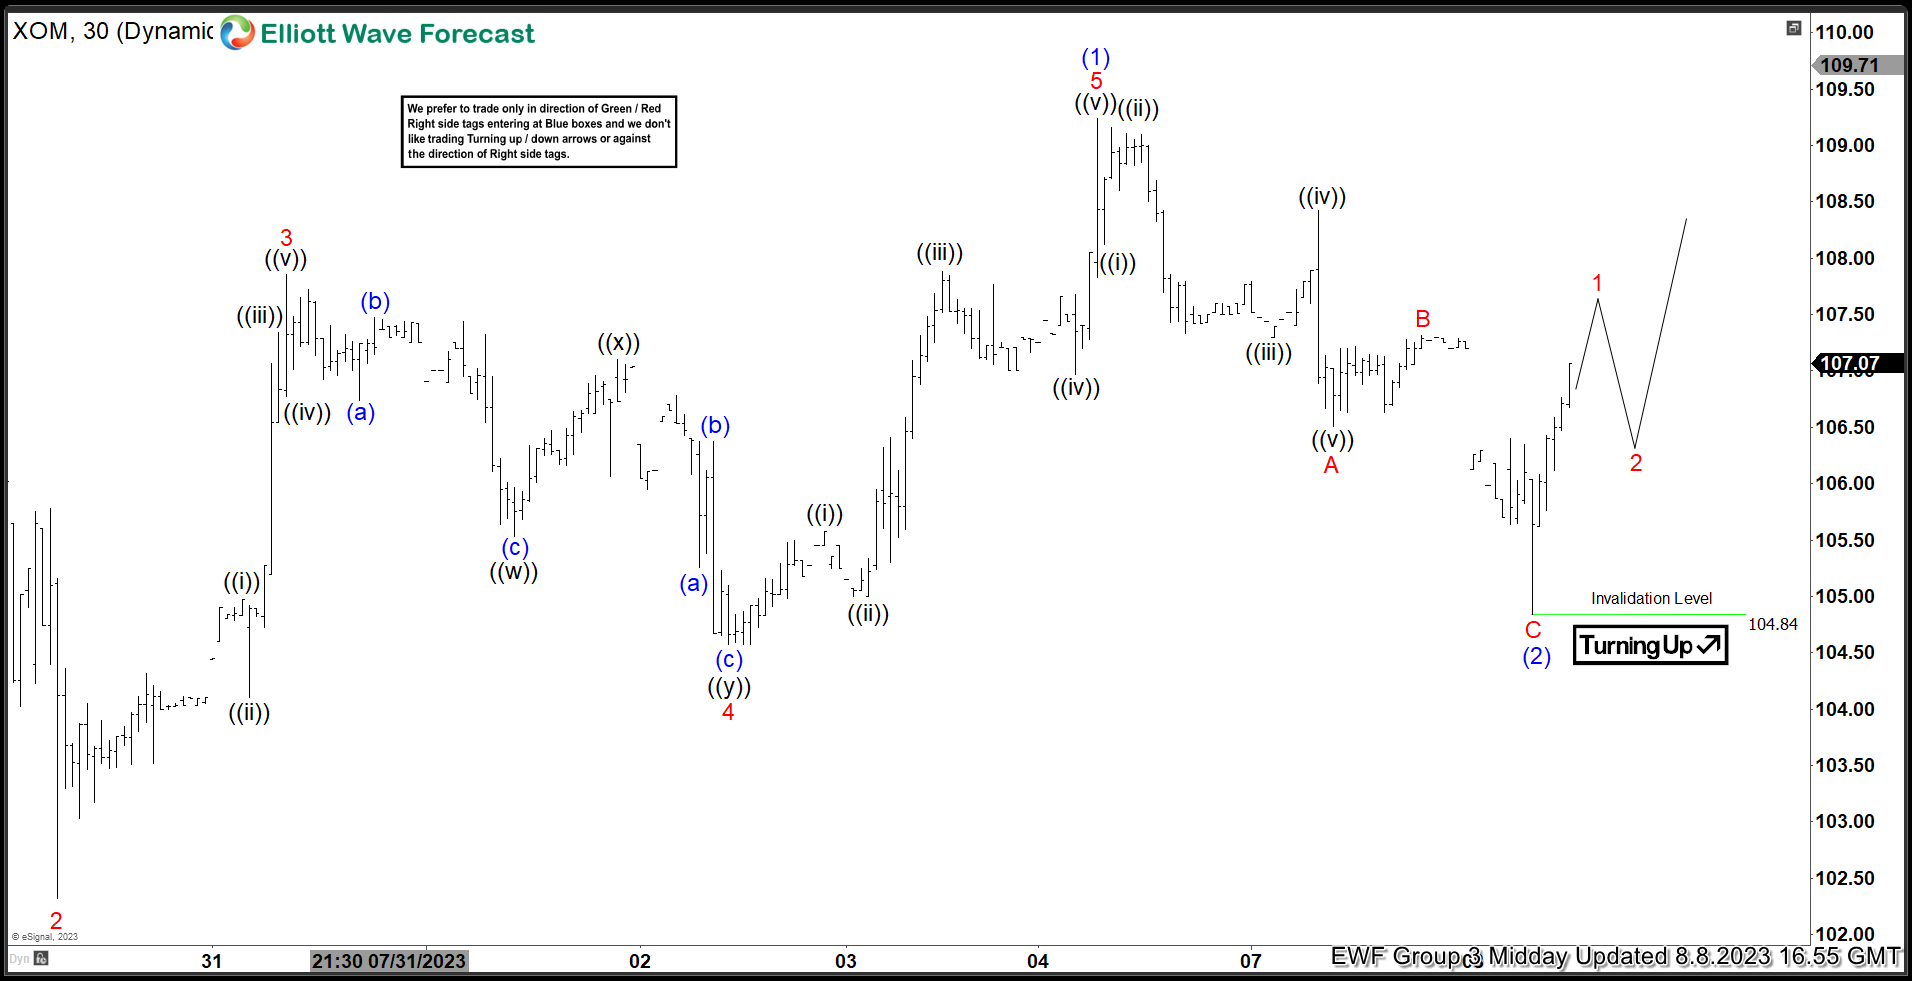
Exxon Mobil Corp ($XOM) Found Buyers After a Corrective Pull Back.
Read MoreHello everyone. In today’s article, we will look at the past performance of the 1 Hour Elliott Wave chart of Exxon Mobil Corp ($XOM). The rally from 7.17.2022 low unfolded as a 5 wave impulse. So, we expected the pullback to unfold in 3 swings and find buyers again. We will explain the structure & […]
-
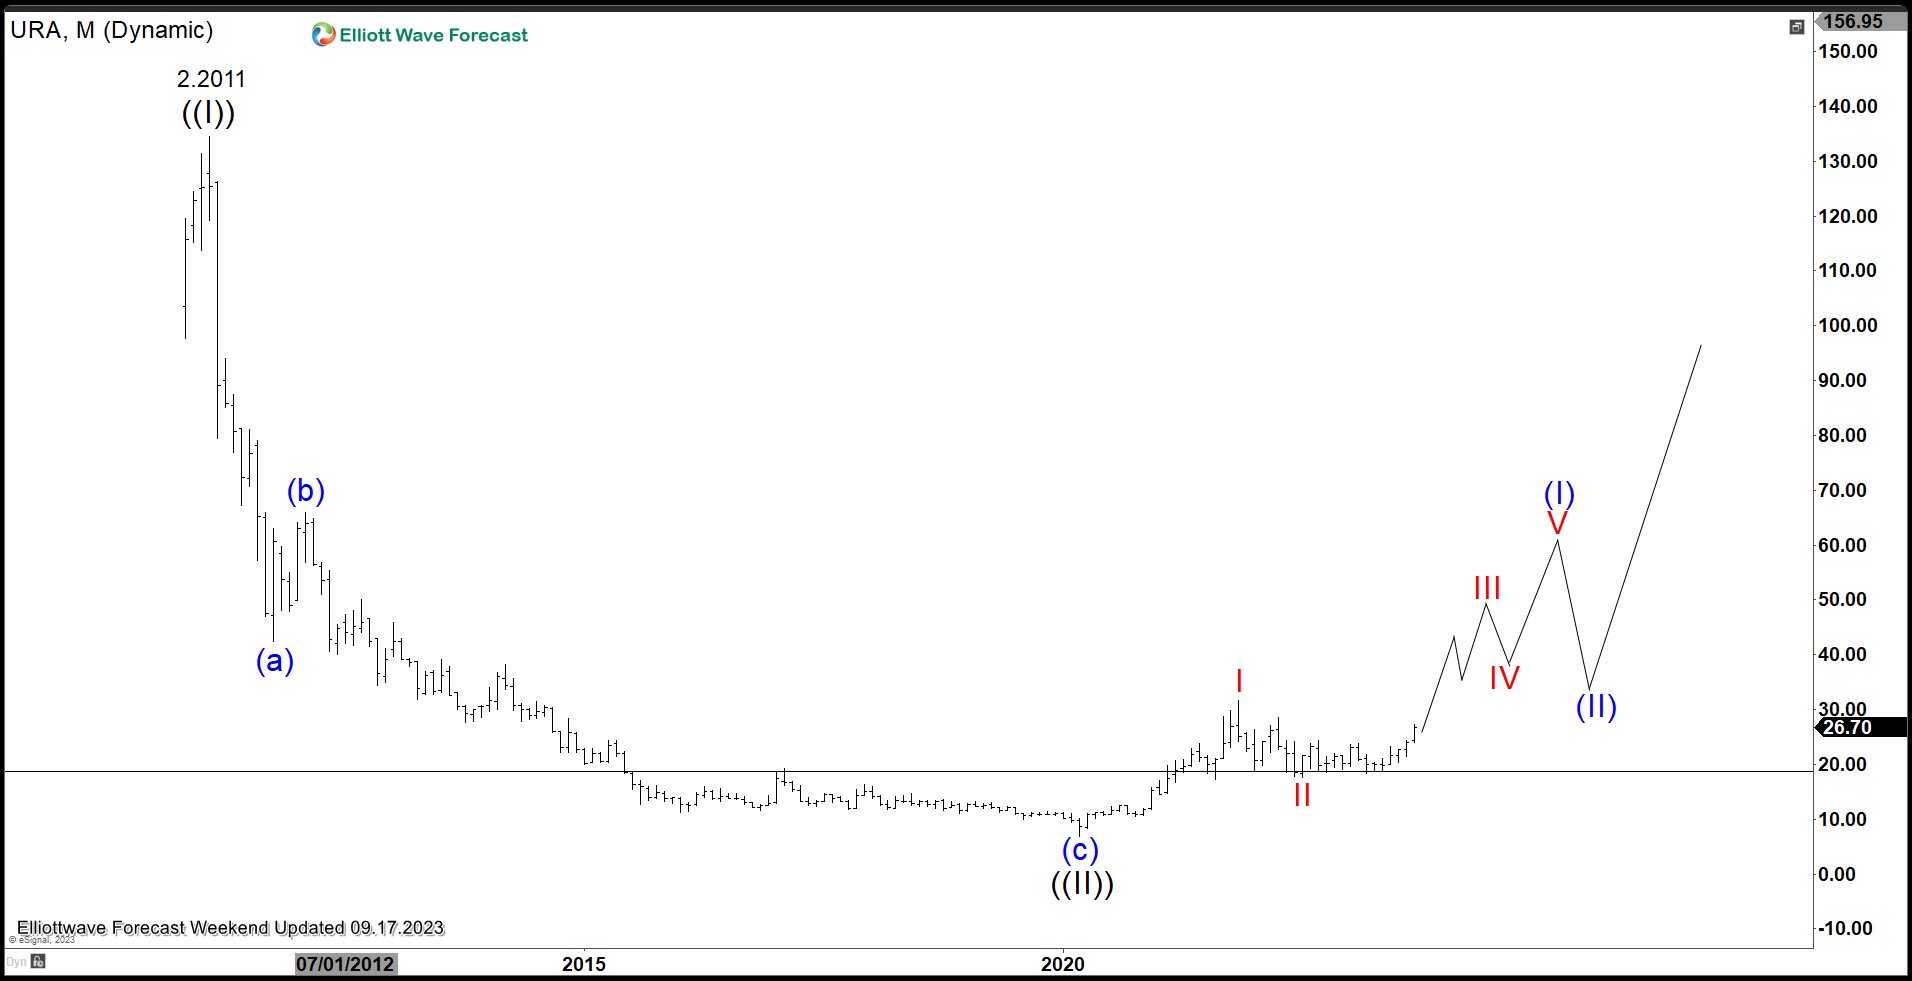
Uranium Miners ETF ($URA) Has Started Next Bullish Cycle
Read MoreThe Global X Uranium ETF ($URA) is an exchange-traded fund (ETF) that seeks to provide investment results that correspond generally to the price and yield performance of the Solactive Global Uranium & Nuclear Components Total Return Index. In this article, we will look at the long term technical outlook using Elliott Wave method. $URA Elliott […]
-
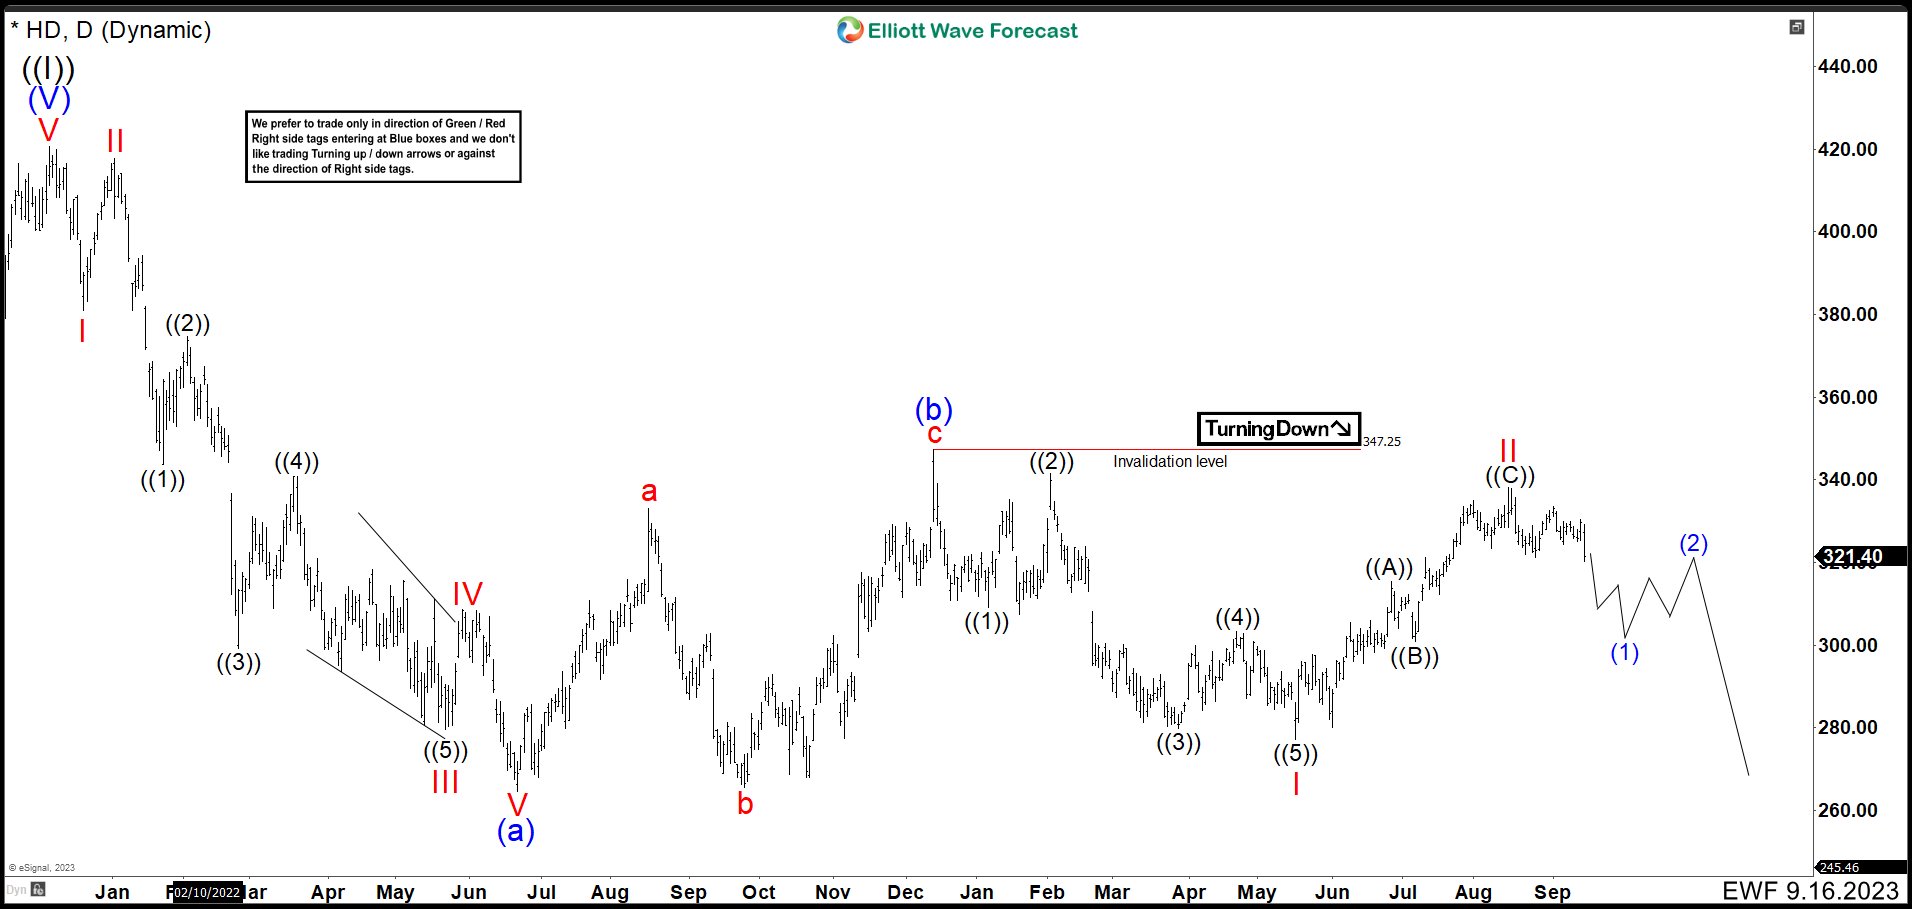
Elliott Wave Shows Home Depot (HD) Crash Is Still On The Cards
Read MoreHome Depot (HD), is an American multinational home improvement retail corporation that sells tools, construction products, appliances, and services, including fuel and transportation rentals. Home Depot is the largest home improvement retailer in the United States. After reaching all-time highs in December 2021, the price of HD fell considerably. According to the Elliott Wave Principle, […]