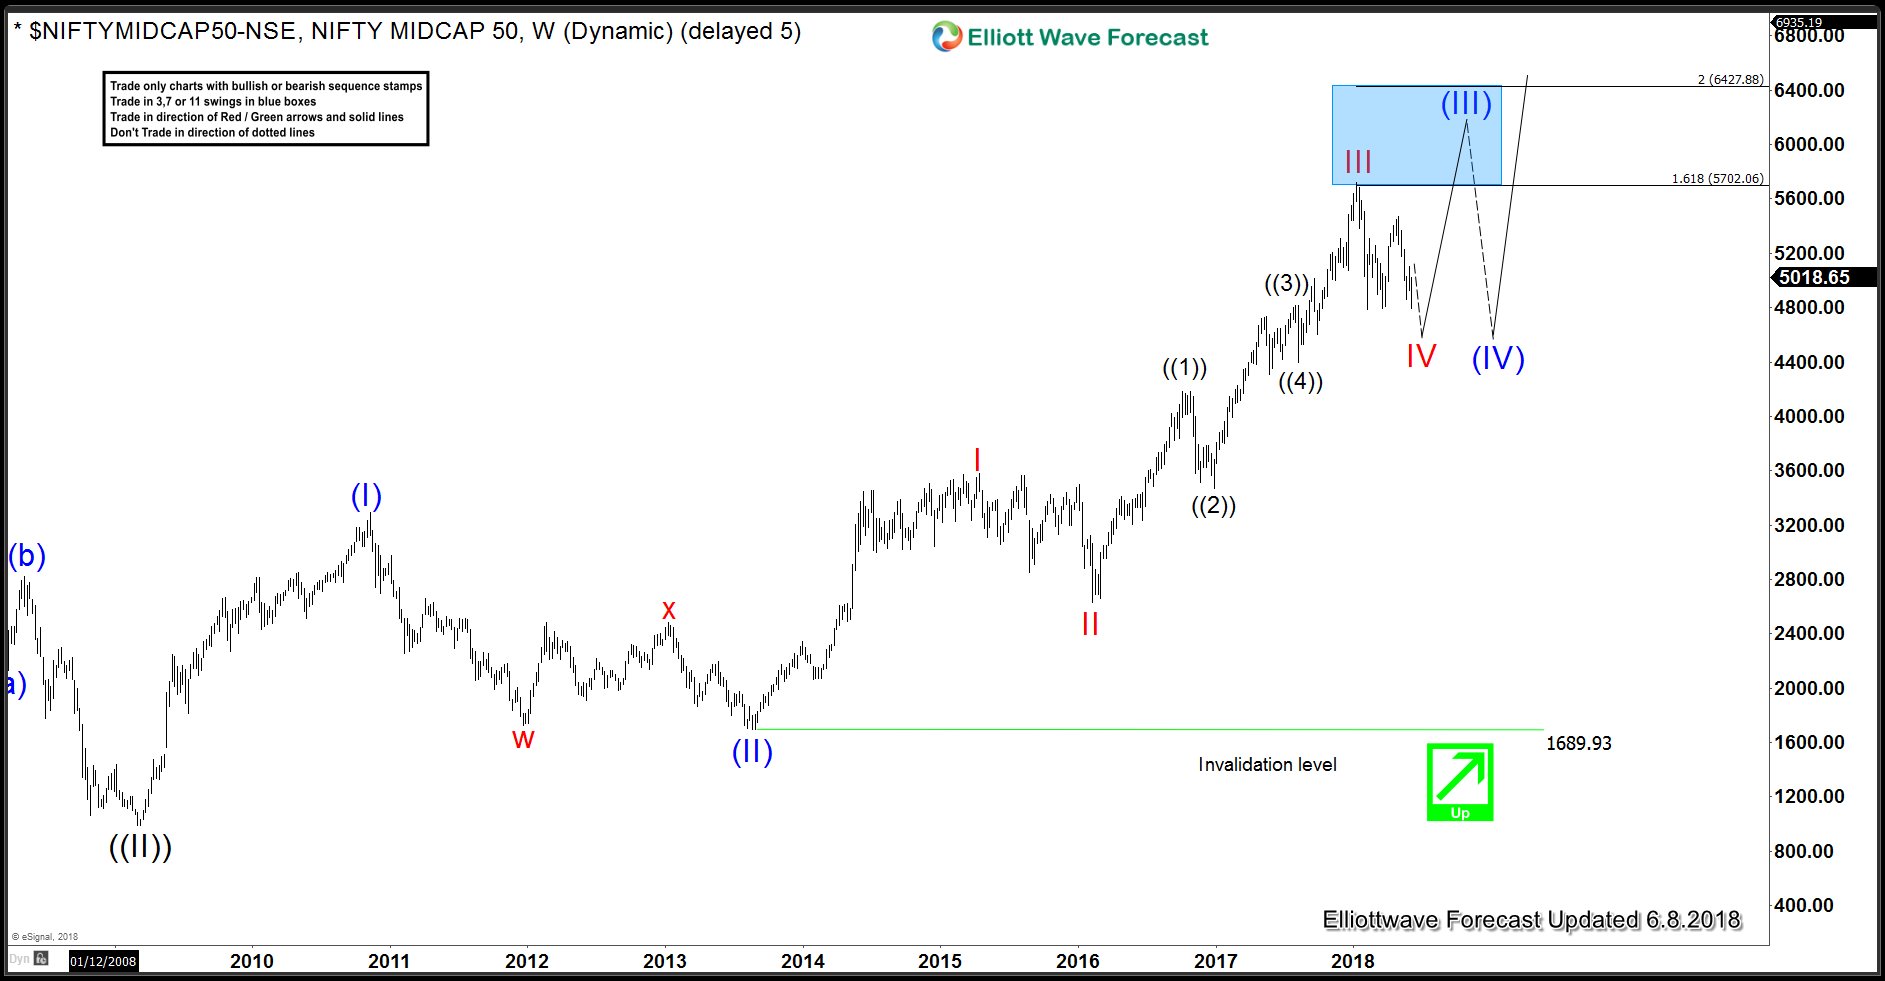
Nifty MIDCAP super cycle from 2009 low remains in progress as an impulse and we believe the Index is still within the powerful wave (III). Rally from March 2009 low to November 2010 was wave (I), dip to August 2013 low completed wave (II). Up from there rally to April 2015 peak (3581) completed wave I of (III), dip to February 2016 low (2633) completed wave II and we can see that rally from there was an extended wave III in which wave ((1)) of III ended in October 2016 (4183), wave ((2)) of III completed in December 2016 (3471), wave ((3)) of III completed in July 2017 (4816), wave ((4)) of III completed in August 2017 (4399) and rally in to January 2018 peak (5722) completed wave III. Index is now in wave IV pull back to correct the cycle from February 2016 (2633) low as the chart below shows
NIFTY MIDCAP Index Weekly Elliott Wave Analysis
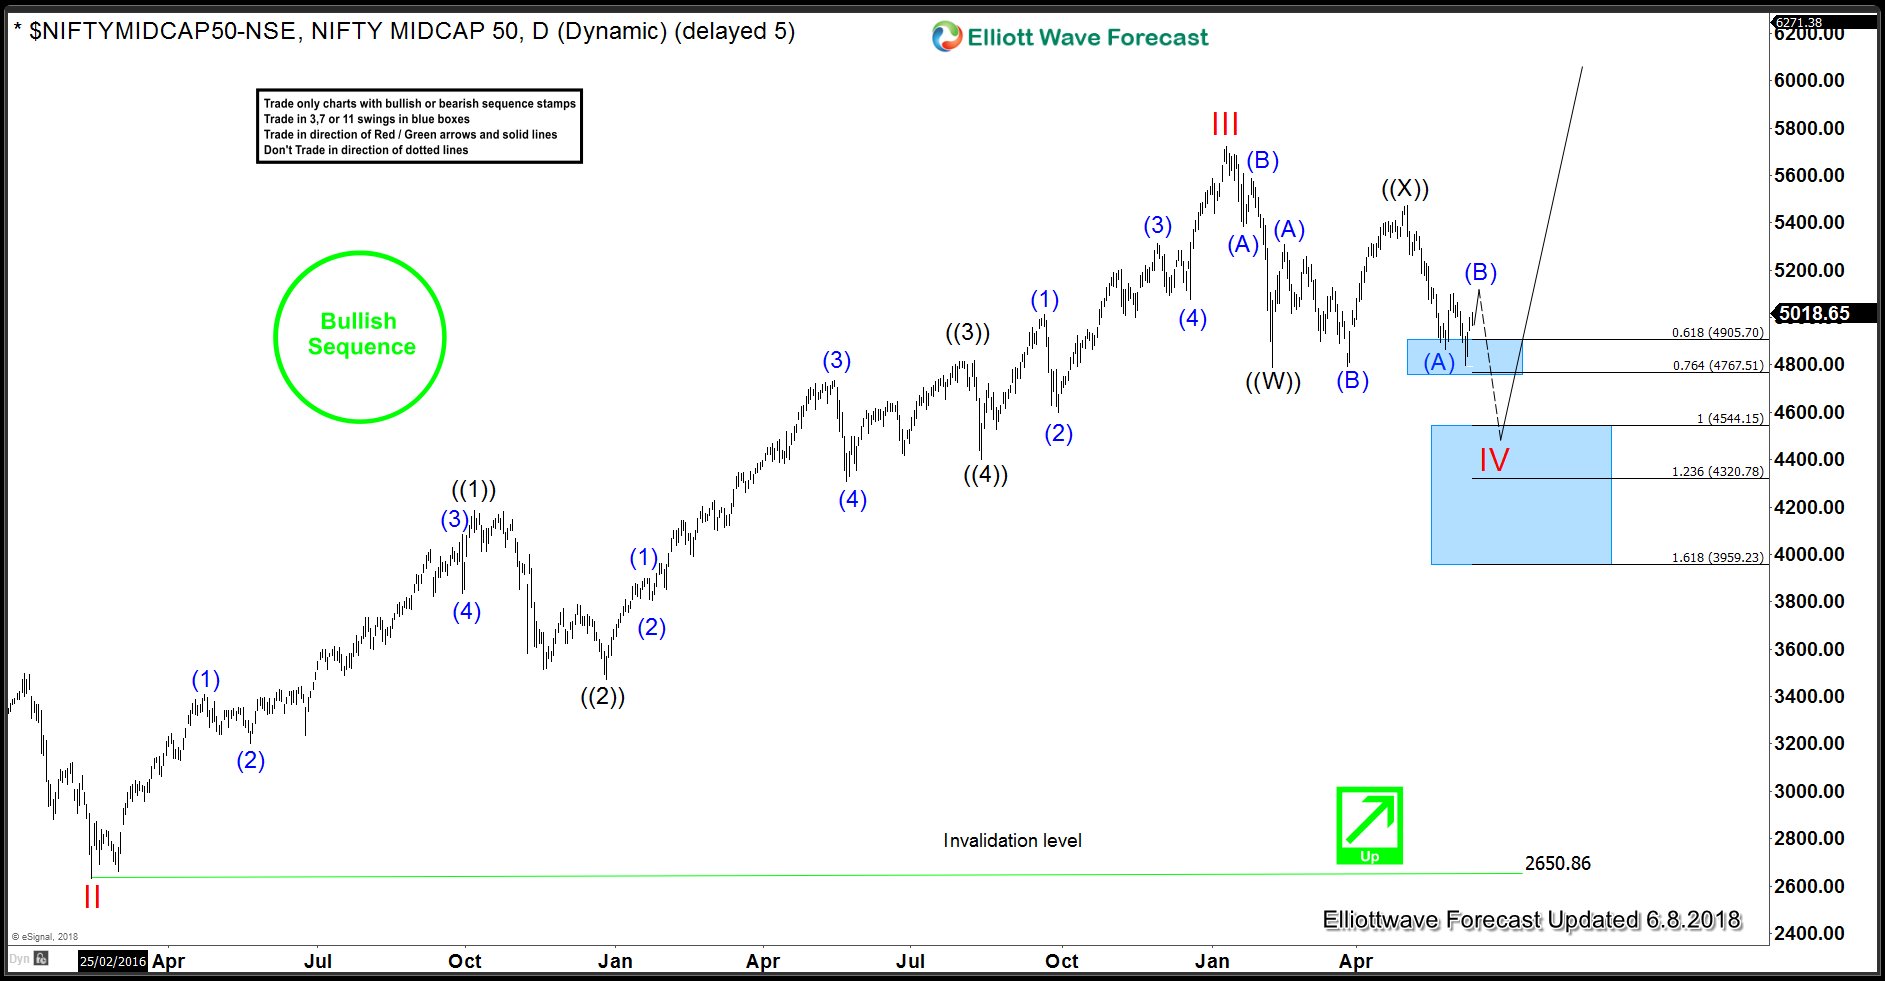
NIFTY MIDCAP Daily Elliott Wave Analysis
Daily chart of Nifty MIDCADP Index shows wave IV pull back has the potential to take the form of a double three ((W))-((X))-((Y)) Elliott wave structure . Decline from wave III peak (5722) to 4787 was in 3 waves and has been labelled as wave ((W)), this was followed by a FLAT to 5474 that we have labelled as wave ((X)). As bounces fail below this level, Index has scope to make another push lower towards 4544.15 – 4320.78 area to complete wave IV and then resume the rally in wave V. We don’t like selling the Index and expect buyers to appear in 4544.15 – 4320.78 area if reached for new highs in wave V of (III) towards 6400 – 6427 area or a larger 3 waves bounce at least. Failure to make new lows and a break above 5474 would be an indication that wave IV ended already at 4787 and wave V higher is in progress as an Ending Diagonal structure.
Back


