We provide round the clock coverage of many World Indices including US, European, UK, Australian and Asian Indices. Today, we will be taking a look at the long-term view of Nifty-NSE Index from India. The NIFTY 50 index National Stock Exchange of India’s benchmark broad based stock market index for the Indian equity market. Full form of NIFTY is National Stock Exchange Fifty. It represents the weighted average of 50 Indian company stocks in 13 sectors and is one of the two main stock indices used in India, the other being the BSE Sensex. The Nifty 50 was launched 1 April 1996 and we are covering it today as Nifty50 is the world’s most actively trade contract.
The NIFTY 50 covers 13 sectors. It gives weightage of 39.47% to financial services, 15.31% to Energy, 13.01% to IT, 12.38% to Consumer Goods, 6.11 to Automobile and nil to agricultural sector and has a base capital f Rs 2.06 trillion.
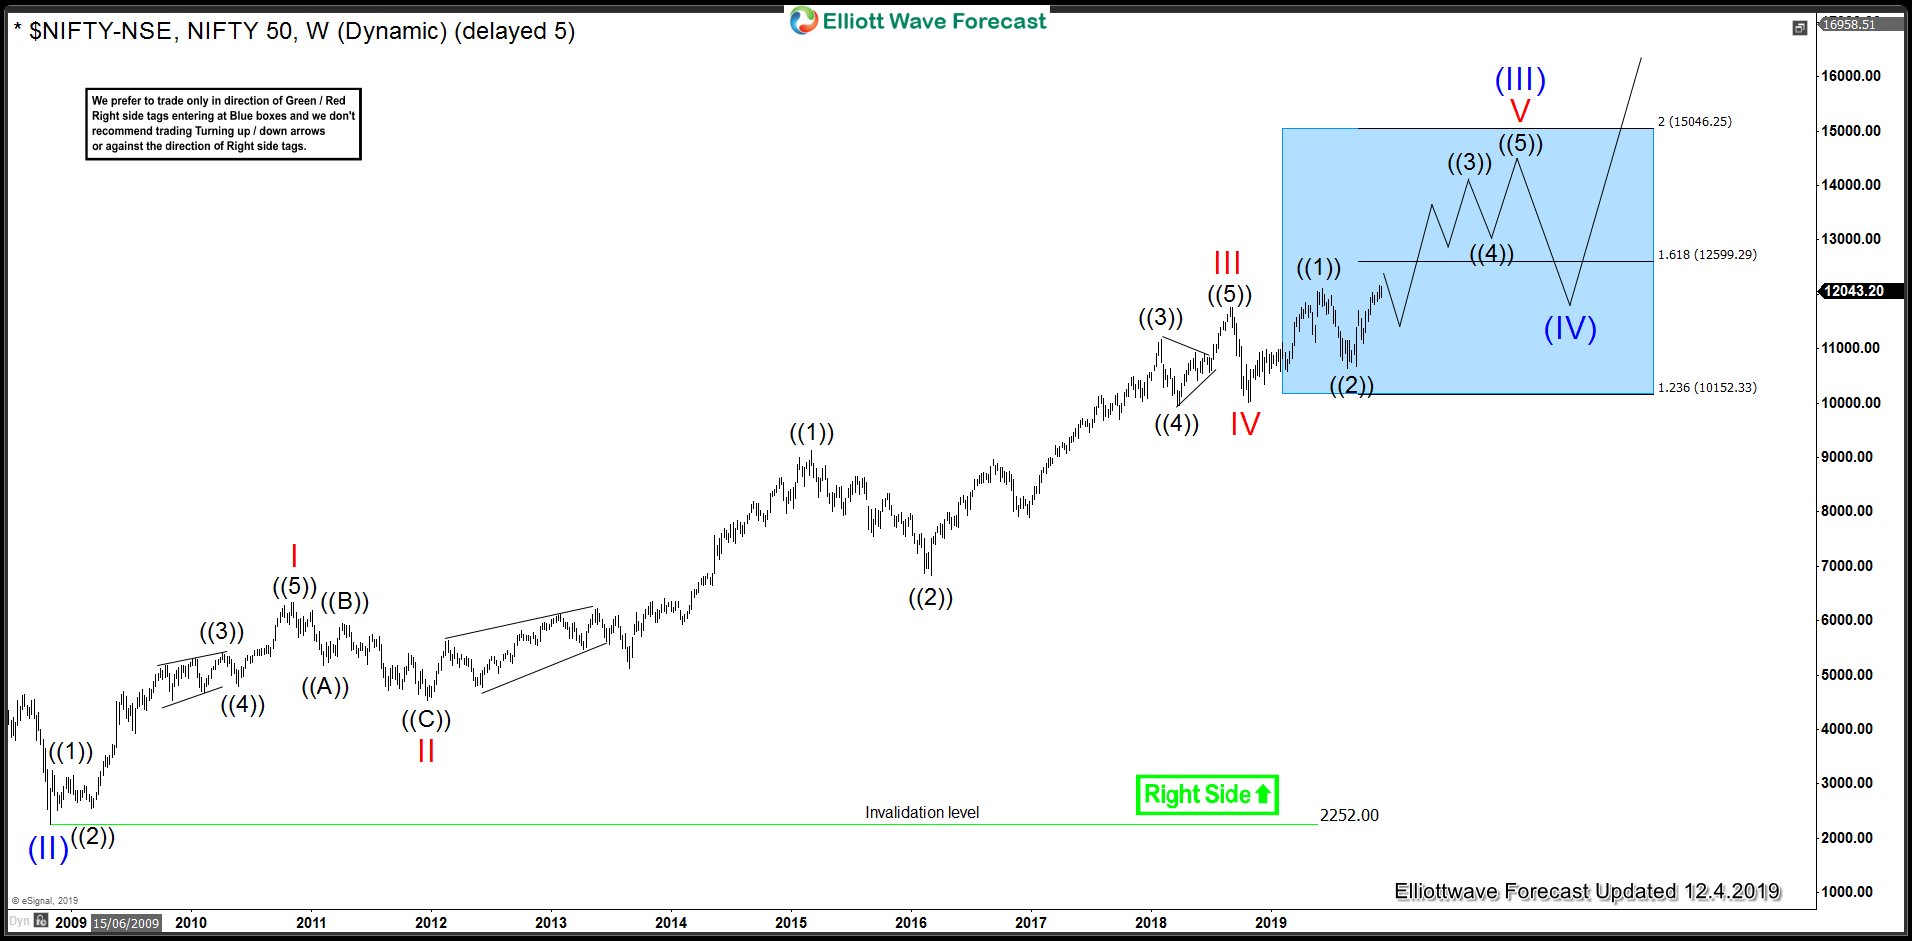
Nifty has been rallying since August 2019 and has already broken above June 2019 peak which creates an incomplete bullish sequence from October 2018 low and hence call for more upside as far as August 2019 low remains in place. Taking a step back, let’s take a look at the weekly chart of Nifty Index and how we are labelling the rally from all time low and since 2008 low.
Nifty-NSE Long-Term Elliott Wave Analysis
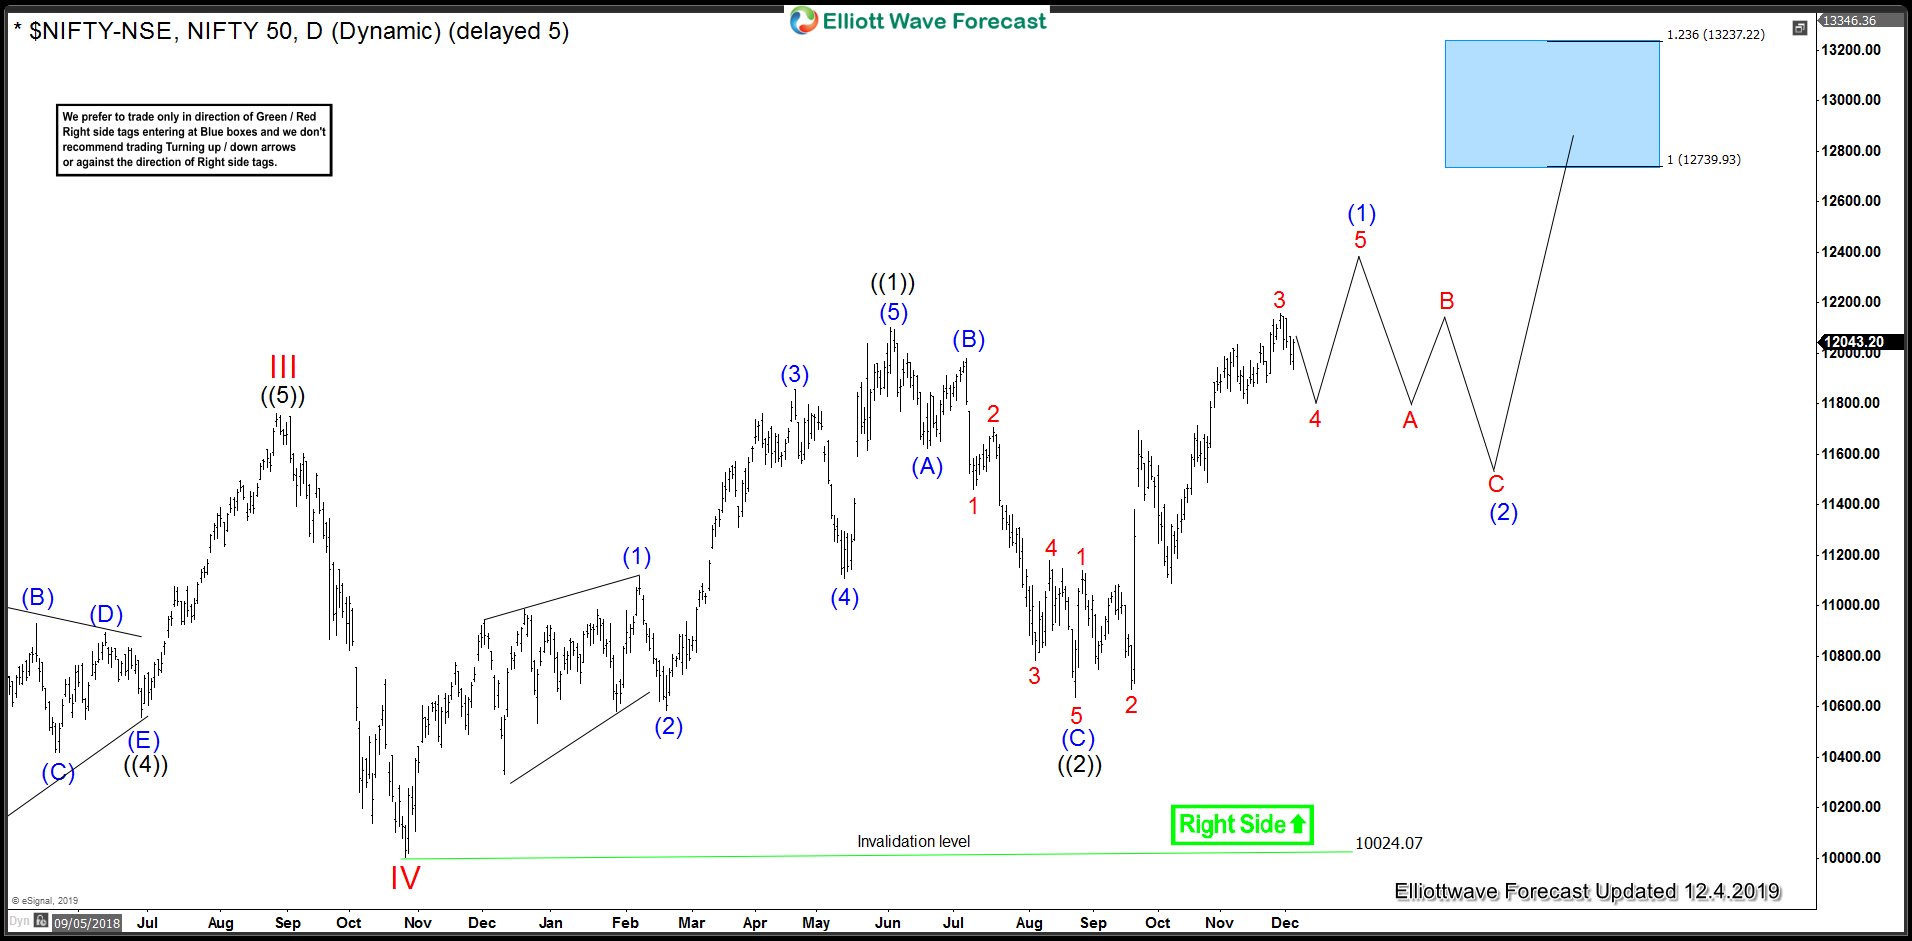
Nifty-NSE Index rally from the all time low is impulsive and Index is reaching 161.8 Fibonacci extension (12599) of the rally from all time low to January 2008 peak projected higher from October 2008 low. 161.8 Fibonacci extension (12599) is the typical extension for wave (III) and this level being reached would confirm this we are indeed in a super cycle wave (III). Up from red IV low (10.26.2018), we can see a bullish incomplete sequence with a target between 12739 – 13237 area. Bear in mind, we could be creating a bullish nest within wave V red or could be ending wave ((3)) already and turn into a diagonal in wave V. Based on broader market correlation, we are favoring the idea of a bullish nest within wave V red and as far as 8.23.2019 low remains in place, we are expecting at least 1 more swing higher or even more upside based on whether wave V ends up being an Ending Diagonal Elliott wave structure or a regular impulse. Once super cycle wave (III) has completed, we would expect a larger wave (IV) pull back to correct the cycle from October 2008 low before Index turns higher in super cycle wave (V).
Nifty Daily Chart Elliott Wave Chart
Below is a 480 minute Elliott wave chart of Nifty-NSE Index and we can see Index has already broken above 6.3.2019 peak which creates an incomplete bullish sequence from 10.26.2018 low. This means as far as dips hold above 8.23.2019 low, we should see more upside in the Index at least towards 12739 – 13237 area. We don’t like selling the Index and expect dips to remain supported in the sequence of 3, 7 or 11 swings as far as pivot at 8.23.2019 low remains intact.
Back


