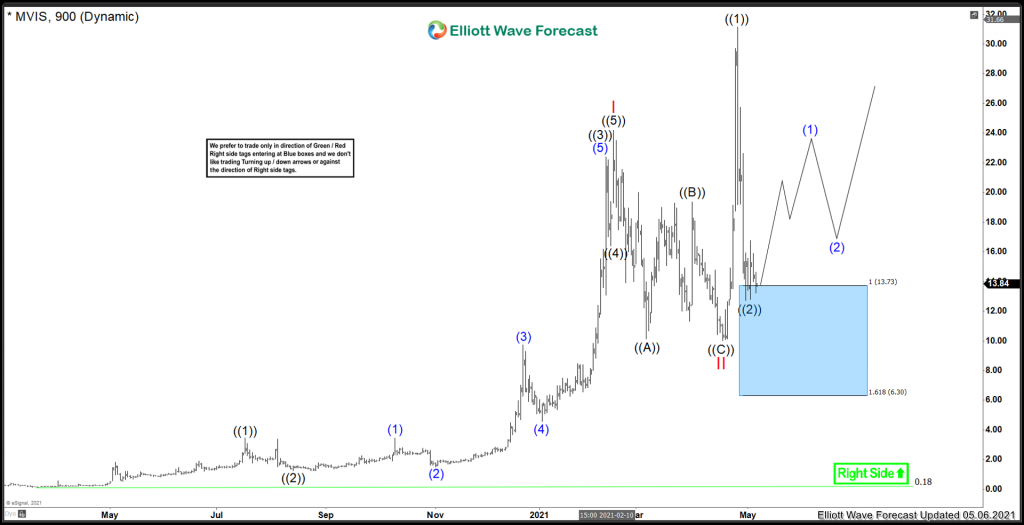
Microvision was a little well known company during the March 2020 correction. It set an all time low at 18 cents at the time. From that low, it has exploded to as high as $31.14 recently due to its technology possibly being utilized in the auto industry among other sectors. Lets take a look at what they do as a company:
MicroVision, Inc. is an American company that develops laser scanning technology for projection, 3D sensing, and image capture. MicroVision’s display technology uses a micro-electrical mechanical systems (MEMS) scanning mirror with red, green, blue, and infrared lasers, optics and electronics to project and/or capture images. The company licenses its products primarily to original equipment manufacturers (OEMs) such as STMicroelectronics.
The MEMS scanning micro-mirror is the basis of MicroVision’s technology platform. The MEMS design consists of a silicon device with a millimeter-scale mirror at the center. The mirror is connected to flexures that allow it to swing vertically and horizontally to display (or capture) an image.
In projection-mode the MEMS laser beam scanning display method can be compared to raster scanning in a cathode ray tube (CRT) display. Product applications include mobile projection virtual retinal display, head-mounted display, and automotive head-up display. The technology has also been used in a smartphone by the manufacturer Blackview.”
So why the huge 17,700% rally? Their LiDAR Technology is being adapted for use in auto sector, mapping and photography which is projected to be a 2.9 Billion Dollar industry by 2027. Recently, buy out rumors have also caused a stir. But, lets take a look and see what the chart says about this company!
Microvision Elliotwave View:
Medium term term view from the all time low in March 2020. This stock took its time for the momentum to kick in. The stock chopped around sideways to higher in a nesting structure setting a low in November 2020. From that time, the rally really took hold.
Within the timespan of 3 months, the stock rallied from (2) low of 1.52 to a peak of 24.18. After that, a correction took place in Red II which struck a low on April 19th at 10.01. From there, another sharp rally took place which set a new high at 31.14. Prices are now pulling back from that peak and have pulled back into the blue box extreme area where a bounce can take place.
In Conclusion, as long as Red II low holds, further upside extension is favoured to take place.
Risk Management
Using proper risk management is absolutely essential when trading or investing in a volatile stocks. Elliott Wave counts can evolve quickly, be sure to have your stops in and define your risk when trading.
Improve your trading success and master Elliott Wave like a pro with our 14 day trial today. Get Elliott Wave Analysis on over 70 instruments including GOOGL, TSLA, AAPL, FB, MSFT, GDX and many many more.
Back

