Intel Corporation ( also known as Intel ) is one of the world’s largest and highest valued semiconductor chip makers around the world and is the inventor of the x86 series of microprocessors, the processors found in most personal computers .
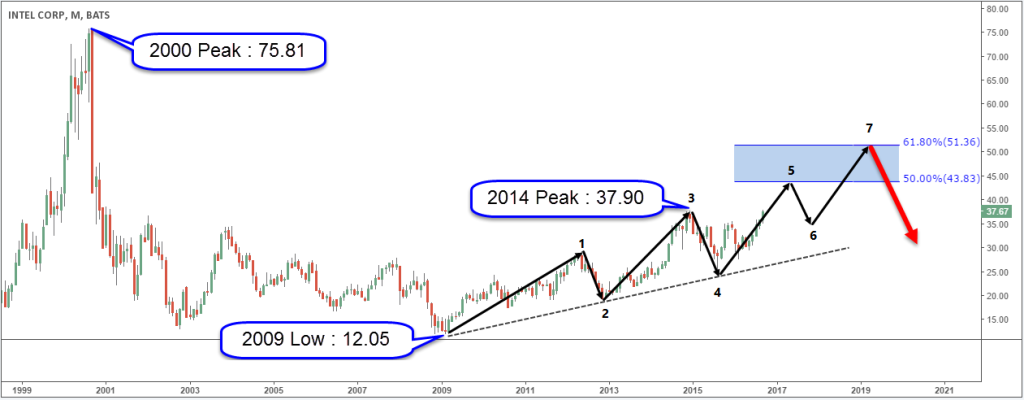
Intel stock is traded in The NASDAQ Stock Market which was hit hard in the 2000 dot-com bubble crash , after that INTC kept going lower as the Corporation struggled in front of its major competitors like AMD , Nvidia , Samsung , Toshiba ect … However after the 2008 financial crash INTC found a bottom in 2009 at 12.05 and started correcting the cycle from the 2000 peak , since then the stock did 3 waves bounce to the upside reaching 37.9 in late 2014 before pulling back in 3 swings and holding the 2009 trend-line to start rallying again.
Last Friday (09/16/2016) INTC broke above the 2014 high making the sequence incomplete with 5 swings ( it’s different from 5 waves rule used in Elliott Wave theory ) and calling for more upside to reach at least 50%-61.8% Fib retracement ( 43.83 – 51.36 ) , many of the Nasdaq components already retesting / breaking the 2000 high while Intel slow growth kept it around the 38.2% Fib retracement !! So the upside for INTC looks to be limited as it will be ending 5 or 7 swings around the inflection area shown on the chart and then it should make another 3 waves pull back at least.
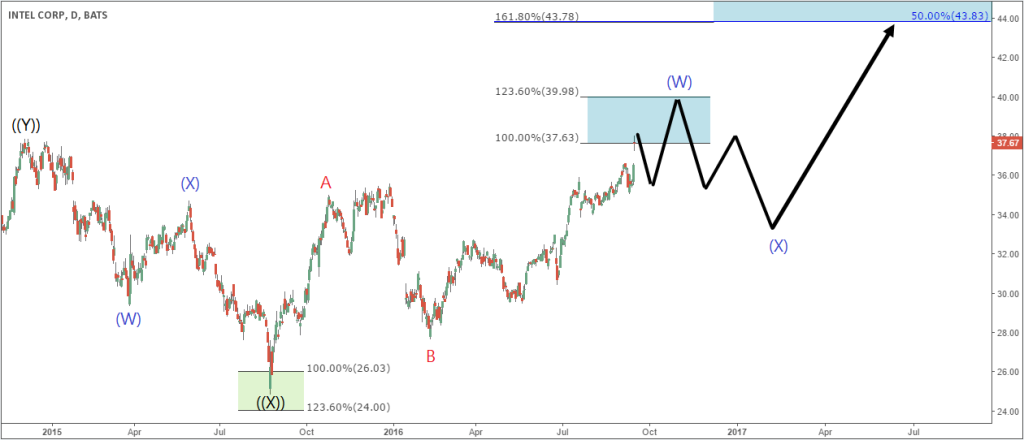
Jumping to the daily chart , INTC doing 3 waves from 08/24/2015 reaching equal legs area where it should ideally find seller for a pullback before higher while short term still suggesting that it’s only ending wave ((iii)) of C so there is still possibility for one more leg to end wave (W) around 39 area . The stock should remain supported in 2017 as far as pivot at 24.87 low remains intact suggesting dips in 3 , 7 or 11 swings could be bought for further upside . The surprise could come if it turns out that the stock is doing an irregular flat from 2014 peak so after ending current wave it will drop sharply in 5 waves before resuming higher
For further information on how to find levels to trade forex, indices, and stocks using Elliott Wave and the 3 , 7 or 11 swings technique, try us free for 14 days. You will get access to Professional Elliott Wave analysis in 4 different time frames, Daily Elliott Wave Setup Videos , Live Trading Room and 2 live Analysis Session done by our Expert Analysts every day, 24 hour chat room support, market overview, weekly technical videos and much more so if you are not a member yet, use this opportunity and sign up to get your ( free trial ). If you enjoyed this article, feel free to read other diversified articles at our Technical Blogs and also check Chart of The Day .
Back


