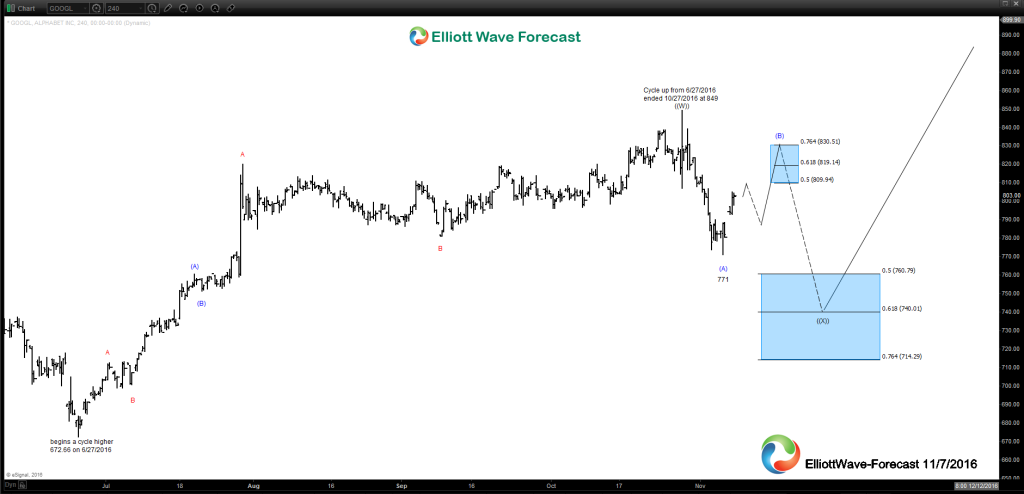
Here is the near term Elliott Wave analysis for the Nasdaq stock and company that really needs no introduction, Google based in Mountain View, California, USA. For purposes here in this article I’ll mention this stock is obviously in a larger uptrend since the company inception. This particular labeling of the chart is not to say the larger count is or not impulsive however may be the important thing is the uptrend. We will begin with the low from 6/27/2016 which after doing cycle analysis it appears to have ended that cycle up from there on 10/27/2016 at the 849.00 highs once the dip in the blue degree (A) wave down to 771 had mostly completed. That suggested it would correct that cycle up from the 6/27 lows in 3, 7 or 11 swings before it continued into new high territory again. The nearest term bounce up from the 11/4 wave (A) lows appears to be three swings so far and projects a 1.618 target area at 808 where I’d look for this initial bounce ending near before a pullback lower that should remain above that 771 low from 11/4 for another swing higher in the wave (B). That leg of the bounce should ideally remain below the 10/27 highs for one more leg lower toward the 50%-.618 Fibonacci retracement area to finish three larger swings lower in the correction of the cycle up from the 6/27 lows. For the specific equal legs-1.236 extension area for (C) of ((X)), will be able to get a measurement for that once the wave (B) bounce completes. As per our proprietary trend system once that dip is seen it should tell us if the pullback lower is going to be continuing deeper correcting an even larger cycle (example January lows) after the bounce from the (C) of ((X)) target area or it will resume toward new highs again.
Thanks for looking and coming to the website and if you like take a trial subscription of our service and see if we can be of help in your trading. Kind regards & good luck trading. Lewis Jones of the elliottwave-forecast.com Team
Back
