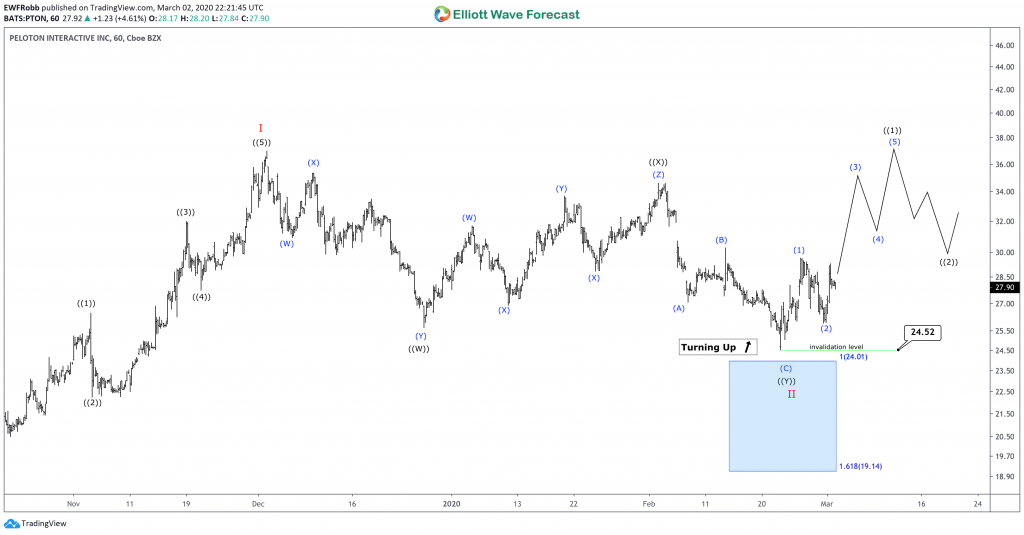
Peloton ($PTON) had a very nice run before topping December 2019, and may be ready for the next leg up. The caveat with analyzing companies that have recently gone public is there is not much history to analyze. However, the structure that Peloton has since hitting the all time lows suggests the next bull run could be in the early stages of development.
Peloton Elliott Wave Overview
Peloton set all time lows on Oct 23/19 at 24.06 and from there developed a bullish sequence. Wave ((1)) topped at 26.50 and ((2)) bottomed at 22.25. From there wave ((3)) topped at 32.01 and (4) bottomed at 27.75. Wave ((5)) of Red I topped at 37.02 on December 2/2019. Peloton then corrected that cycle up in the form a Double Zig Zag where ((W)) bottomed at 25.67 on December 27/19. From there ((X)) topped at 34.60 on Feb 4/20 and ((Y)) of Red II bottomed at 24.52 on February 24/20.
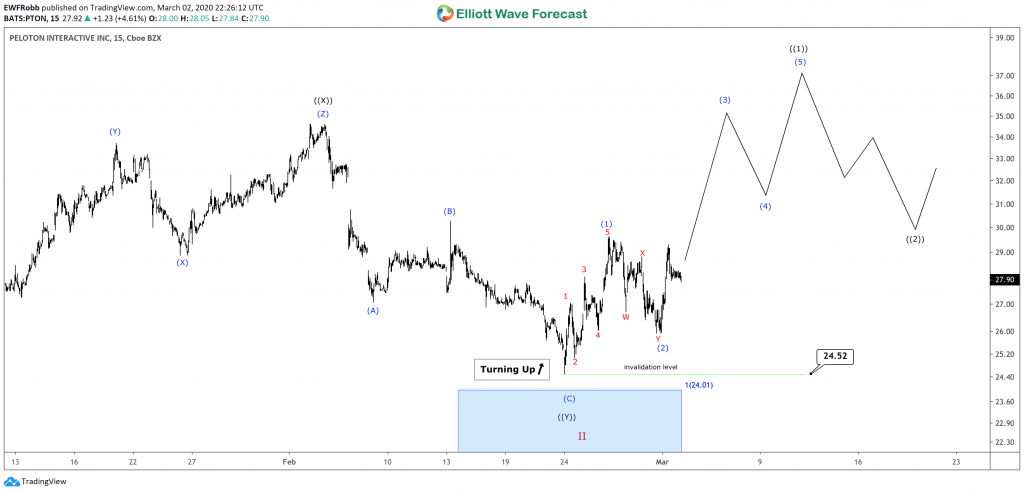
An Equal legs extreme area measured from ((W))-((X)) was not hit unfortunately. Instead buyers came in prior to the extreme area. As long as price action is above the 24.52 lows, the 1h is turning up and dips in 3, 7, and 11 waves should continue to be bought. Should price fall below the recent low of 24.52 then Red II would be seen as extending down and the equal legs blue box should provide an area where buyers can enter.
In the near term, Peloton is working on breaking out into a Blue (3) of ((1)). A 161.8% extension target of 35.00 area where a pullback for wave blue (4) should take place before heading to wave blue (5) of ((1)).
Risk Management
Using proper risk management is absolutely essential when trading or investing in stocks or ETFs. Make sure to have your risk defined before entering into any trades.
Improve your trading success and master Elliott Wave like a pro with our free 14 day trial today.
Back


