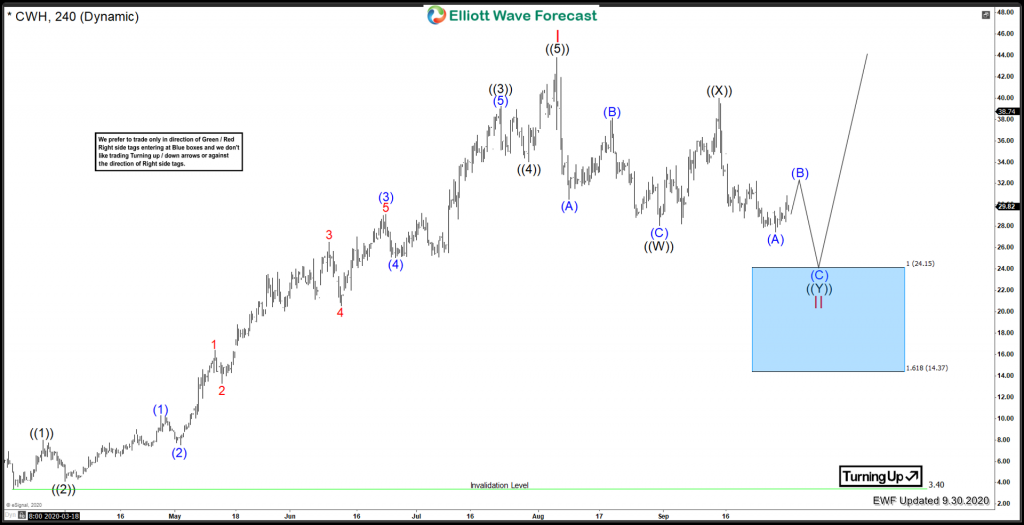
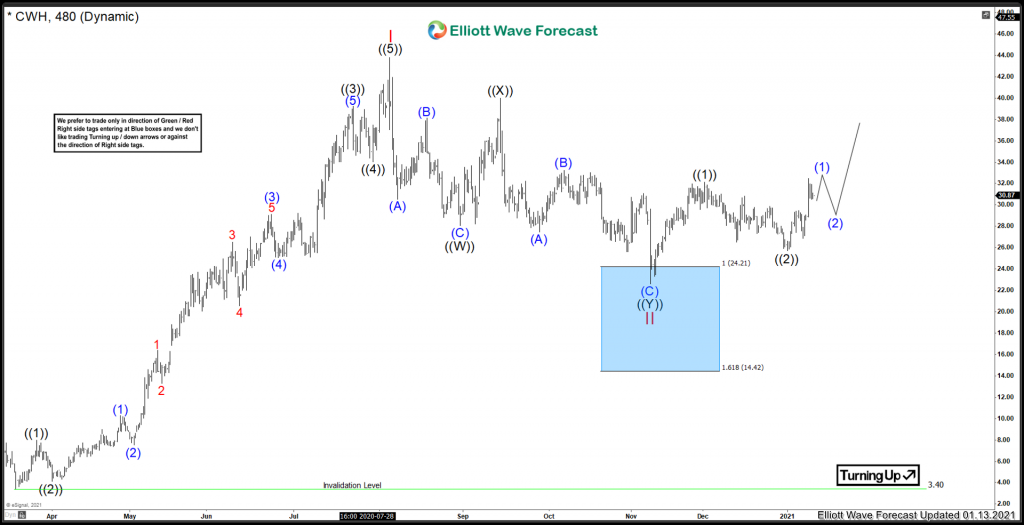
Back in Late September, I analyzed Camping World Holdings. At the time, I was expecting the correction to complete soon, in the extreme area. Here’s the chart that I posted back then and now an updated chart showing the blue box extreme where buyers entered.
Camping World Holdings September 30/2020 view:
Camping World Holdings 4H January 2021 view:
The main thing to take away from this chart is this the power of the extreme area blue boxes. Elliottwave doesn’t predict time, but Fibonacci extreme areas are able to predict price. The reason this works is because these are the areas where the Algo’s are programmed to react. We are simply piggy backing on top of algo programming. The key to successful trading is letting the market speak and remembering we do not control the market. We need to work with the Algo’s and Market Makers. Now that you have seen the blue box work, lets zoom into the 1H short term view.
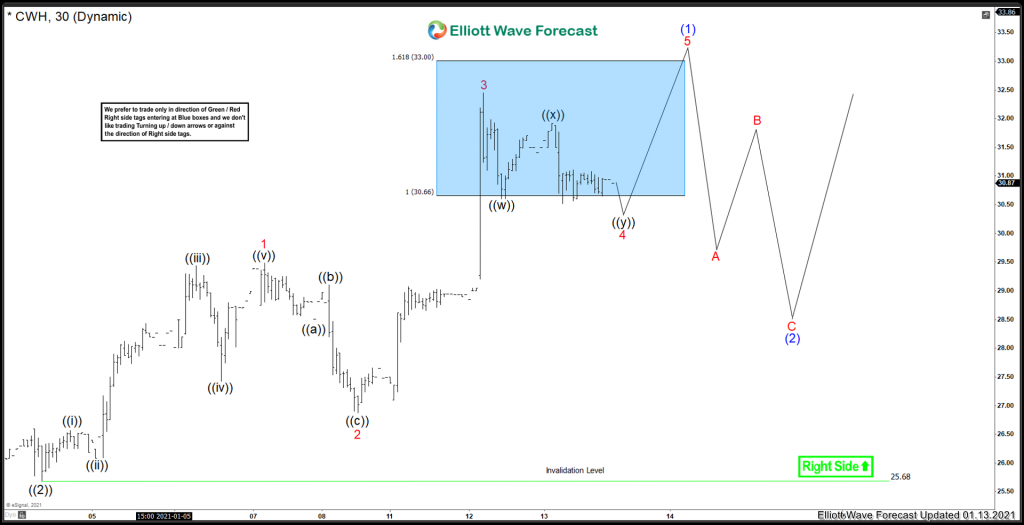
Camping World Holdings 1H View:
CWH is in the middle of another extreme area where a pullback can take place, this is favoured to be where Red 3 has peaked. One more high will meet the minimum number of swings needed from the ((2)) low. After that, a correction in Blue (2) is favoured, creating a triple nest stricture. Which is Red I and II, Black ((1)) and ((2)), and Blue (1) and (2).
In Conclusion, after blue (2) is set, this stock should be ready to break out in a Wave 3. There is another blue box equal leg extreme above Red I. This is the 63-88 area, an area where a pullback can take place. Once prices break out above Red I, that will be the next target on the upside.
Do you want more blue box setups like this? We offer 72 instruments and give you blue box setups where reactions can take place. Improve your trading success and sign up with our free 14 day trial today.
Risk Management
Using proper risk management is absolutely essential when trading or investing in a volatile stocks. Elliott Wave counts can evolve quickly, be sure to have your stops in and define your risk when trading.
Back


