The latest US Consumer prices number last Friday rose by 1.1 percent year-on-year in August 2016, which is above the market consensus of a 1% rise. This number is the biggest inflation figure in 4 months. Annual core inflation, excluding food and energy, rose to 2.3%, also above market expectation of 2.2%. Although both numbers beat expectation, the Fed is unlikely to hike the rates today and may opt to elect a December hike.
Recent commentary by the core FOMC members such as Yellen, Dudley, and Fischer suggested that the case for gradual rate normalization has become stronger, but they did not suggest a timeline. Meanwhile, the Fed’s doves Brainard and Tarullo said they want to see actual inflation to rise before making up decision to hike rates.
Indeed, the Fed Funds future now is only pricing in a 15% chance of a rate hike in September meeting. This means it will be quite a shock to the market if a rate hike is announced. The most likely scenario is the Fed may delay hiking the rate but use a firmer tone from this month through the year-end, when a rate hike finally may be announced. If there’s no rate hike on September, then the next FOMC meeting will be on November as there’s no FOMC meeting on October. The November meeting is too close to the presidential election that chances are they will wait until December 13-14 FOMC meeting to hike. If the Fed does hike the rate today, they will likely stress that future hike is going to be gradual and data-dependent. Thus, even in the case of a rate hike, the USD strength is maybe limited.
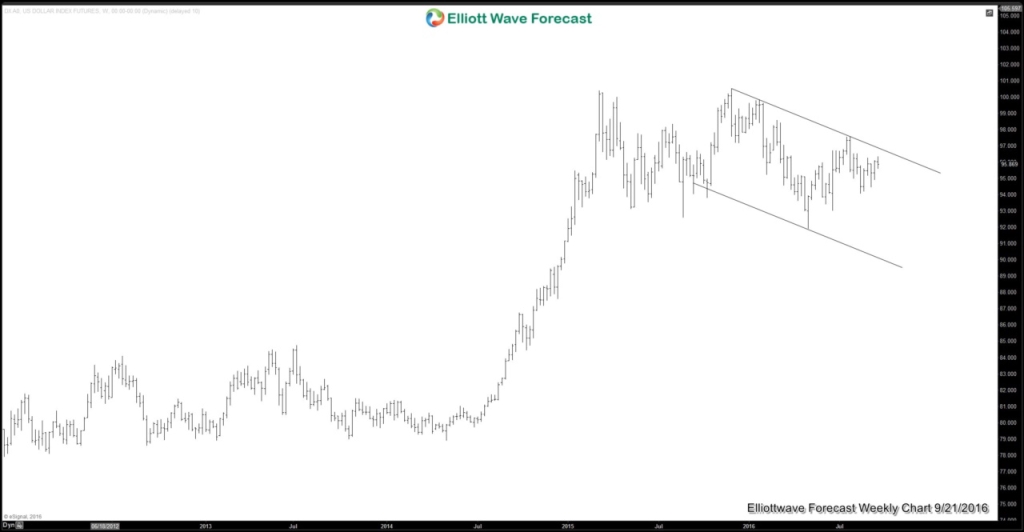
US Dollar Index Chart
Looking at the weekly chart of the USD Index, the Index is trading inside the bearish channel starting from 11.30.2015 peak. As long as the Index stays within this channel, the USD strength is likely limited.
Take our FREE 14 Day Trial or join our Live Trading Room if you are interested to learn more and find inflection area to trade $DXY, $EURUSD or other forex, indices, and commodities using Elliottwave technique. We provide Elliott Wave chart in 4 different time frames, up to 4 times a day update in 1 hour chart, two live sessions by our expert analysts, 24 hour chat room moderated by our expert analysts, market overview, and much more! You can also read other articles at our Technical Blogs and check Chart of The Day
Back

