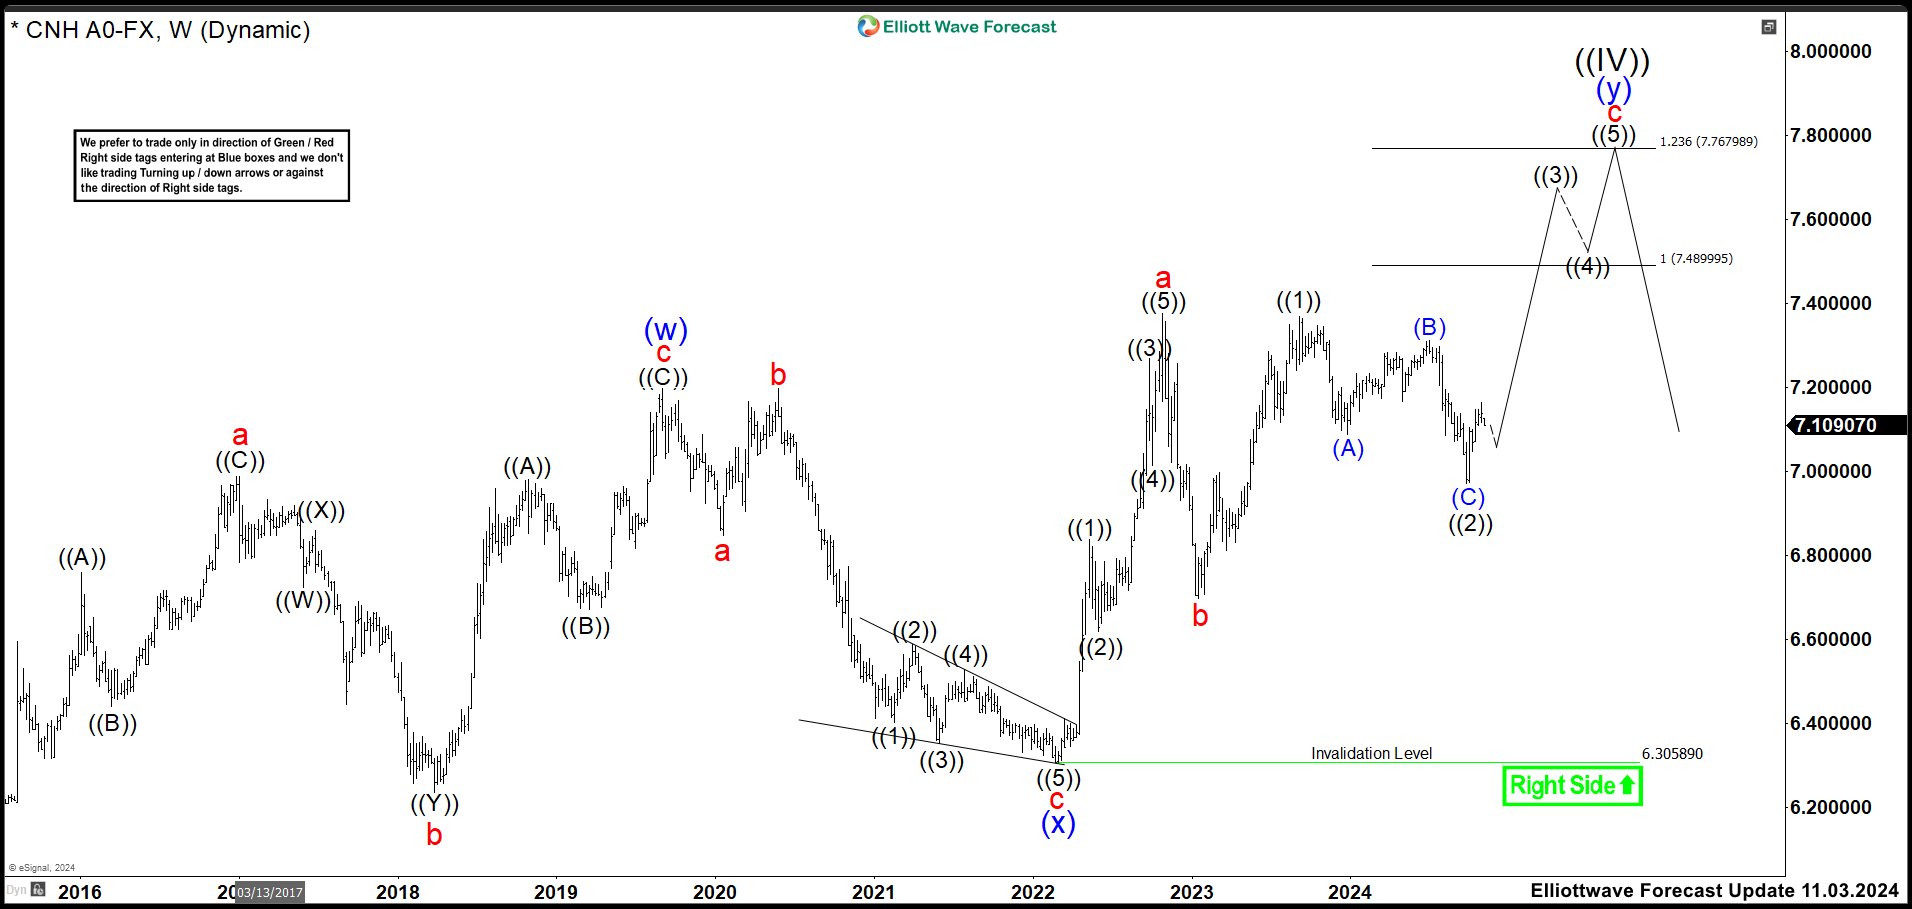
In recent years, the renminbi paused its attempt to strengthen against the USD. In February 2014, the renminbi found support at 6.0153 as wave ((III)). From there, it formed a perfect zig-zag corrective structure, reaching equal legs at the 7.1964 high in September 2019. Following these three swings, USDCNH was expected to continue its downtrend. However, the pair turned upward again, breaking above the 7.1964 high, which suggested that it was developing a double correction structure. (If you want to learn more about Elliott Wave Theory, please follow these links: Elliott Wave Education and Elliott Wave Theory)
USDCNH October 2024 Weekly Chart
In the previous chart, the first leg of wave “c” completed successfully. Starting from the 6.6883 wave “b” low, the pair climbed higher in 5 swings, forming an impulse that peaked at the 7.3679 high, labeled as wave ((1)). The wave ((2)) pullback then unfolded, following a zig-zag structure (A), (B), and (C), and ended precisely at the 6.9705 low within the expected range of 7.12 – 6.95.
After completing wave ((2)), the pair resumed its rally, building an impulse as wave “c” toward the target area of 7.4899 – 7.7679 This move aimed to finalize wave (y) and complete the double correction as wave ((IV)), allowing the renminbi to continue its downtrend in monthly timeframe.
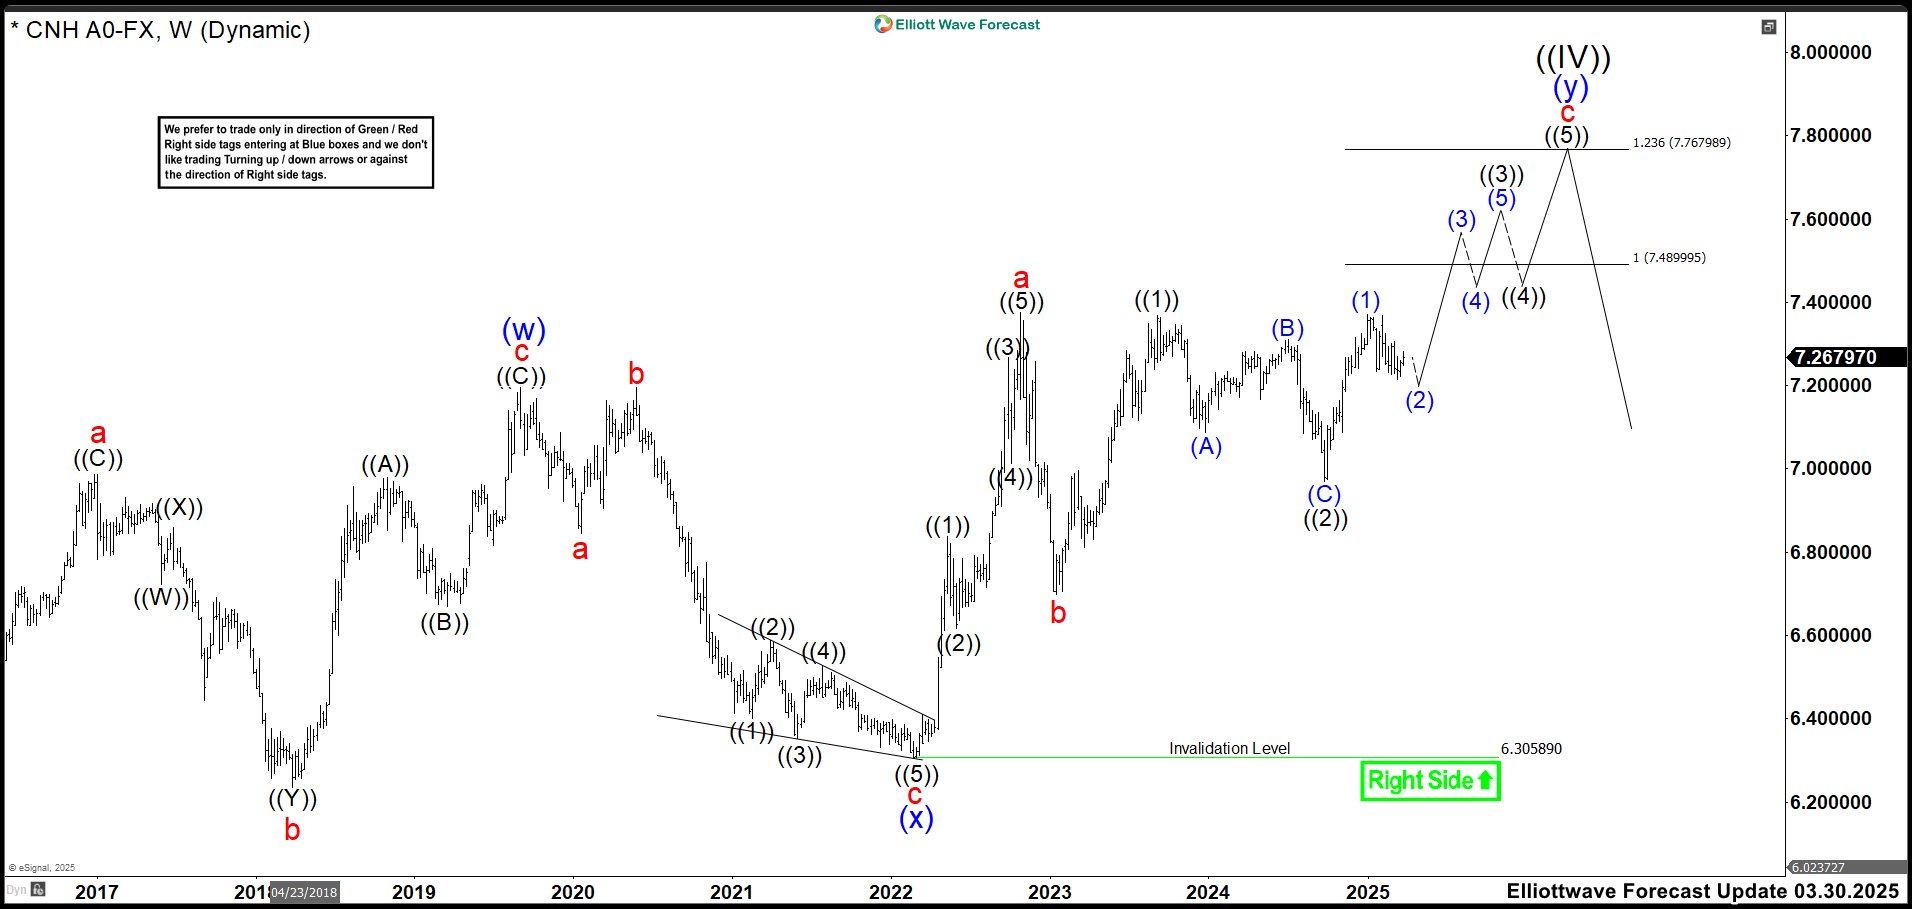
USDCNH March 2025 Weekly Chart
Currently, we can see the rally of wave (1) of ((3)) that concluded at the 7.3700 high. This movement has not broken into new highs which is crucial for sustaining bullish momentum. We have also witnessed a pullback that is likely wave (2) of ((3)). Despite the sharp depreciation of the dollar in recent weeks, the pair has not moved to the same magnitude as the dollar, which is a positive indicator for maintaining the bullish structure. As in previous months, we expect the upward trend to continue targeting to 7.4899 – 7.7679 area completing a double correction Elliott Wave pattern. At this level, we should see a bearish reaction in the USDCNH.
Transform Your Trading with Elliott Wave Forecast!
Ready to take control of your trading journey? At Elliott Wave Forecast, we provide the tools you need to stay ahead in the market:
✅ Hourly Updates: Fresh 1-hour charts updated 4 times a day and 4-hour charts updated daily for 78 instruments.
✅ Blue Boxes: High-frequency trading zones, calculated using sequences, cycles, and extensions. These areas pinpoint ideal setups for smarter trades.
✅ Live Sessions: Join our daily live discussions and stay on the right side of the market.
✅ Real-Time Guidance: Get your questions answered in our interactive chat room with expert moderators.
🔥 Exclusive Offer: Start your journey with a 14-day trial for only $9.99. Gain access to exclusive forecasts and Blue Box trade setups. No risks, cancel anytime by reaching out to us at support@elliottwave-forecast.com.
💡 Don’t wait! Elevate your trading game now. Trial us at: 🌐
Back


