
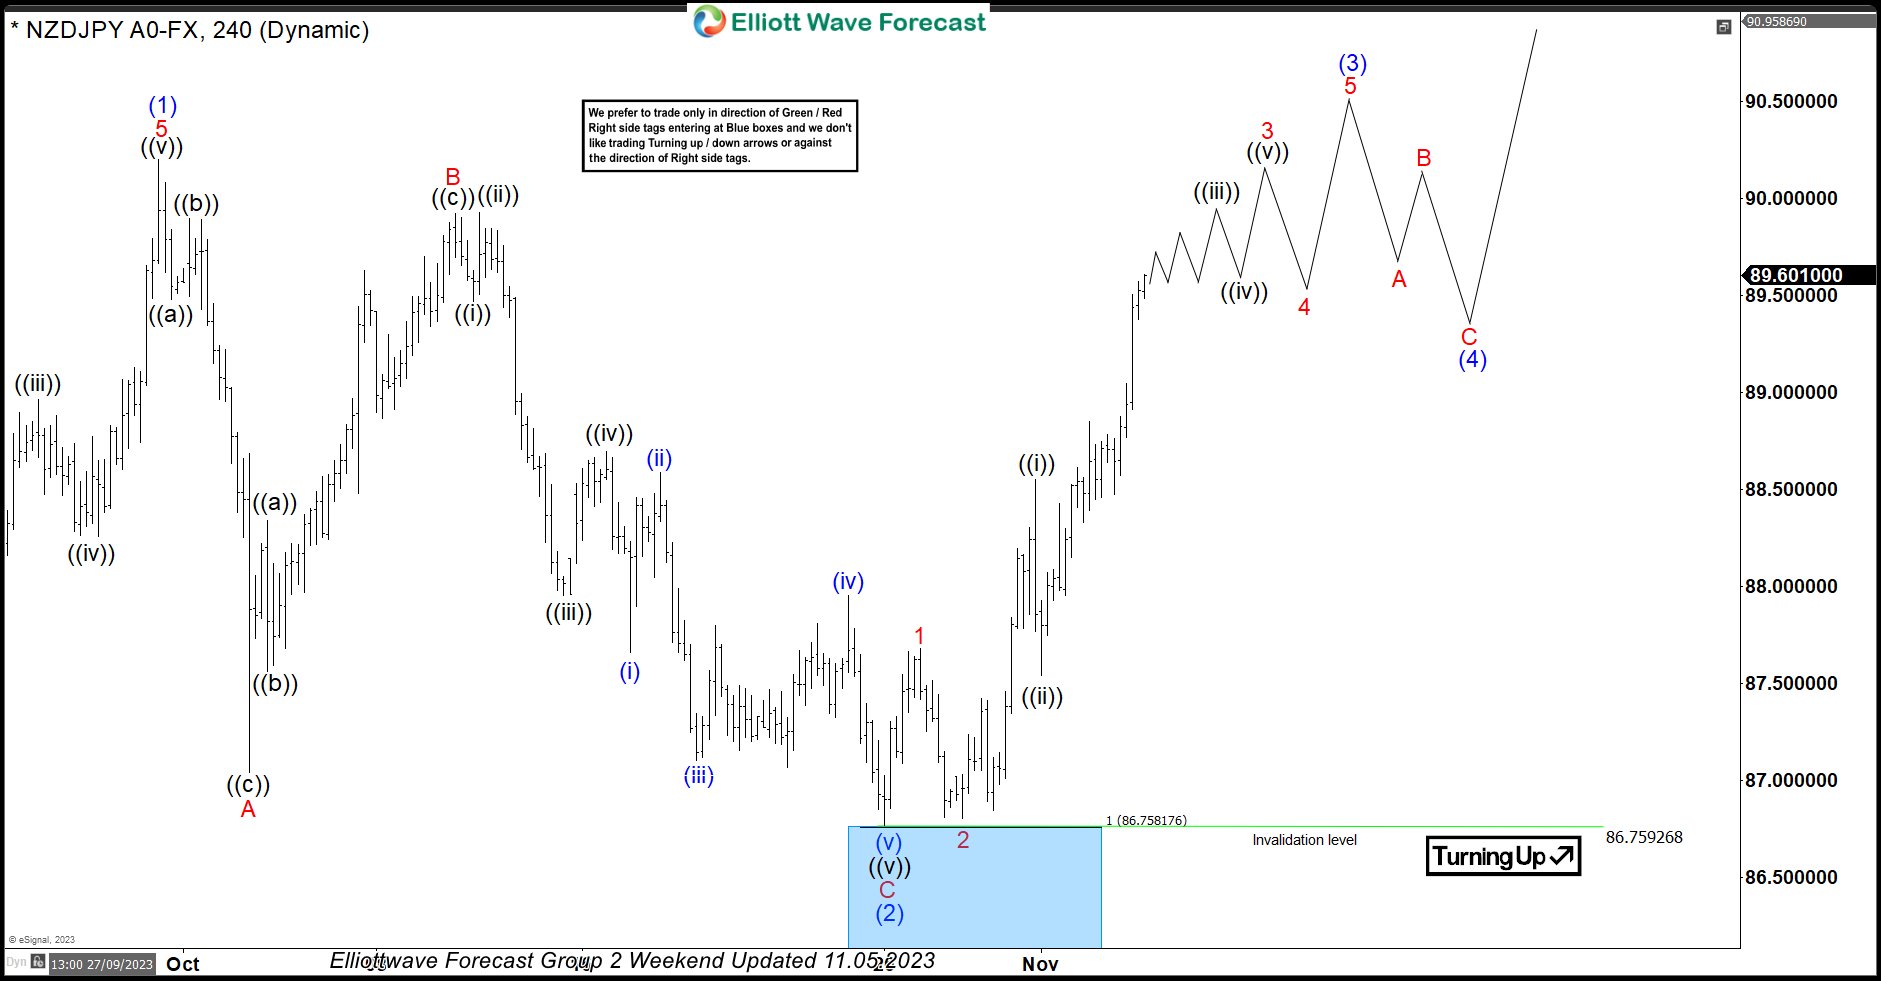
In this technical blog, we will look at the past performance of the 4-hour Elliott Wave Charts of NZDJPY. In which, the rally from 24 March 2023 low unfolded as an impulse sequence and showed a higher high sequence. Therefore, we knew that the structure in NZDJPY is incomplete to the upside & should extend higher. So, […]
-
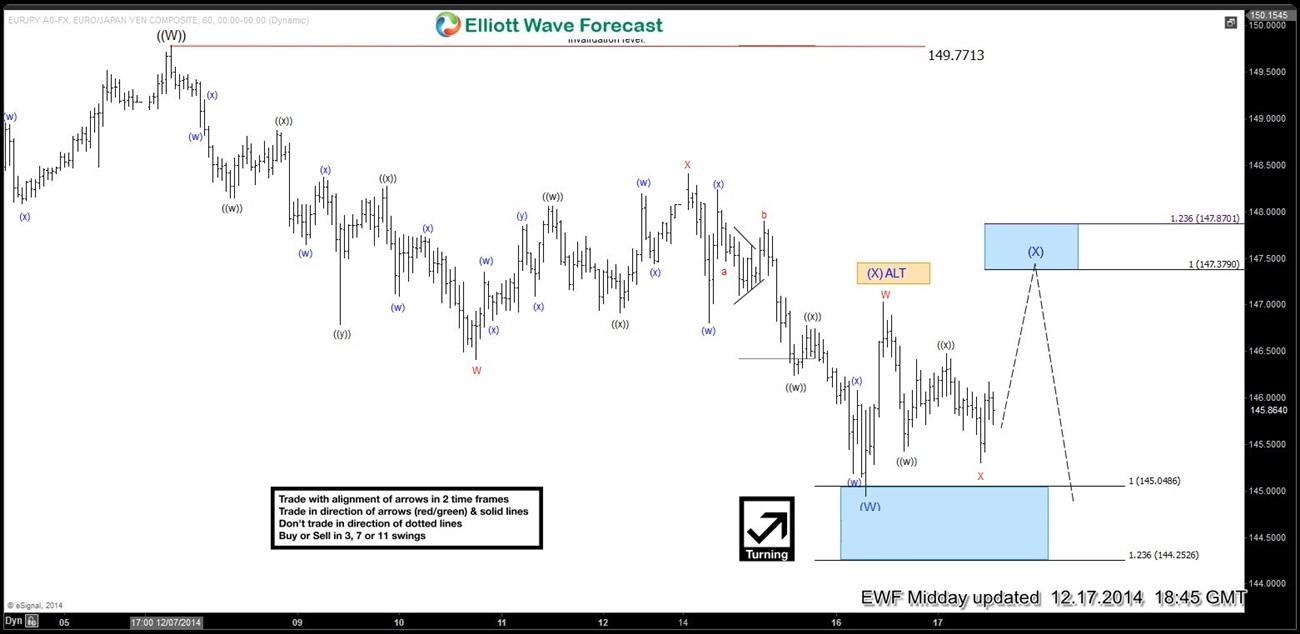
EURJPY Short-term Elliott Wave Analysis 12.17.2014
Read MorePreferred Elliott Wave suggests pair has ended a WXY structure from 149.77 high, we have labelled it as wave (W). Bounce from the lows is also unfolding as a WXY structure and expected to reach 147.37 – 147.87 area which is equal legs – 1.236 ext area of W-X. Market moves in a sequence of […]
-
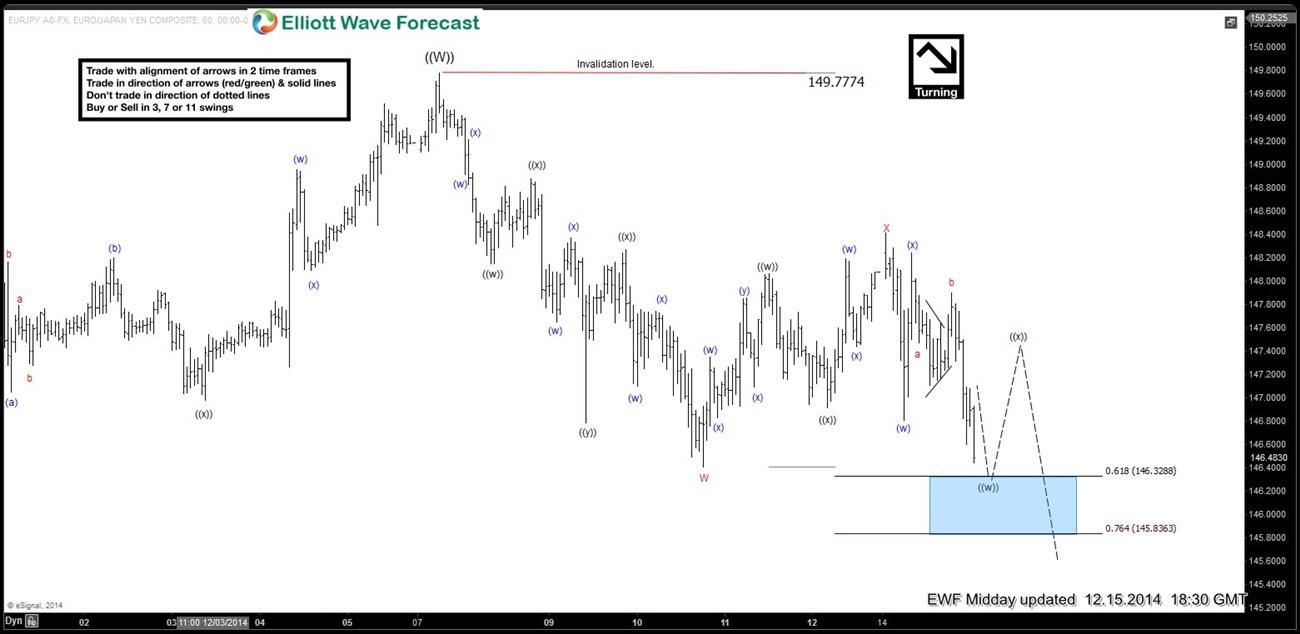
EURJPY Short-term Elliott Wave Analysis 12.15.2014
Read MoreBest reading of the cycles suggests pair has ended a cycle from 10.15 (134.12) low and is due a larger 3 wave pull back in 4 hour time frame. Let’s take a look at Elliott wave structure of the decline from 149.77 peak. Initial decline from 149.77 – 146.40 was a triple three or ((w))-((x))-((y))-((z)) […]
-
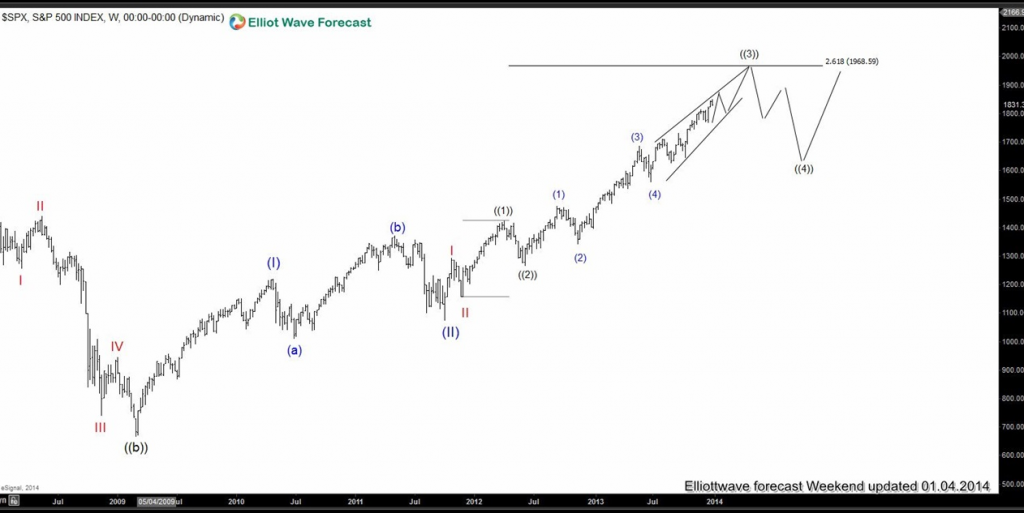
2014 : The Year in Review
Read MoreThe year 2014 has come to an end and EWF had an outstanding year forecasting the markets for our members. We have no doubt that 2015 will be another outstanding year. We at EWF understand that nobody can forecast the markets with 100% accuracy and we will never say that we are always right in […]
-

AUDJPY Elliott Wave Setup Video
Read MoreAUDJPY 12.8.2014 AUDJPY looks like is the 1st Yen pair to end the cycle from Mid-October low among Indices and Yen pairs. Today pair broke below 99.91 area so while below 101.36, pair has scope to test 98.86 – 98.31 area to end the cycle from 102.40 high. After that we would expect a bounce at least […]
-
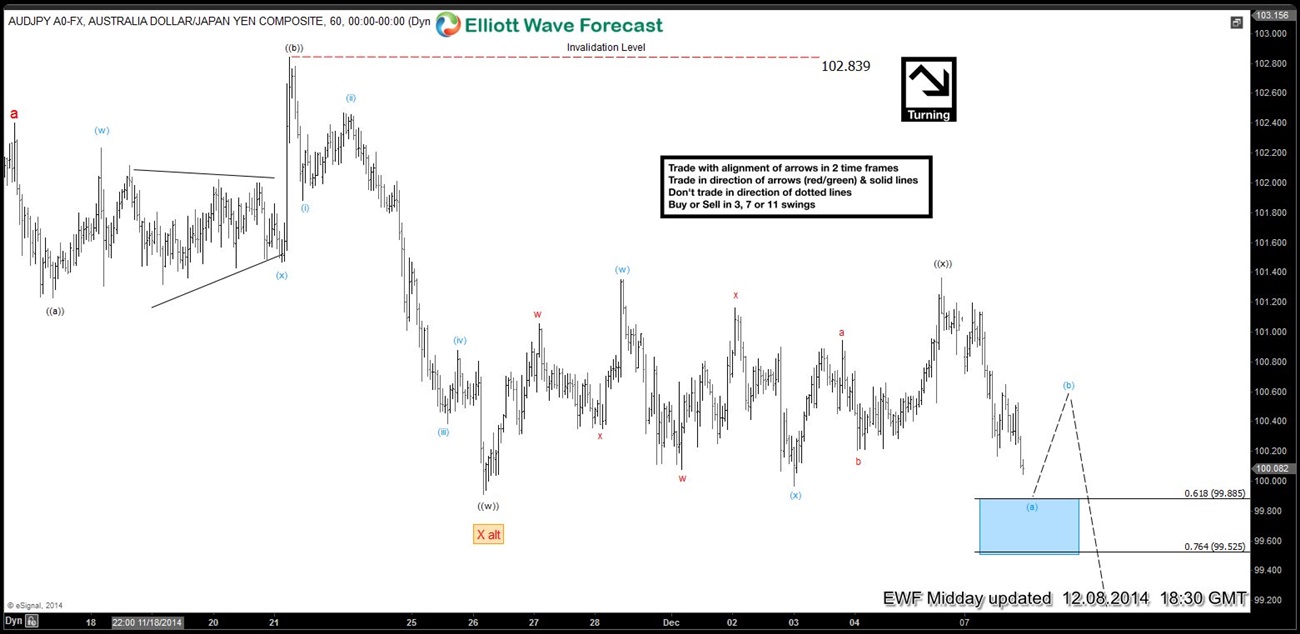
AUDJPY Short-term Elliott Wave Analysis 12.8.2014
Read MorePreferred Elliott Wave view suggests price action between 102.40 (11.16) – 99.91 (11.26) was a FLAT structure and completed wave (( w)). FLAT is a 3-3-5 structure in Elliott Wave Theory and this one in particular was an Expanded FLAT. You can learn more about 3 types of FLAT structures here We have seen a 3 […]
-
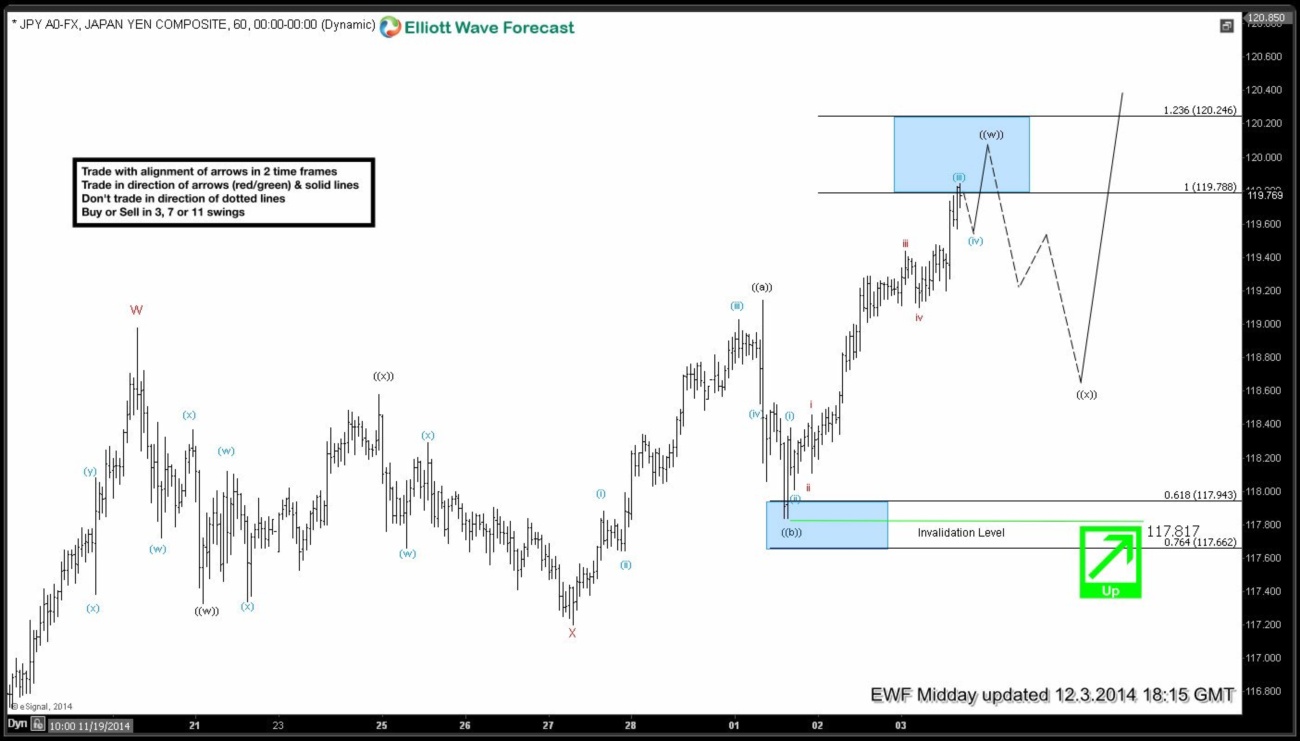
USDJPY Short-term Elliott Wave Analysis 12.3.2014
Read MoreUSDJPY has reached equal legs up from 117.20 as was expected during the weekend Elliott wave update. Another high toward 120.25 is still expected to complete the current Elliott wave cycle i.e. wave (( w )) before we get a pull back in wave (( x )) and higher again. Risk / reward is not great […]