
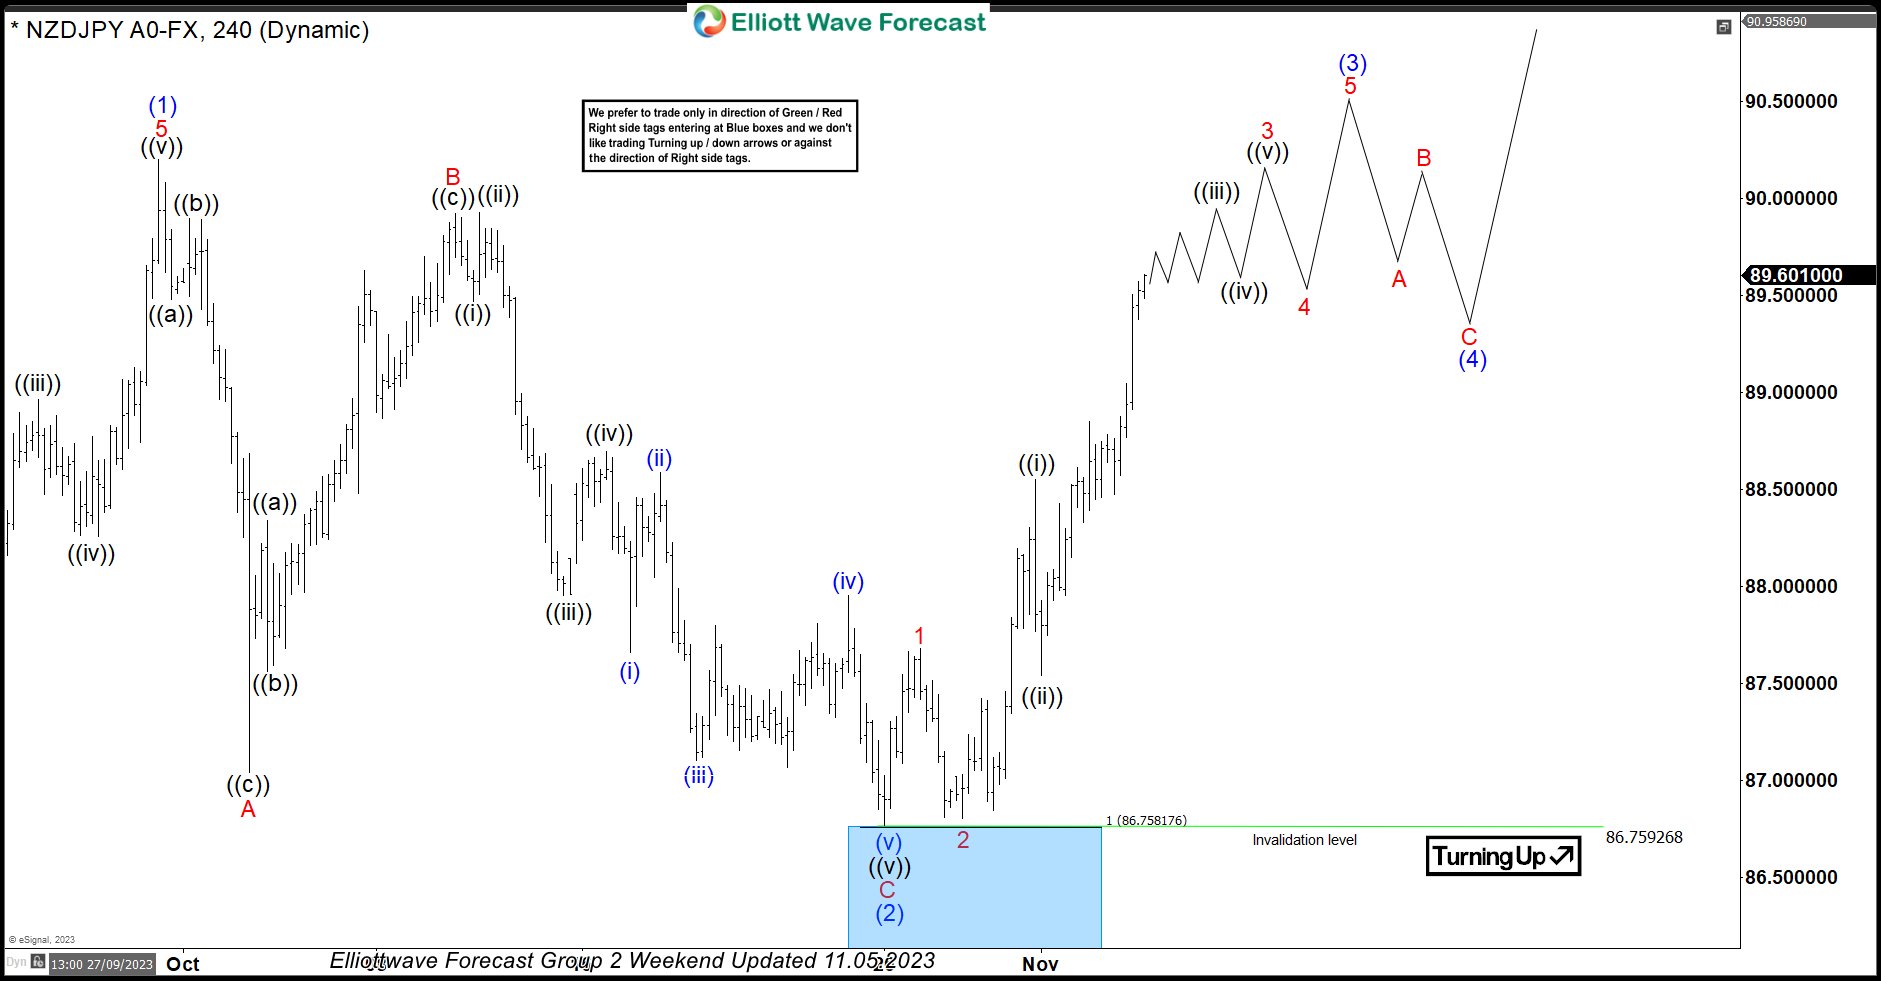
In this technical blog, we will look at the past performance of the 4-hour Elliott Wave Charts of NZDJPY. In which, the rally from 24 March 2023 low unfolded as an impulse sequence and showed a higher high sequence. Therefore, we knew that the structure in NZDJPY is incomplete to the upside & should extend higher. So, […]
-
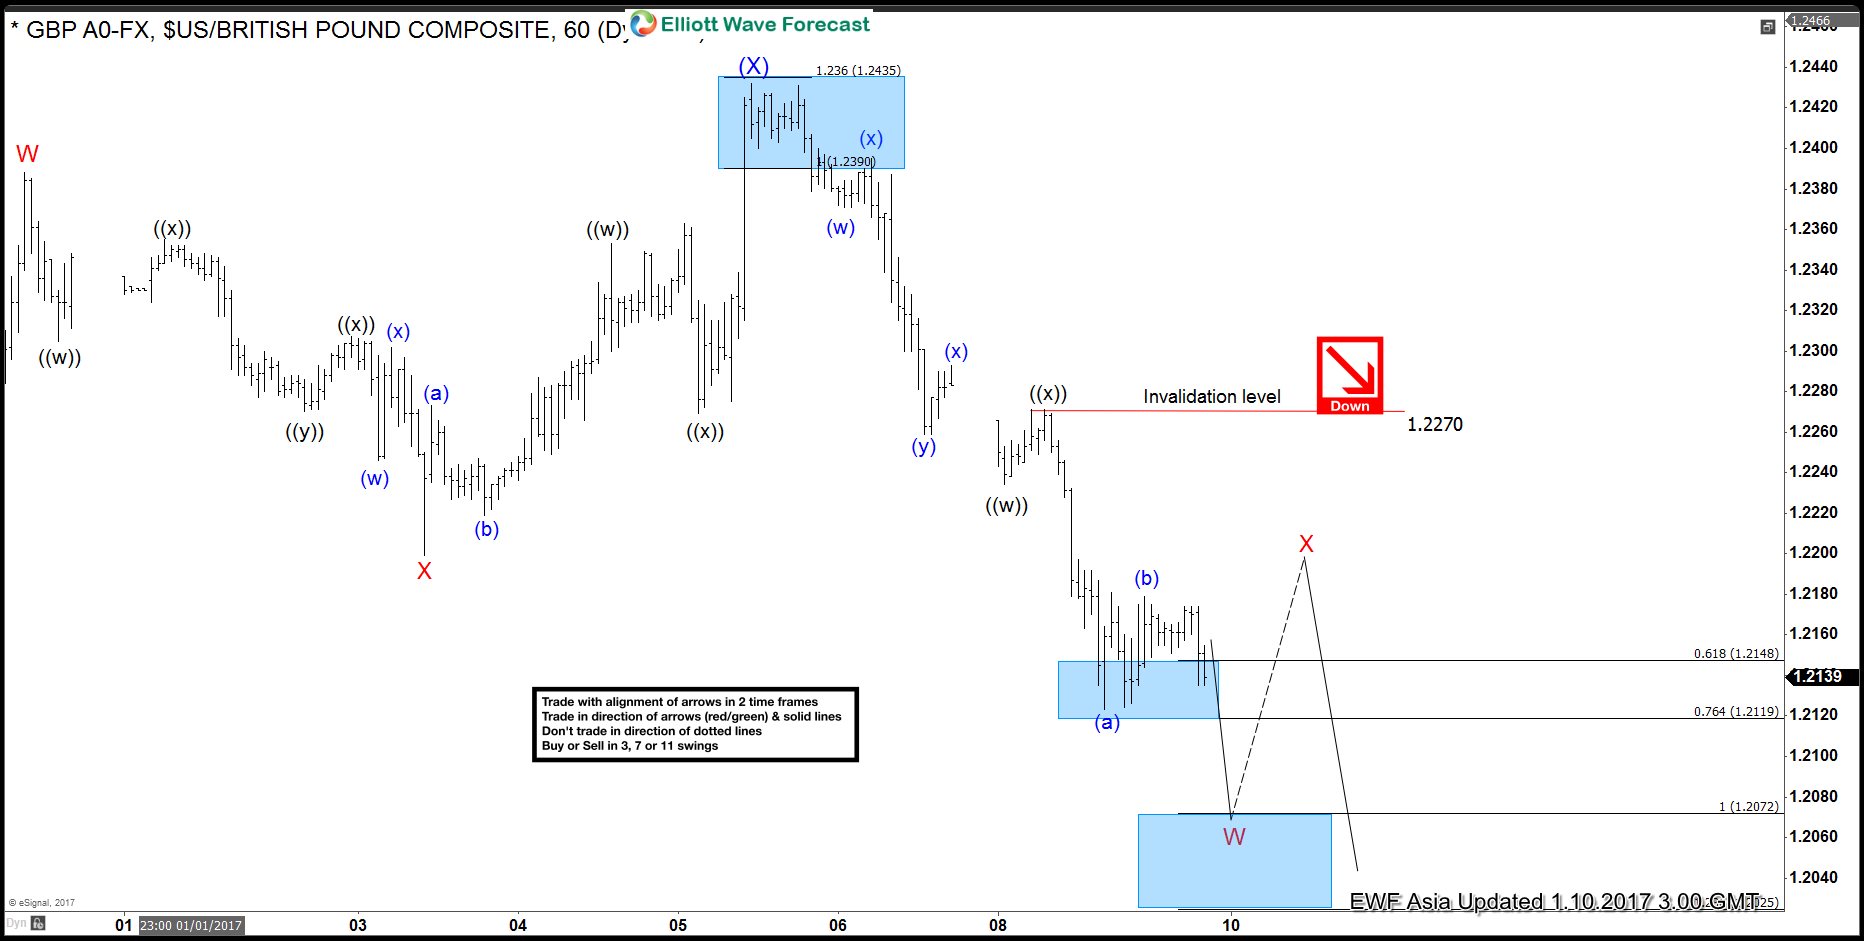
GBPUSD Elliott Wave Forecast 1.10.2017
Read MoreGBPUSD is showing a 5 swing bearish sequence from 12/6 peak (1.277) which favors more downside. The decline from 12/6 peak is unfolding as a double three where wave (W) ended at 1.2198 and wave (X) ended at 1.2432. GBPUSD has since broken below wave (W) at 1.2198 which suggests that the next leg lower has […]
-

NZDCAD Elliottwave Analysis 1/6/2017
Read MoreBelow is an Elliott Wave analysis video on NZDCAD. The pair is currently correcting the rally from 8/24/2015 low and could see more downside short term before the rally resumes to new high or at least bounce in 3 waves. If you enjoy this analysis, feel free to try our service –> 14 days FREE […]
-
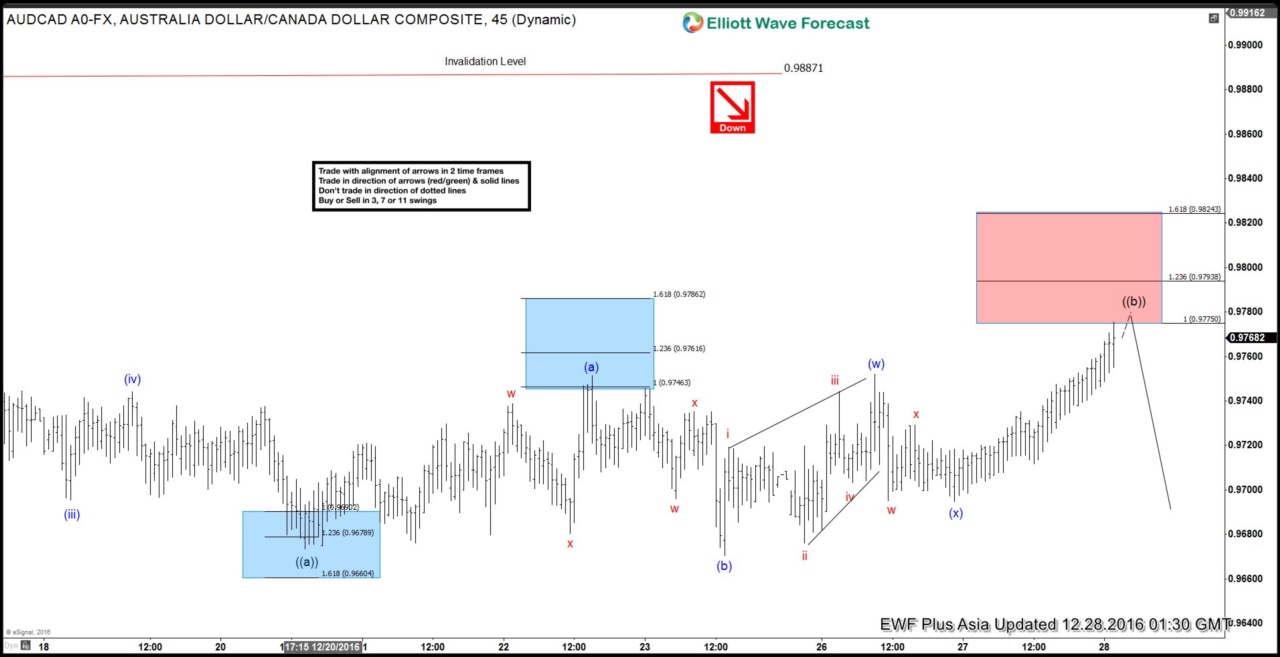
AUDCAD Elliott wave Strategy of the Day (12/27/2016)
Read MoreOn 27th of December 2016, Our Strategy of the Day Video presented to clients viewed the bounce in AUDCAD as a selling opportunity in the pair. Short AUDCAD (12/27/2016) On 12/27/2016, pair was showing incomplete swing sequence (5 swings) from 11/10 peak & was missing the target (0.9545 – 0.9415 area). This suggested Elliott wave sequence was incomplete […]
-
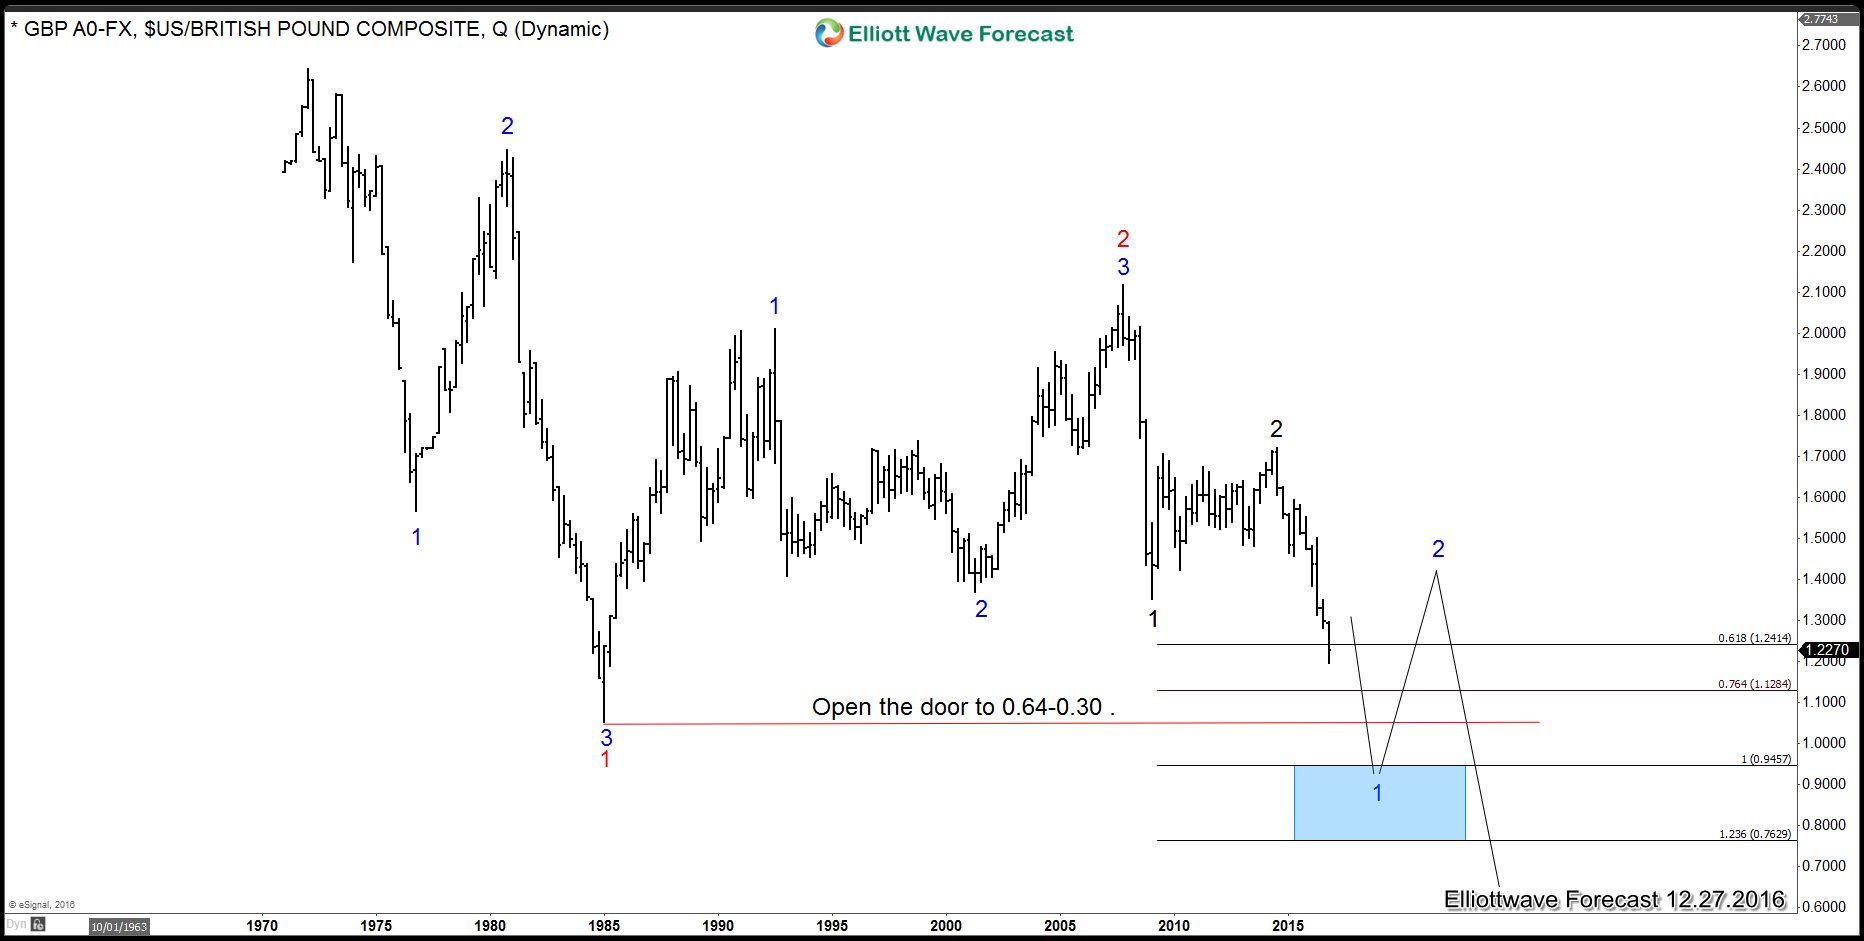
GBPUSD Can a dip into the $0.60-$0.30 area happen?
Read MoreThe GBPUSD has been declining since the late 1960’s. The currency instrument did see a three wave decline into the 1985 low. This low represents either a pause into the longer term decline sequence or the beginning of a new bullish sequence. From the 1985 lows the currency rallied for 22 years based in Elliott wave hedging, which […]
-
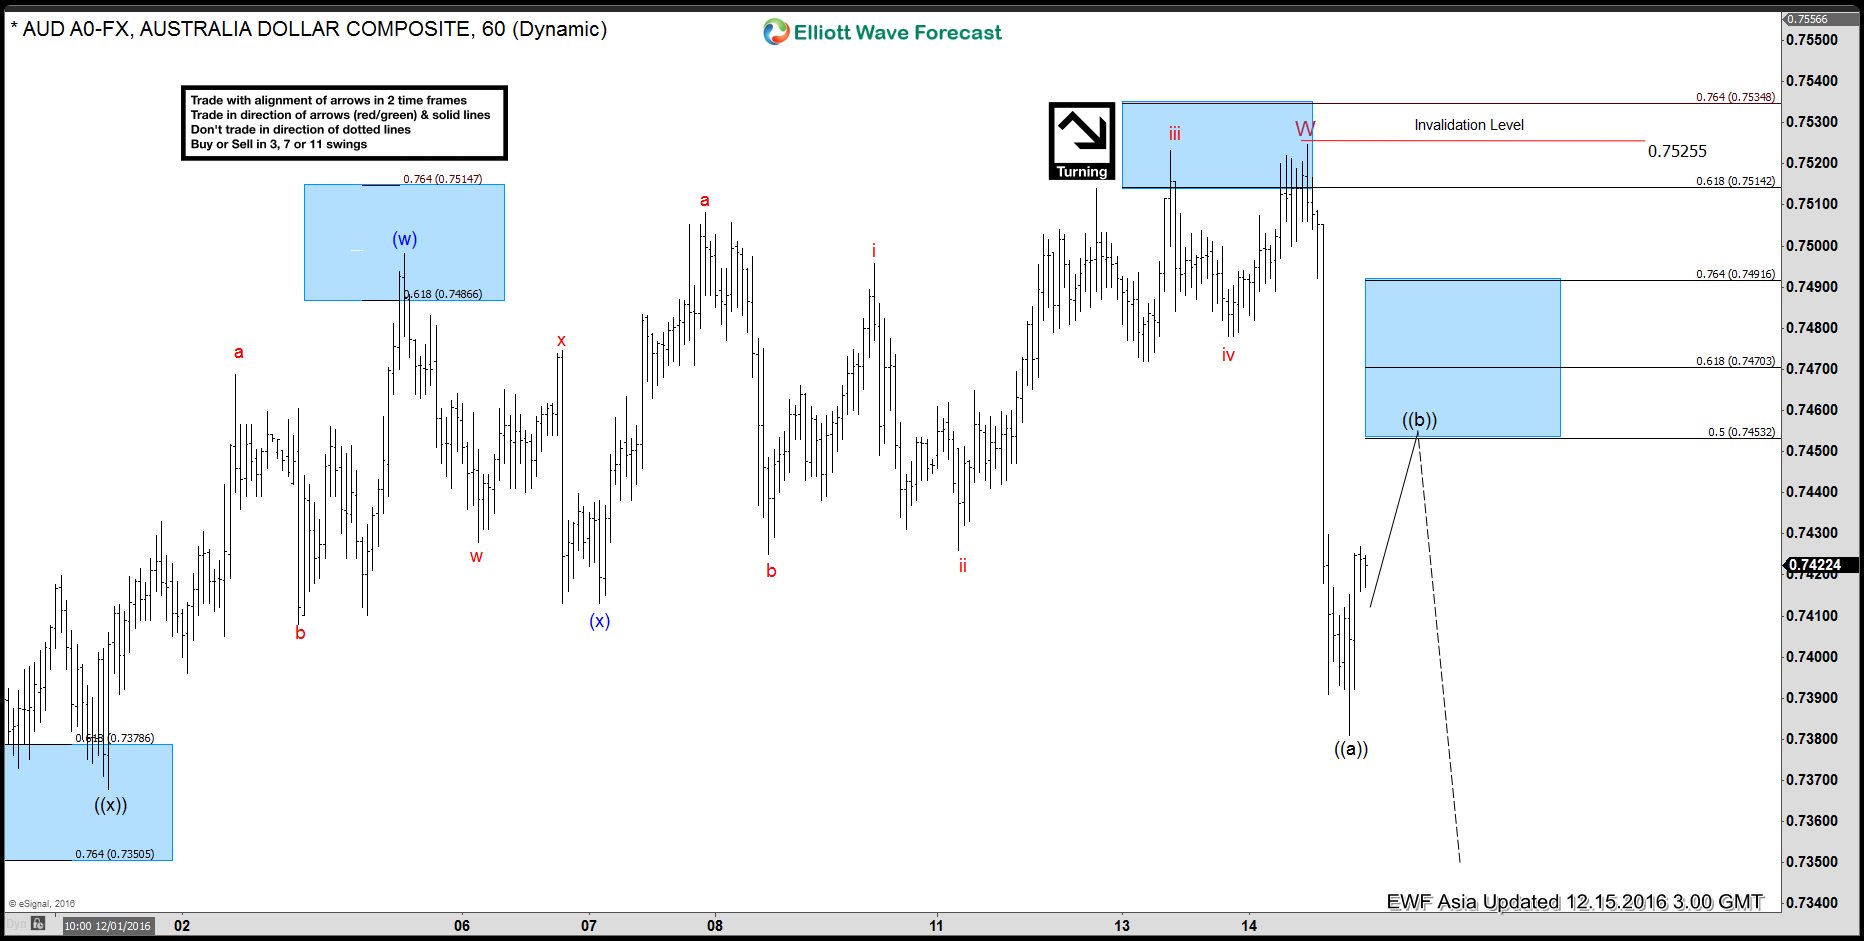
AUDUSD Elliott Wave Forecast 12.15.2016
Read MoreShort Term AUDUSD Elliott wave forecast suggests that the decline to 0.7306 on 11/21 low ended wave (X). Up from there, pair is rallying as a double three structure where wave ((w)) ended at 0.749, wave ((x)) ended at 0.736, and wave ((y)) of W is proposed complete at 0.7525. Pair is currently in wave X […]
-
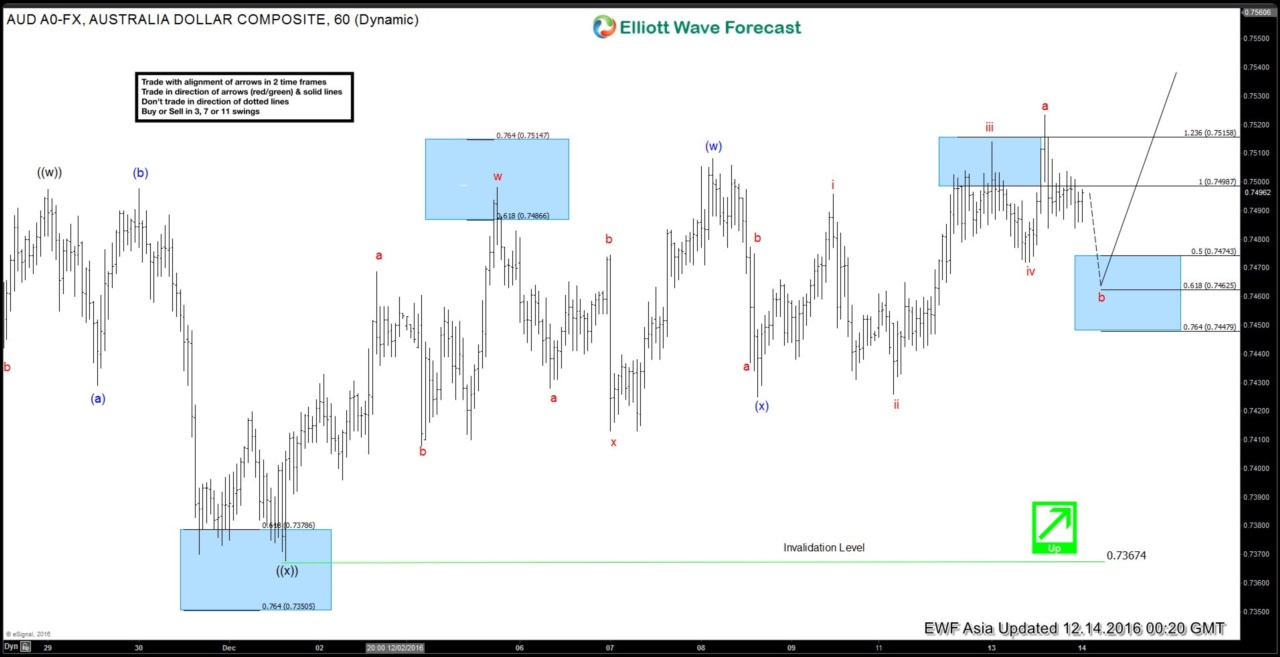
AUDUSD Elliott Wave Forecast 12.14.2016
Read MoreShort Term AUDUSD Elliott wave forecast suggests that the decline to 0.7306 on 11/21 low ended wave (X). Up from there, pair is showing a 5 swing sequence from 11/21 low and suggest more upside. Rally from 11/21 low is unfolding as a double three structure where wave ((w)) ended at 0.749 and wave ((x)) ended […]