
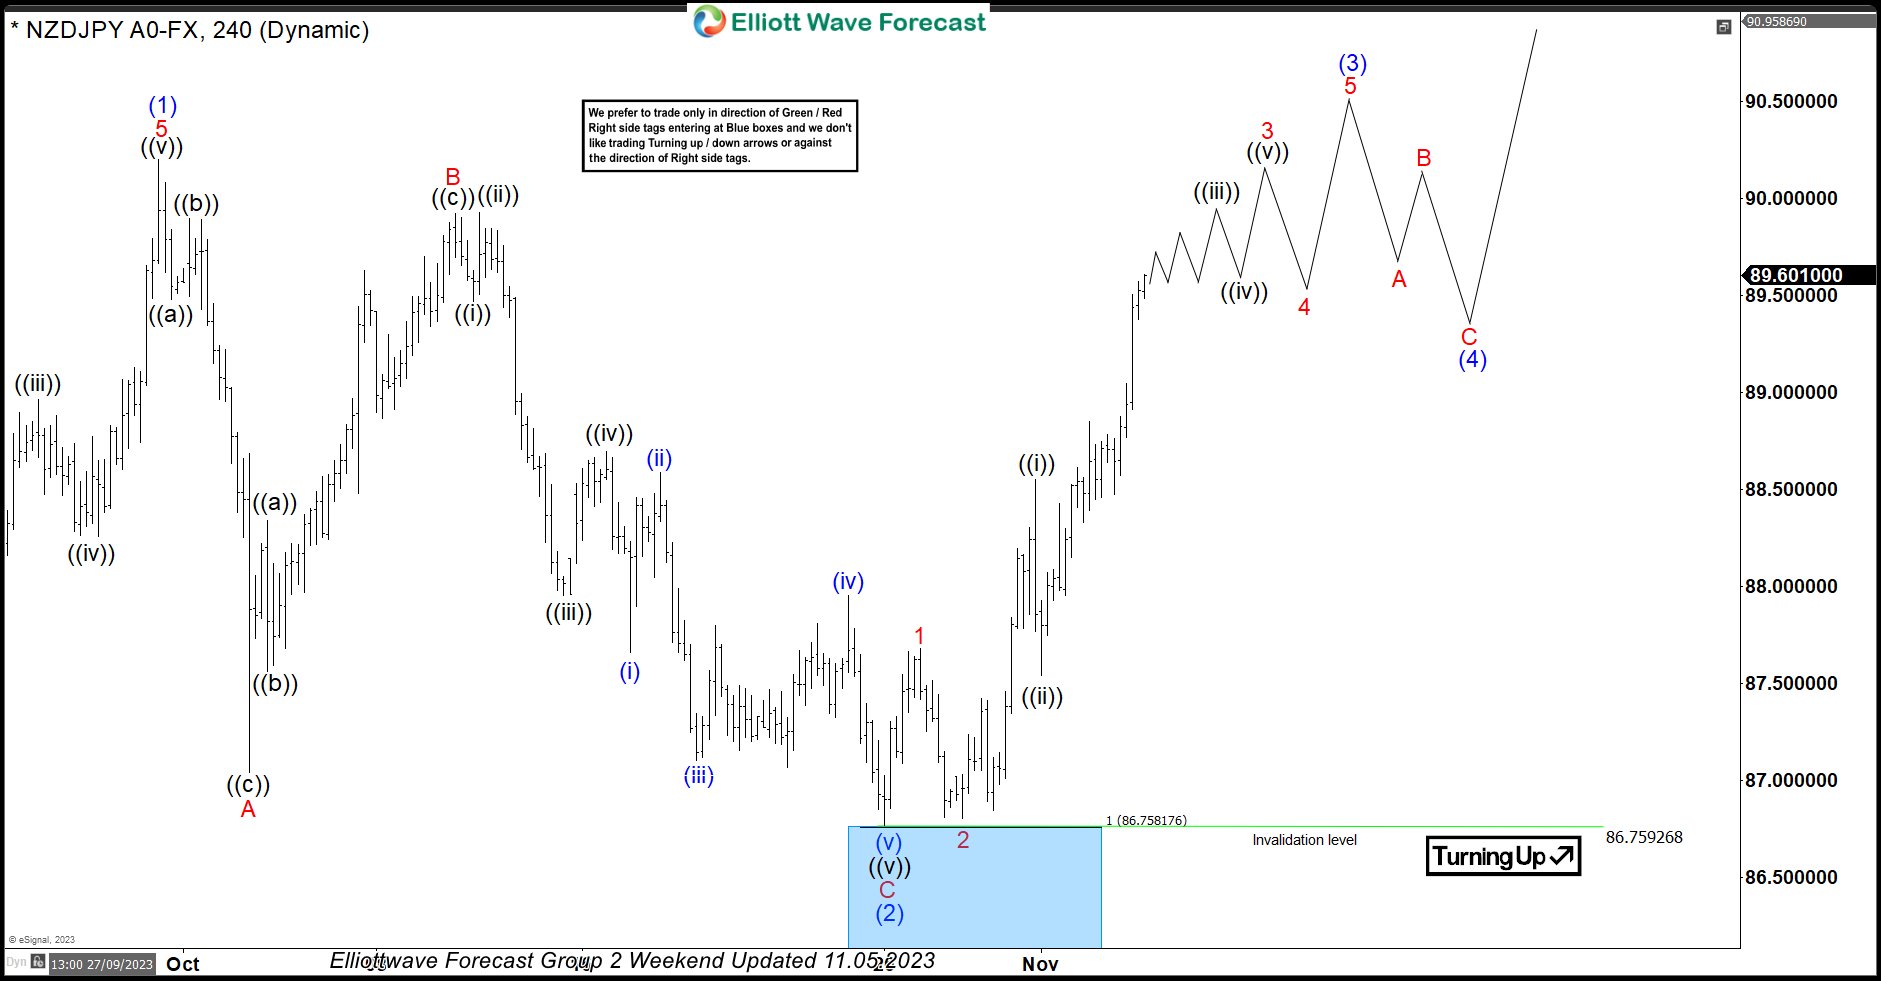
In this technical blog, we will look at the past performance of the 4-hour Elliott Wave Charts of NZDJPY. In which, the rally from 24 March 2023 low unfolded as an impulse sequence and showed a higher high sequence. Therefore, we knew that the structure in NZDJPY is incomplete to the upside & should extend higher. So, […]
-
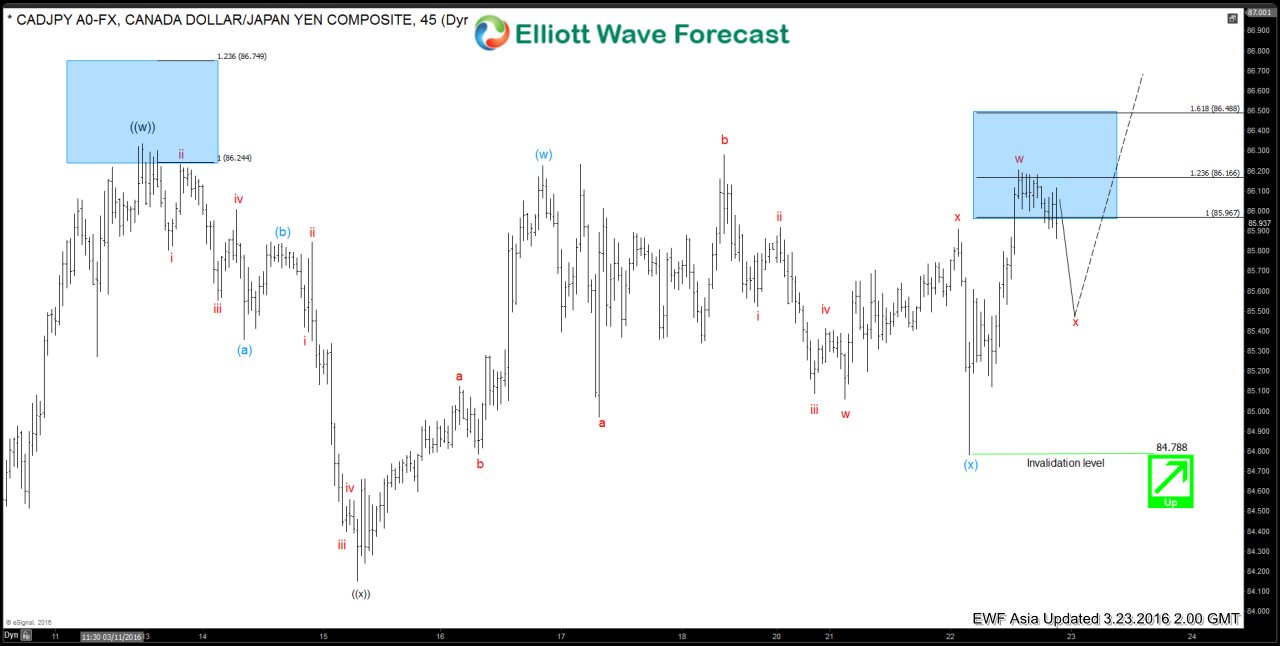

$CADJPY Short-term Elliott Wave Analysis 3.23.2016
Read MoreShort term Elliottwave structure suggests dips to 84.15 ended wave ((x)). Rally from there is unfolding in a double correction where wave (w) ended at 86.22, and wave (x) ended at 84.78. Near term, wave x pullback is in progress with an ideal target of 85.3 – 85.5 (50 – 61.8 back of the rally from 84.78), […]
-
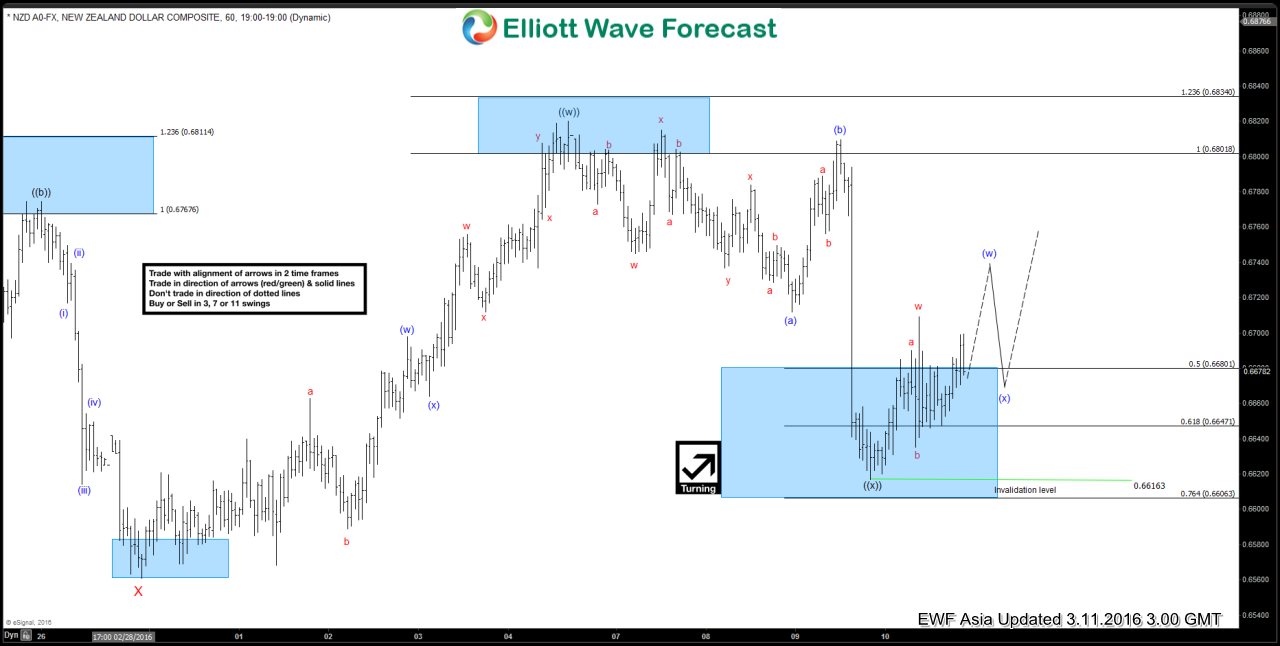
NZDUSD Short-term Elliott Wave Analysis 3.11.2016
Read MoreShort term Elliottwave structure suggests cycle from 2/29 low ended with wave ((w)) at 0.682. Wave ((x)) pullback is unfolding as a FLAT where wave (a) ended at 0.6712, wave (b) ended at 0.6809, and wave (c) of ((x)) is proposed complete at 0.6616. While pullback stays above 0.6616, pair is expected to extend higher. At EWF we offer […]
-

NZDUSD Short-term Elliott Wave Analysis 3.10.2016
Read MoreShort term Elliottwave structure suggests cycle from 2/29 low ended with wave ((w)) at 0.682. Wave ((x)) pullback is unfolding as a FLAT where wave (a) ended at 0.6712, wave (b) ended at 0.6809, and wave (c) of ((x)) is expected to complete at 0.66 – 0.664 area. As far as pivot at 0.6561 remains intact, pair is […]
-
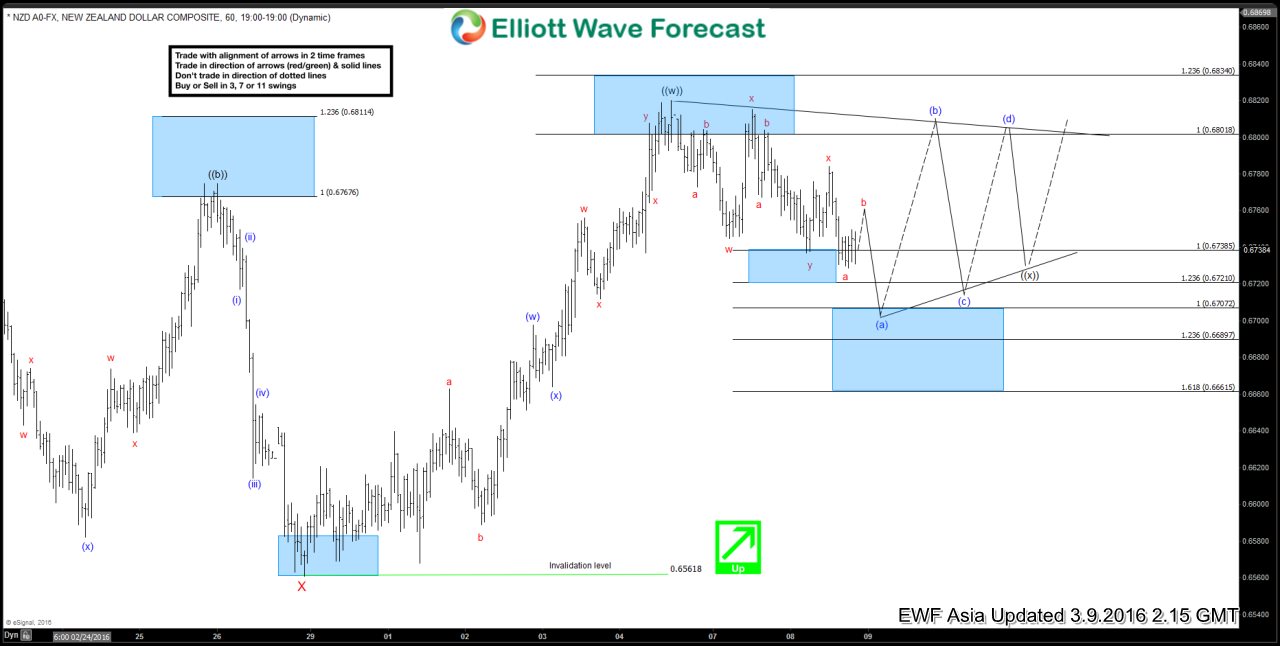
NZDUSD Short-term Elliott Wave Analysis 3.9.2016
Read MoreShort term Elliottwave structure suggests cycle from 2/29 low ended with wave ((w)) at 0.682. Wave ((x)) pullback is proposed to be unfolding as a triangle where wave (a) is expected to complete at 0.6689 – 0.6707 area, then it should turn higher in wave (b) and continue triangle consolidation. Once wave ((x)) triangle is complete, […]
-
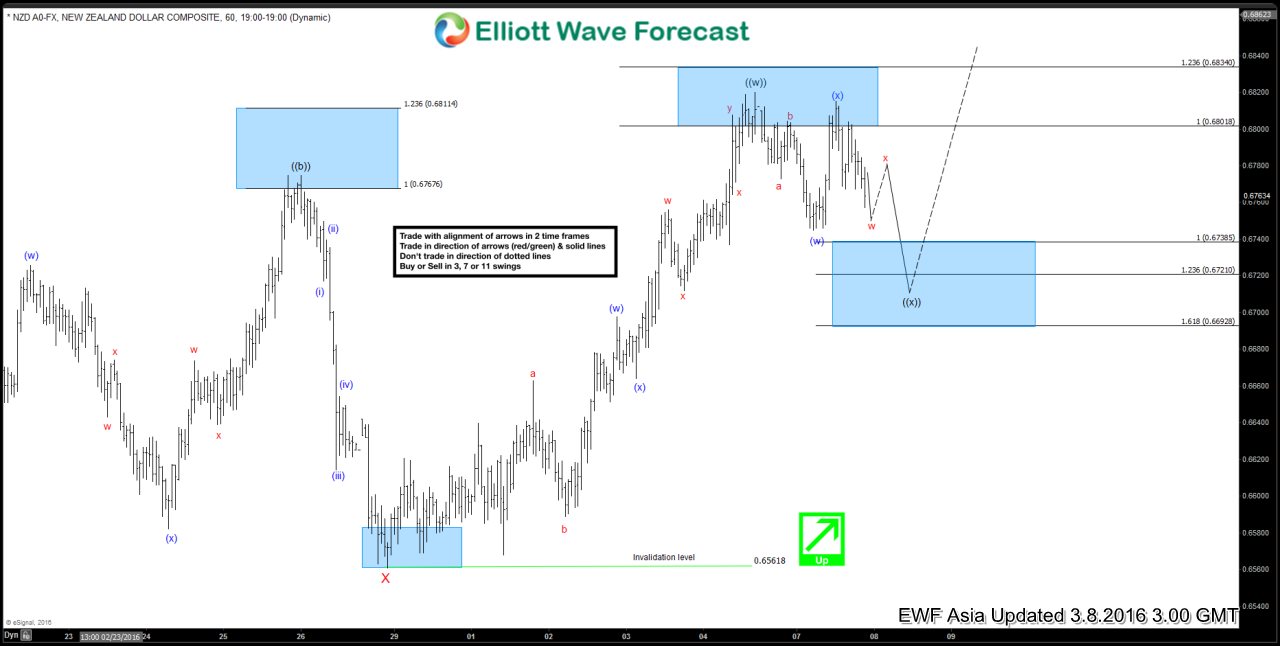
NZDUSD Short-term Elliott Wave Analysis 3.8.2016
Read MoreShort term Elliottwave structure suggests cycle from 2/29 low ended with wave ((w)) at 0.682 and pair is in wave ((x)) pullback. Internal structure of wave ((x)) is unfolding as a double three where wave (w) ended at 0.6745, wave (x) ended at 0.6815, and wave (y) of ((x)) is in progress towards 0.669 – 0.6738 […]
-

How we traded the BOJ this January $USDJPY
Read MoreHow we traded the BOJ this January USDJPY did took the 08.24.2015 lows (116.07) fractionally on the move down from November last year’s secondary peak on 1.20.2016 later, as the lows formed that day was (115.96), which was also the 5th swing target area 0.618-0.764% extension (117.68-116.23) and completed the 5 swing structure from June […]