
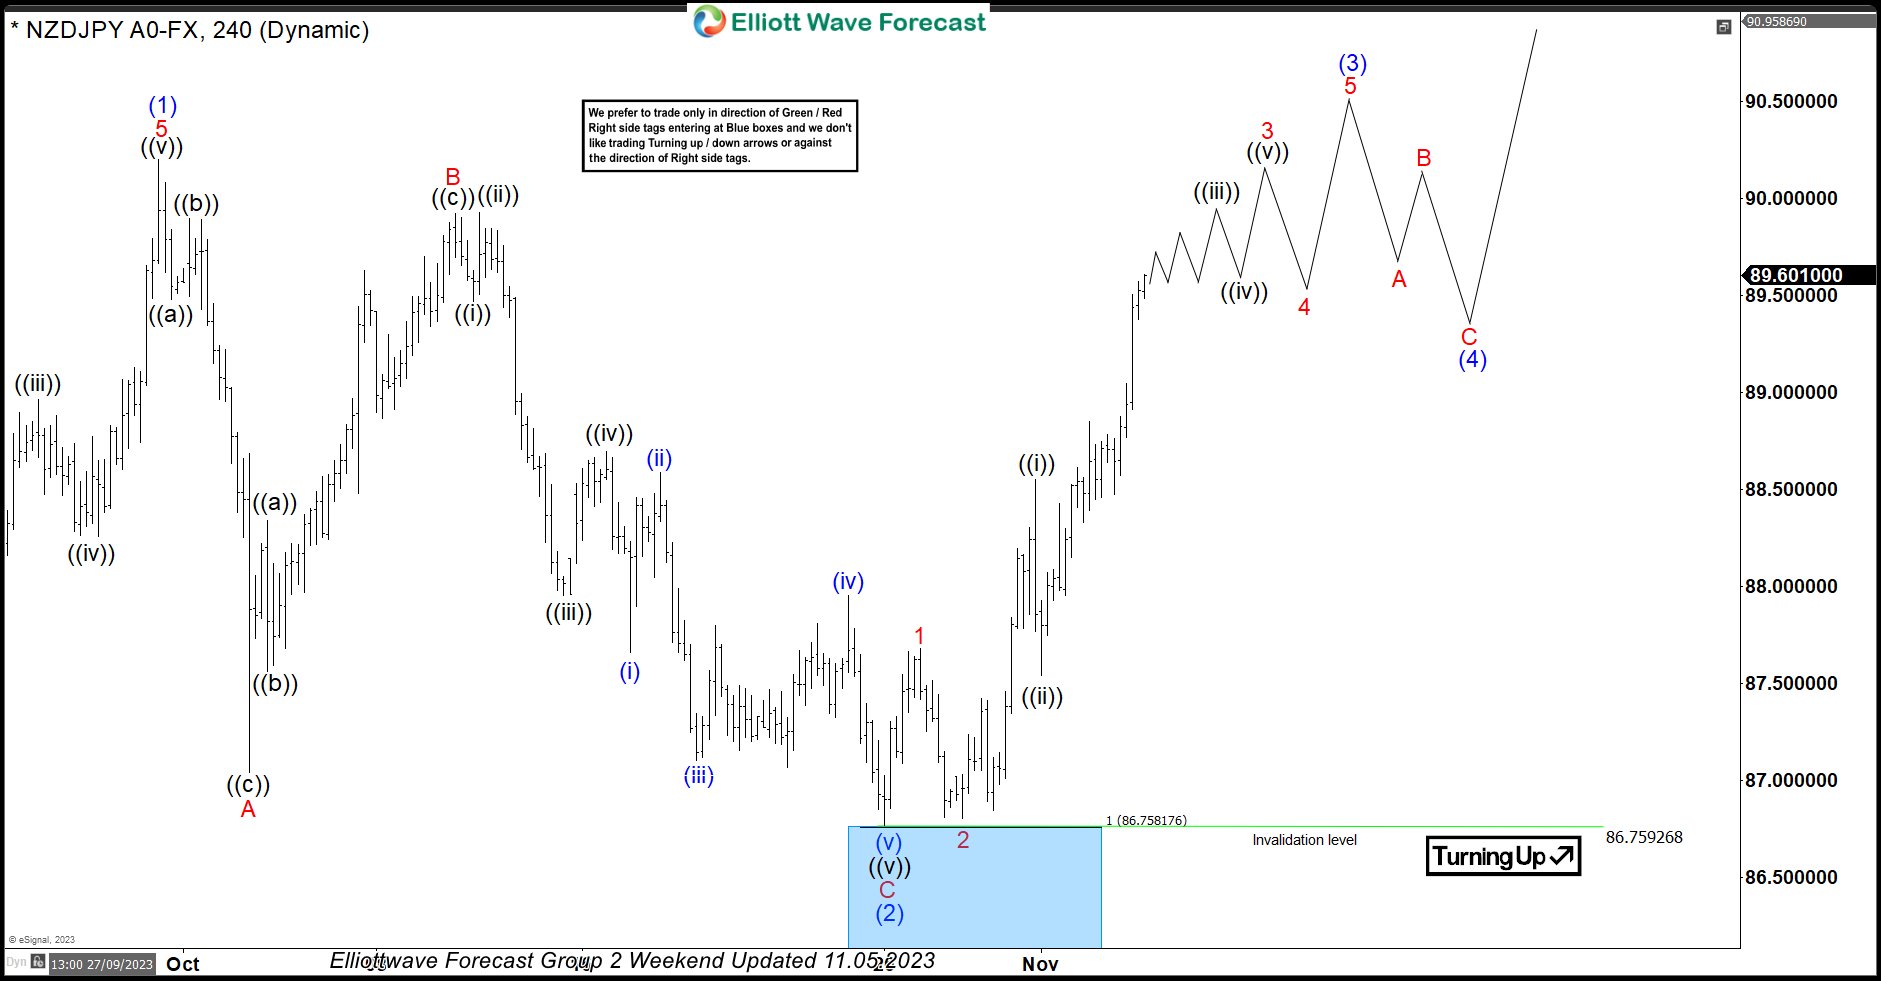
In this technical blog, we will look at the past performance of the 4-hour Elliott Wave Charts of NZDJPY. In which, the rally from 24 March 2023 low unfolded as an impulse sequence and showed a higher high sequence. Therefore, we knew that the structure in NZDJPY is incomplete to the upside & should extend higher. So, […]
-
Progress in Brexit Negotiation Supports Poundsterling
Read MoreBritish Pound Sterling is the best performing major currency last week. The Pound Sterling shows strength as the market senses progress towards a Brexit deal. This follows news pointing to progress in Brexit negotiations. Last week UK Prime Minister Theresa May and EU President Jean-Claude Juncker met in Brussels to secure a deal. Both have […]
-
EOS Token Price Looking for A Technical Recovery
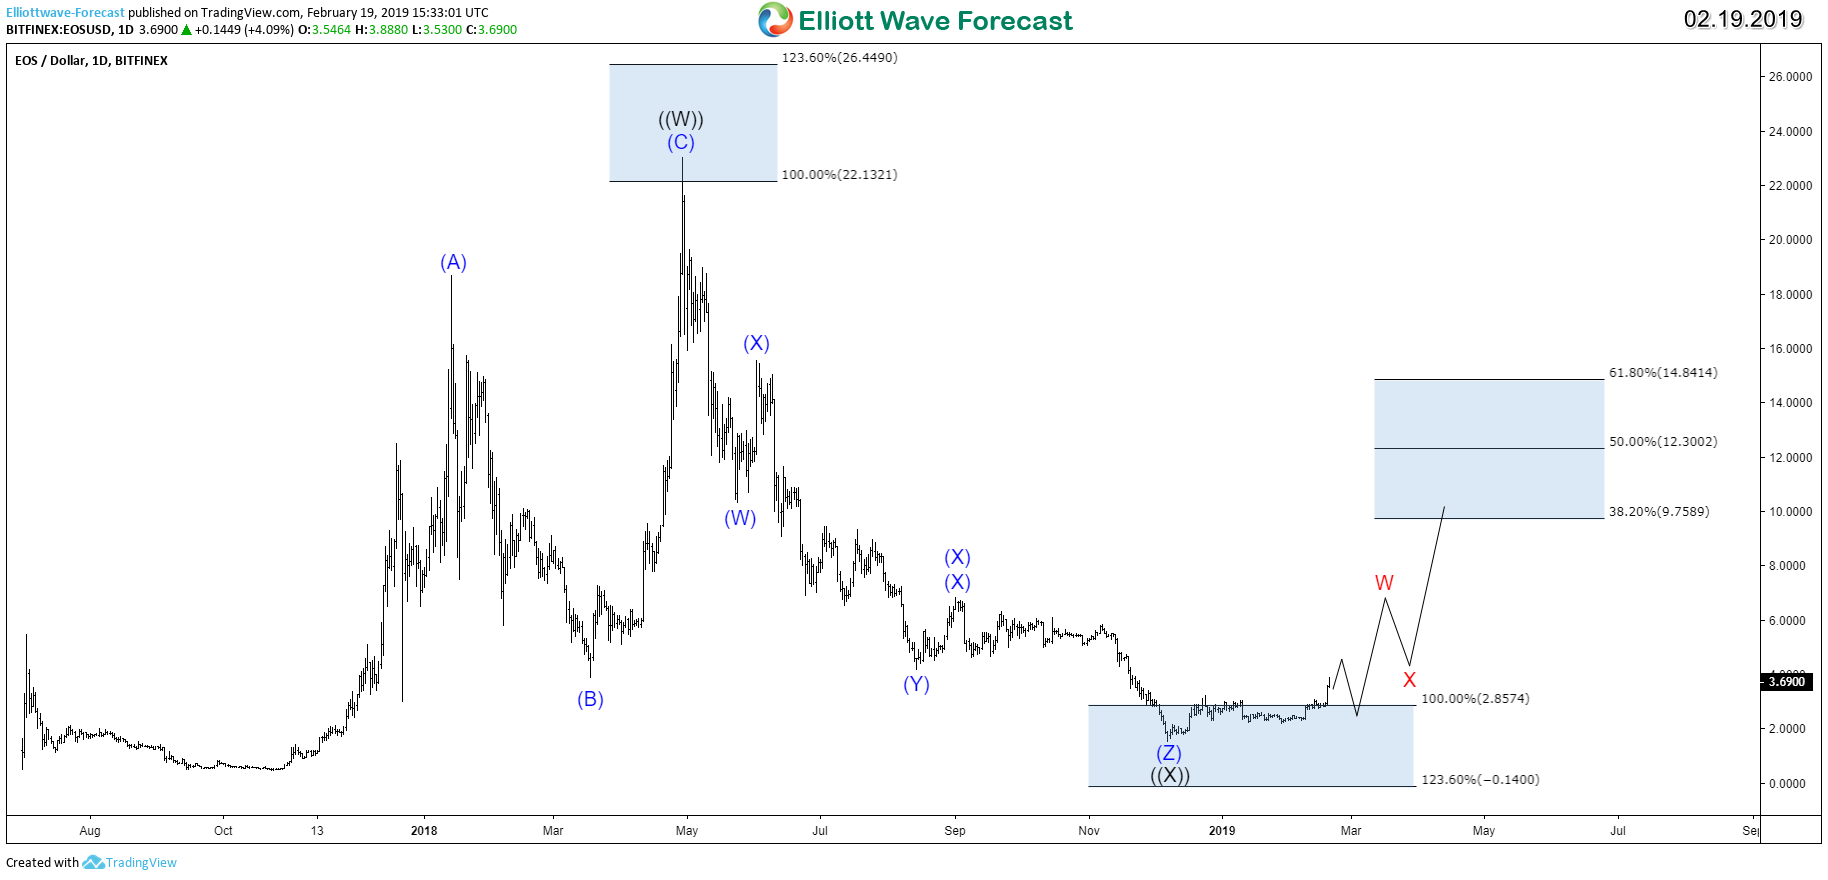
Read MoreThe EOS token is the cryptocurrency of the EOS network which is using the blockchain technology architecture to enable vertical and horizontal scaling of decentralized applications. 2018 was the worst year for cryptocurrency investors as the market saw a significant price drop but despite that, ESO coin managed to make new all time highs during […]
-
GBPJPY Sellers in Control | Elliott Wave Forecast
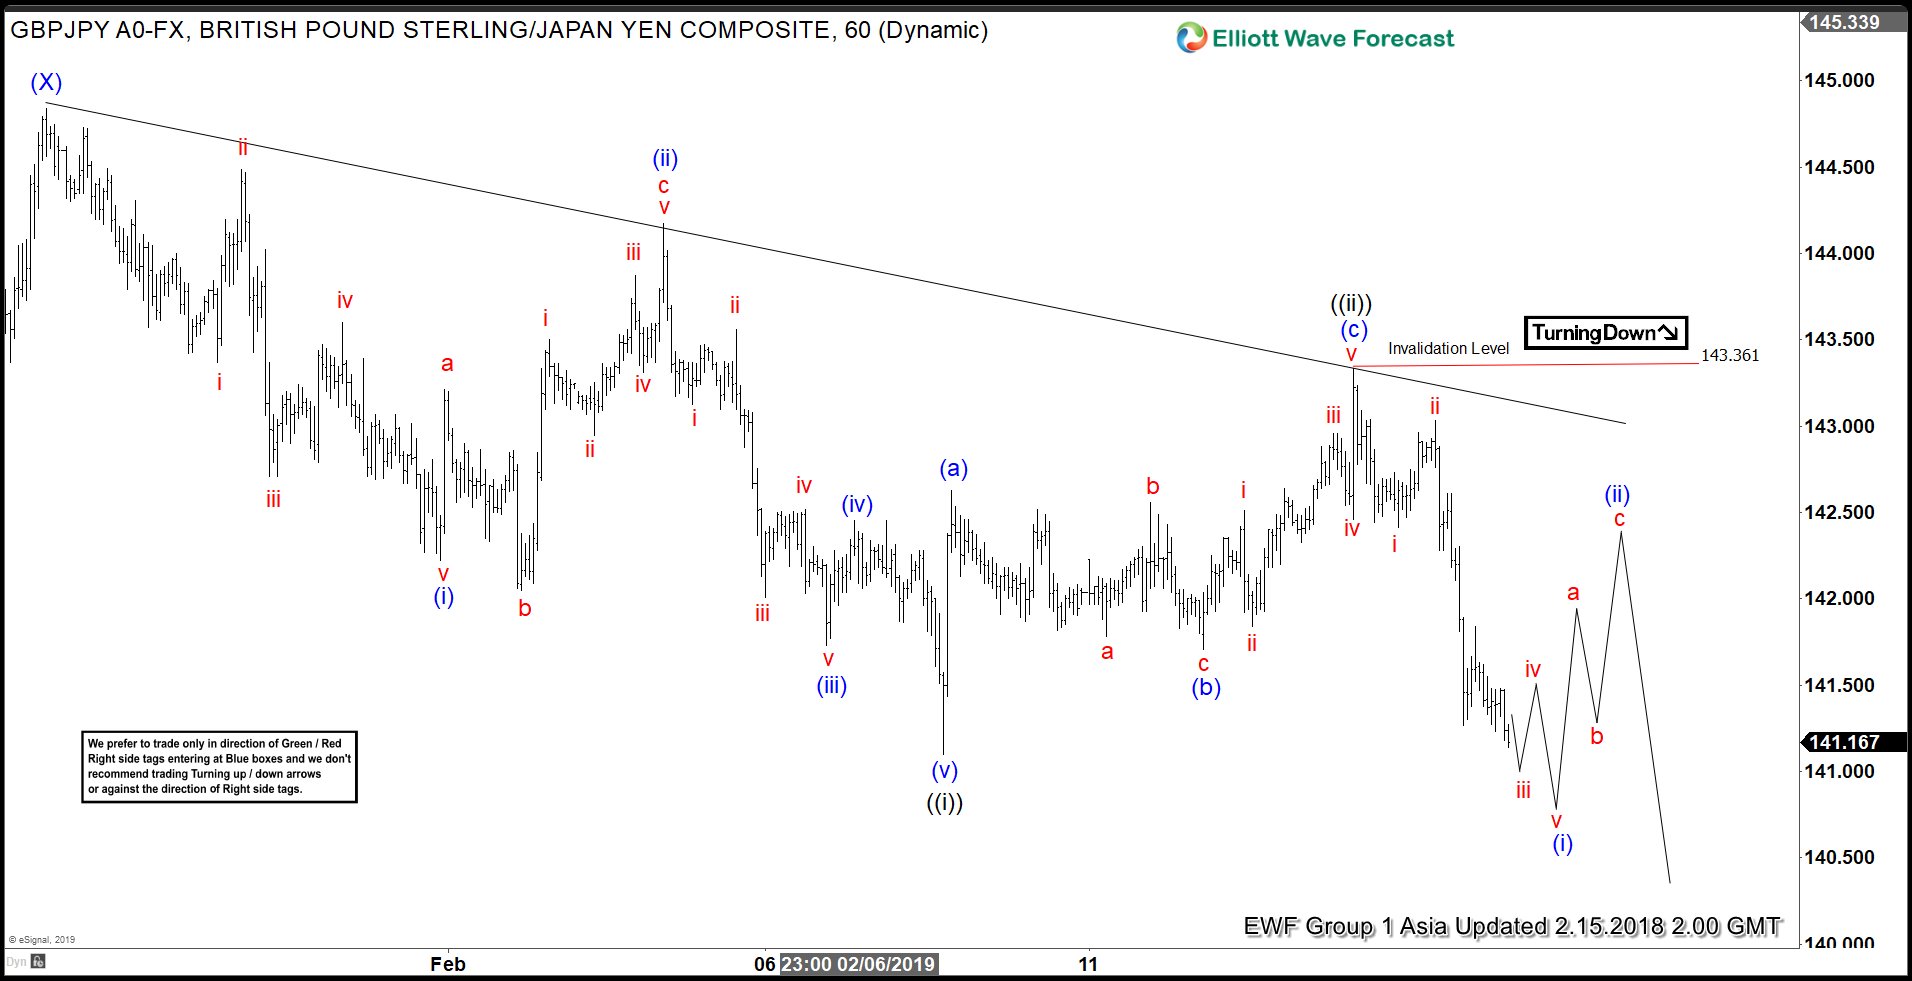
Read MoreThis article and video explains the short term path of GBPJPY. The pair shows a 5 swing sequence from Jan 26 high, favoring further downside. The article provides the level that should not be broken if the bearish view is going to play out.
-
USDPLN Buyers In Control as October High Breaks
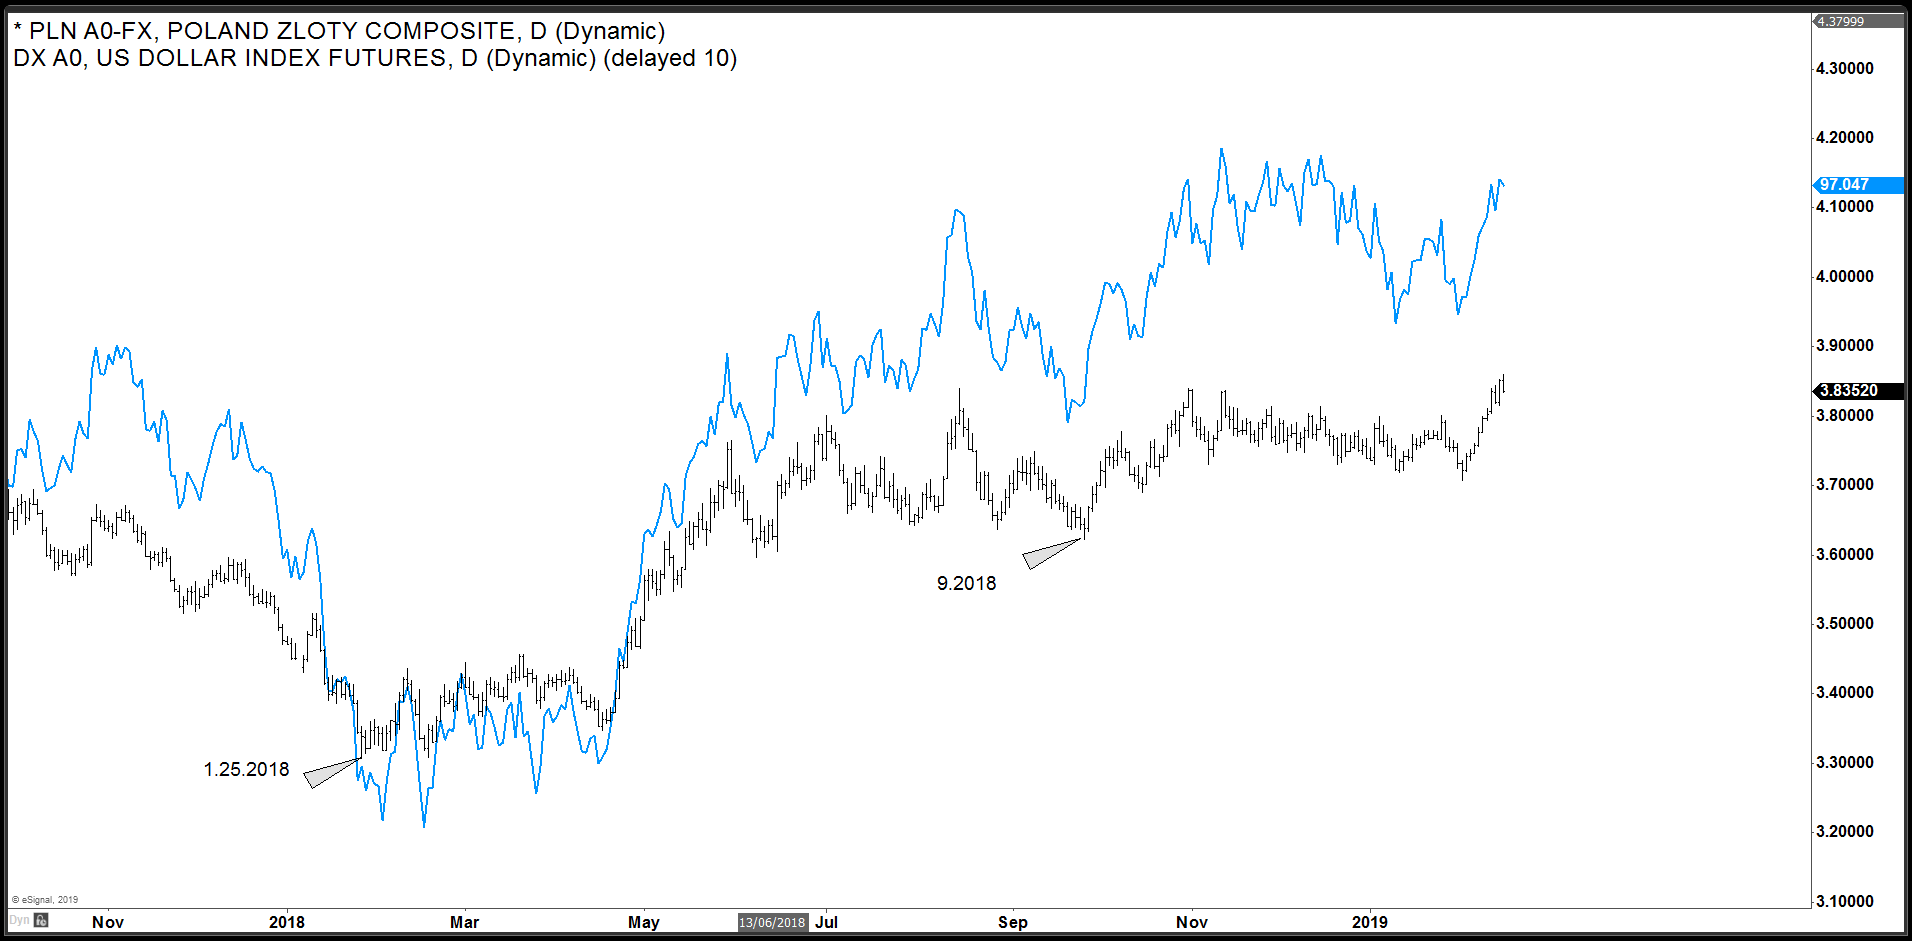
Read MoreUSDPLN has rallied strongly over the past 2 weeks which resulted in a break of October 2018 peak. In this blog, we will take a look at the mid-term and short-term Elliott wave structure of this Forex pair and what we can expect going forward. We have also overlaid DXY (US Dollar Index) chart with […]
-
Elliott Wave Analysis: More Downside Expected in EURGBP
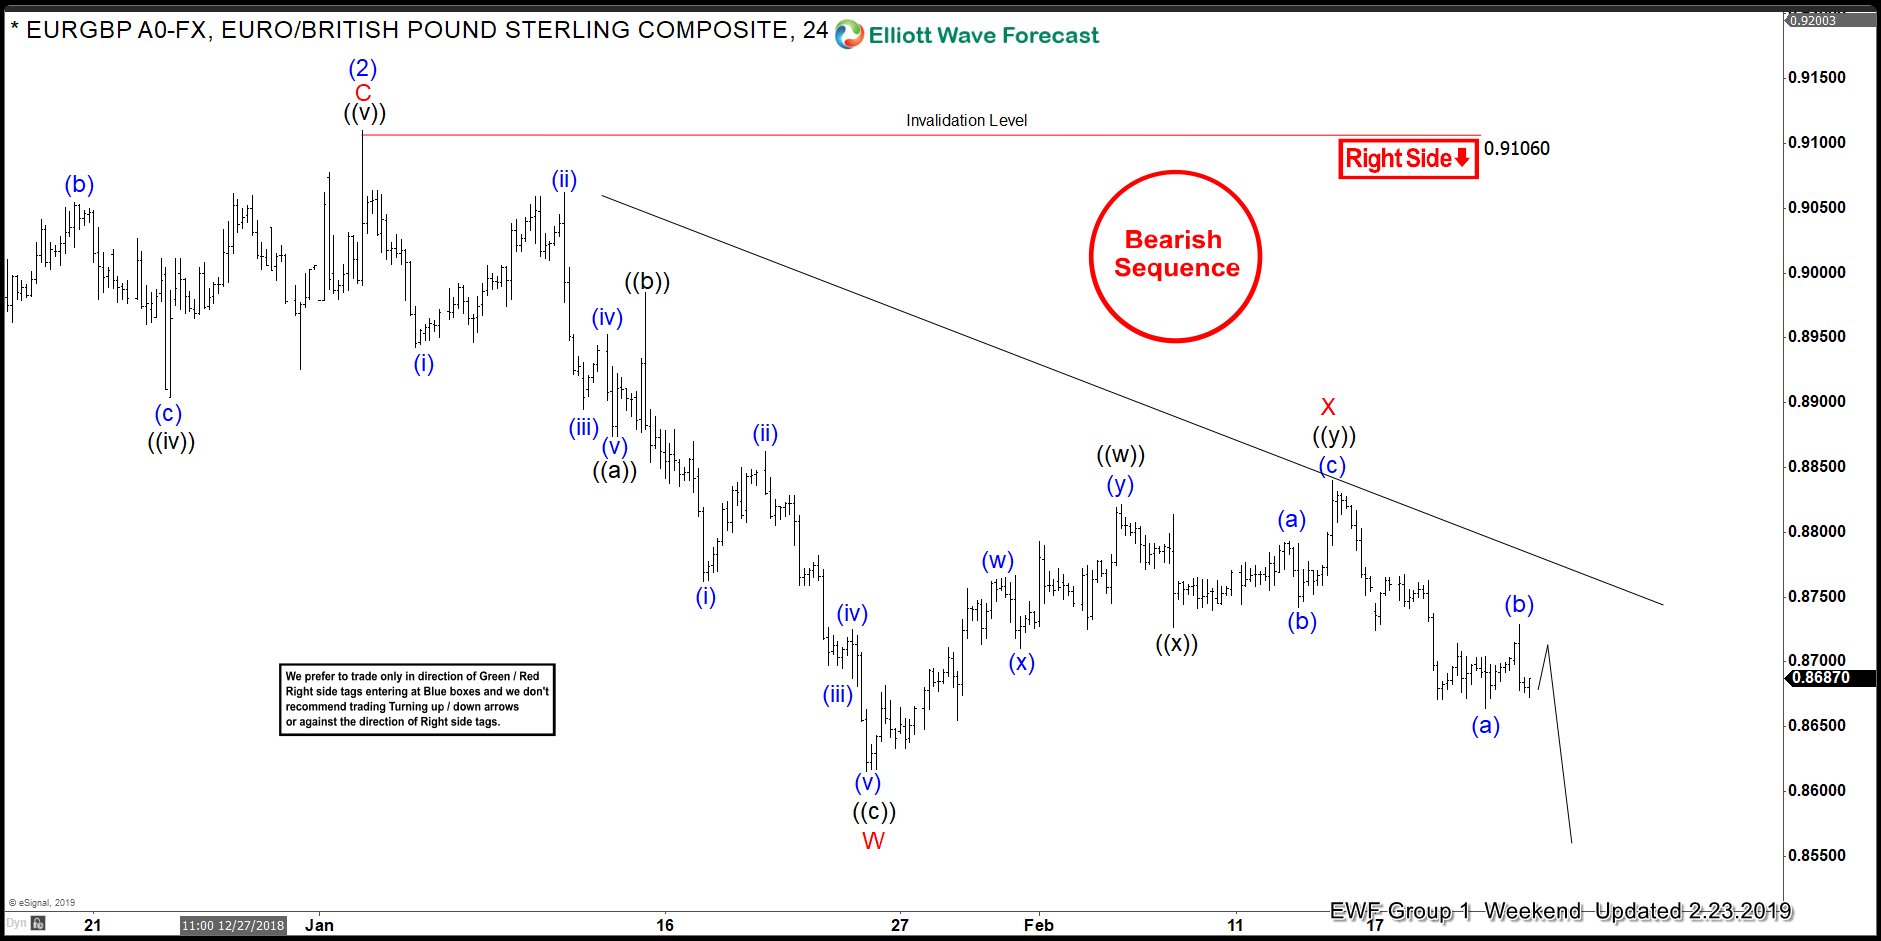
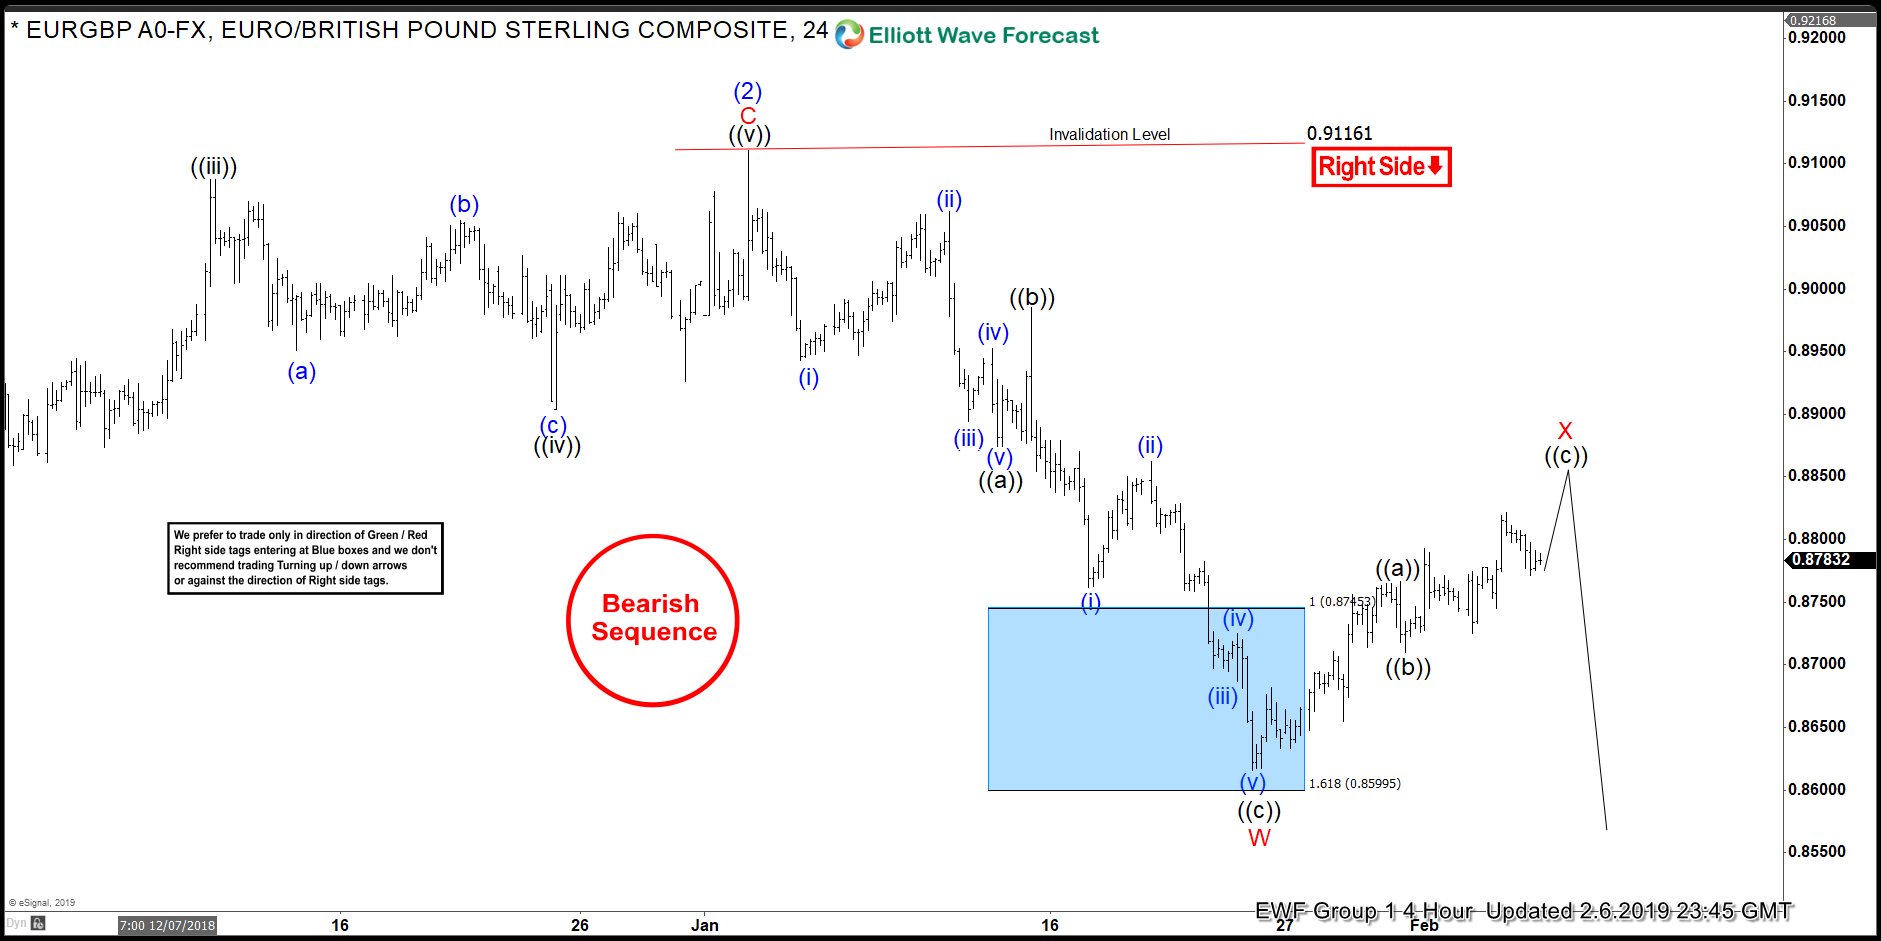
Read MoreHello fellow traders. I want to share with you some Elliott Wave charts of EURGBP which we presented to our members at Elliott Wave Forecast. You see the 4-hour updated chart presented to our clients on the 01/26/19 below EURGBP unfolded as an Elliott Wave Zig-Zag structure from 01/02/19 peak. Decline from there ended black wave ((a)) at 0.88768 and wave ((b)) […]
-
Elliott Wave View Favors More Downside in GBPUSD
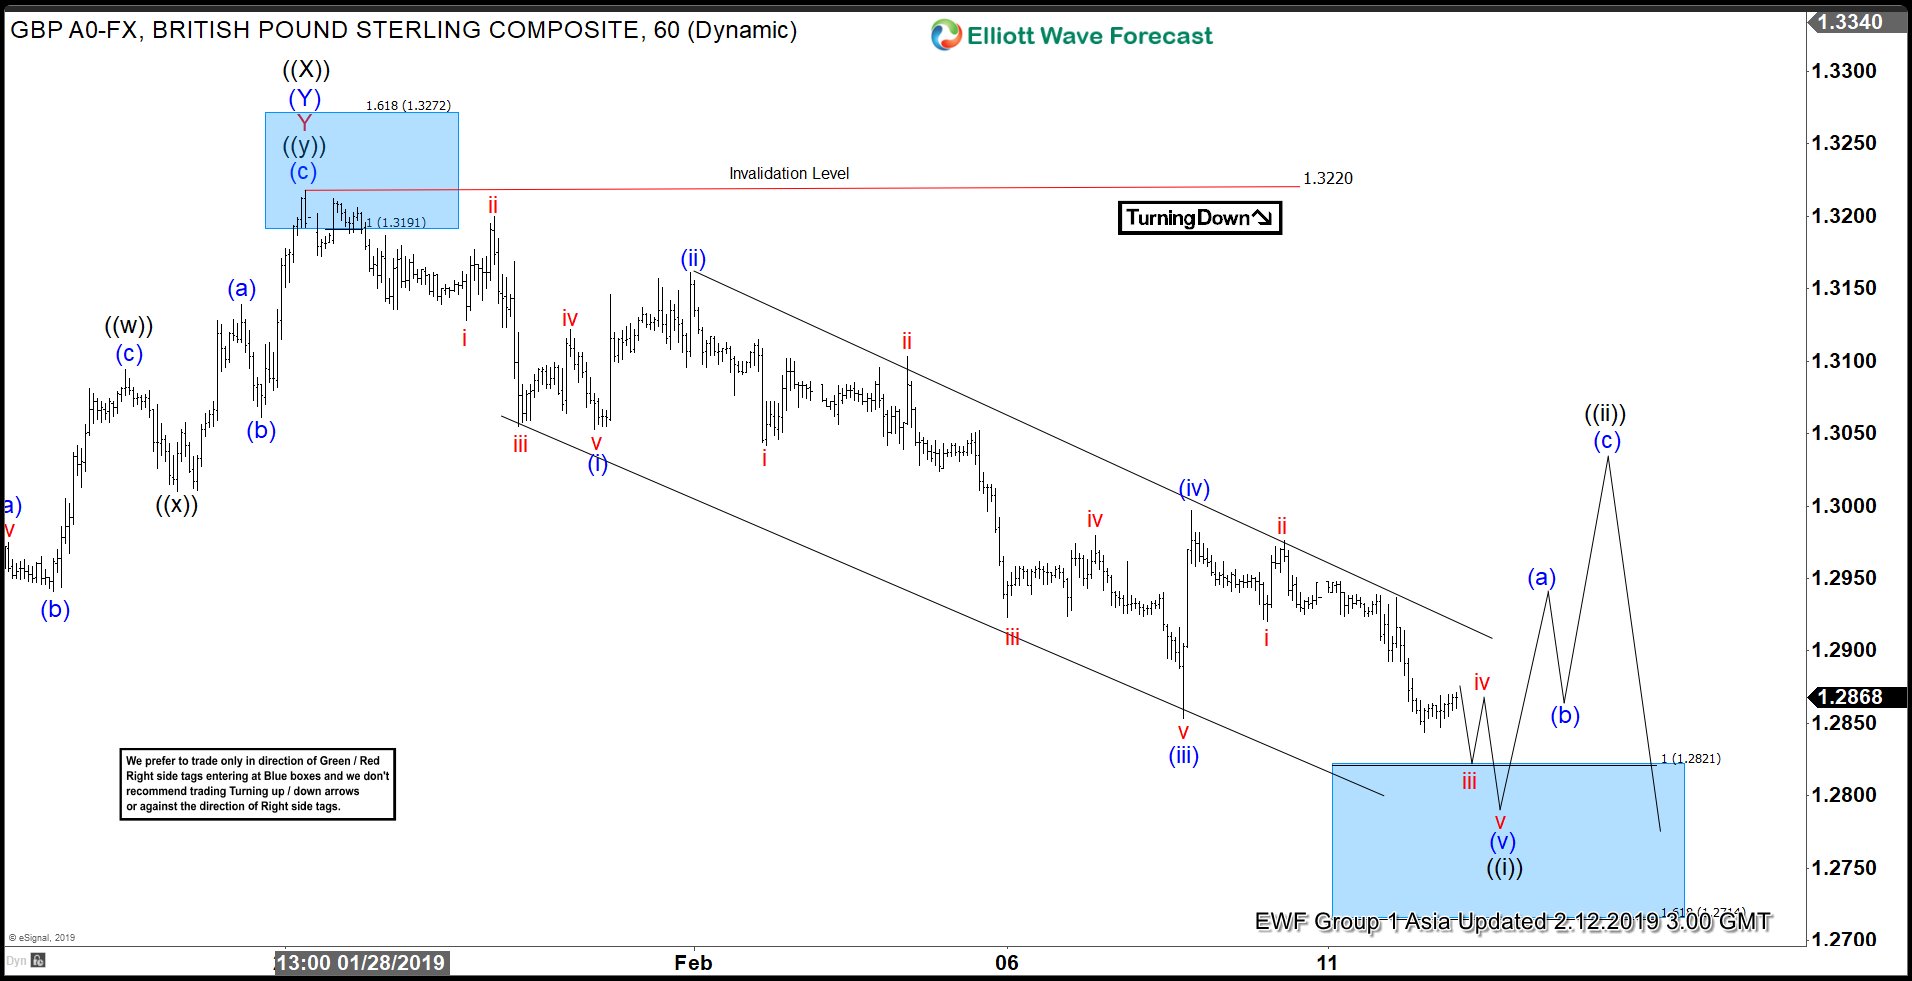
Read MoreThis article and video explains the short term path for GBPUSD. Pair is showing a 5 waves move from Jan 26, 2019 high which favors the downside.