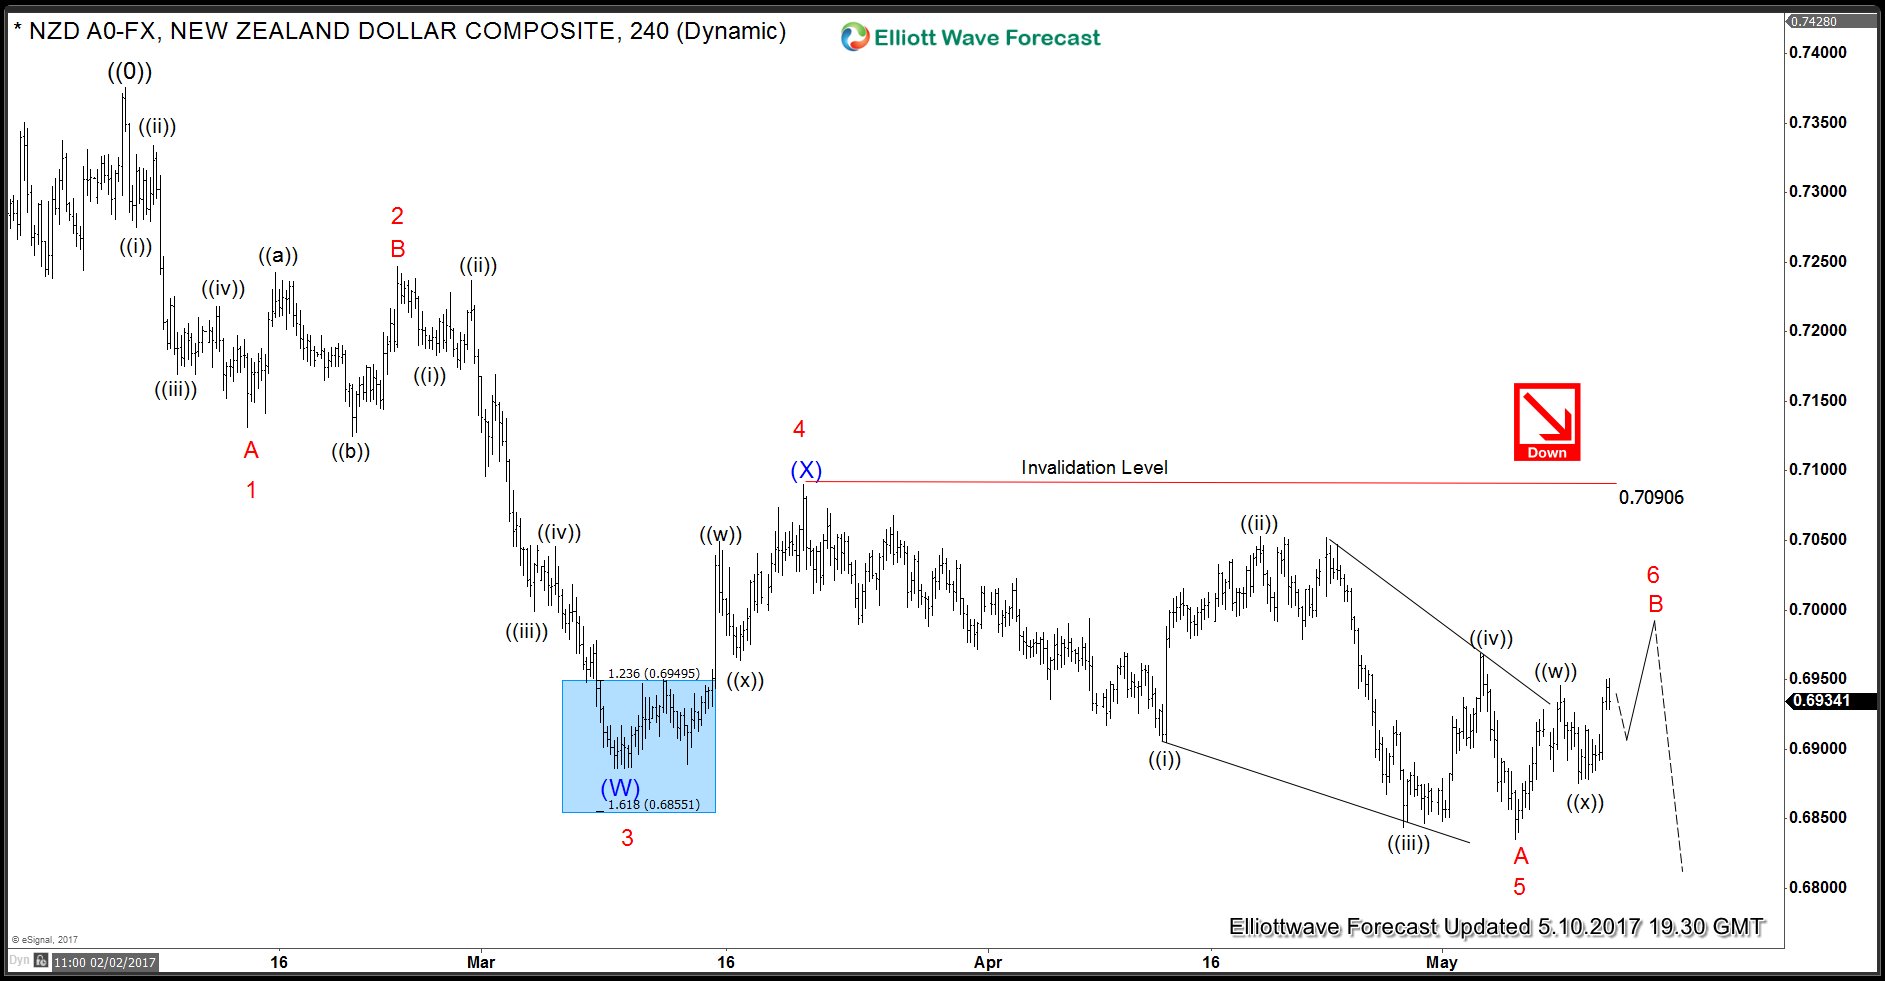
NZDUSD has been trading sideways for the last few days. In our previous blog, we mentioned that decline from 2.6.2017 peak was in 5 swings and hence pair had an incomplete Elliott wave sequence from there. Pair has since made a new low and recovered but that new low doesn’t count as the 7th swing because the new low came after a rather shallow bounce. In today’s blog we will revisit the swing sequence from February peak and take a look at the short-term structure.
NZDUSD Diagonal wave A
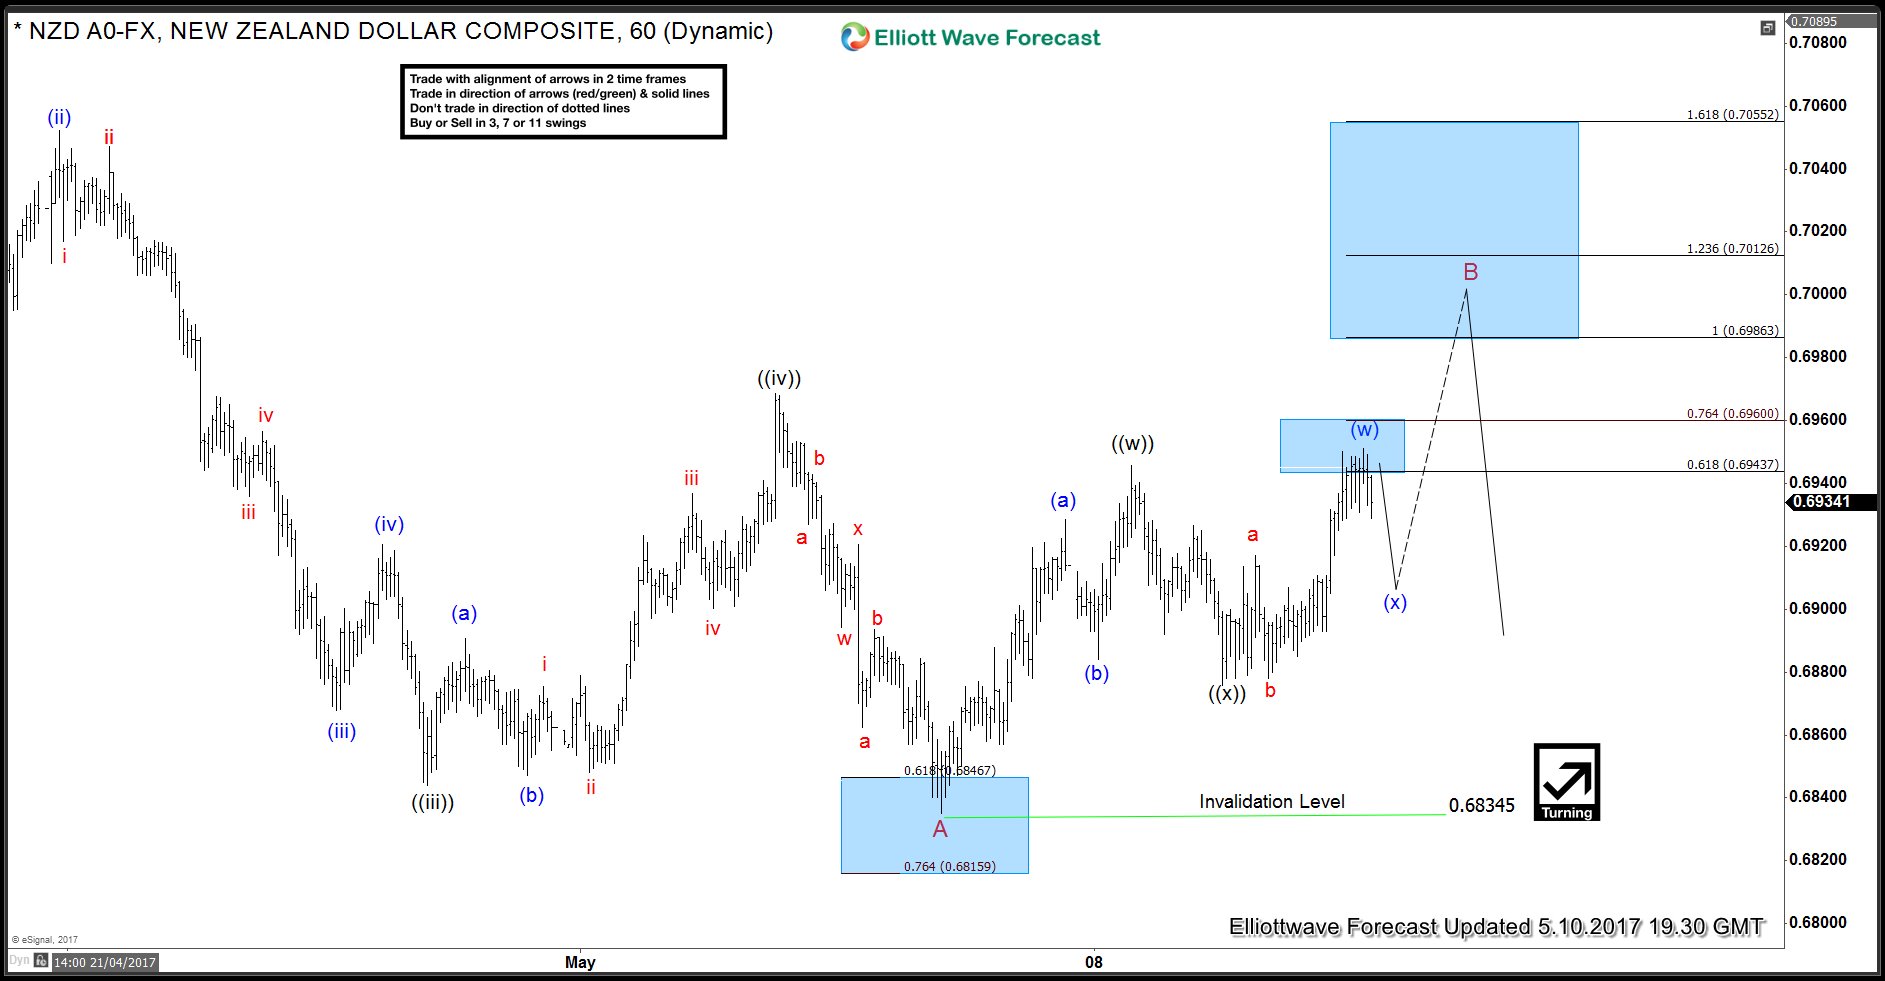
New low to 0.6834 was a marginal new low and could be viewed as part of a leading diagonal wave A down from 0.7090 peak. Pair is proposed to be still correcting the decline from 0.7090 high which is expected to take the form of a double three structure ((w))-((x))-((y)) structure. While above 0.6875 low, pair should ideally extend higher towards 0.6986 – 0.7012 area to complete wave B before it turns lower to resume the decline in wave C. Price should remain below 0.7090 high for this view to remain valid.
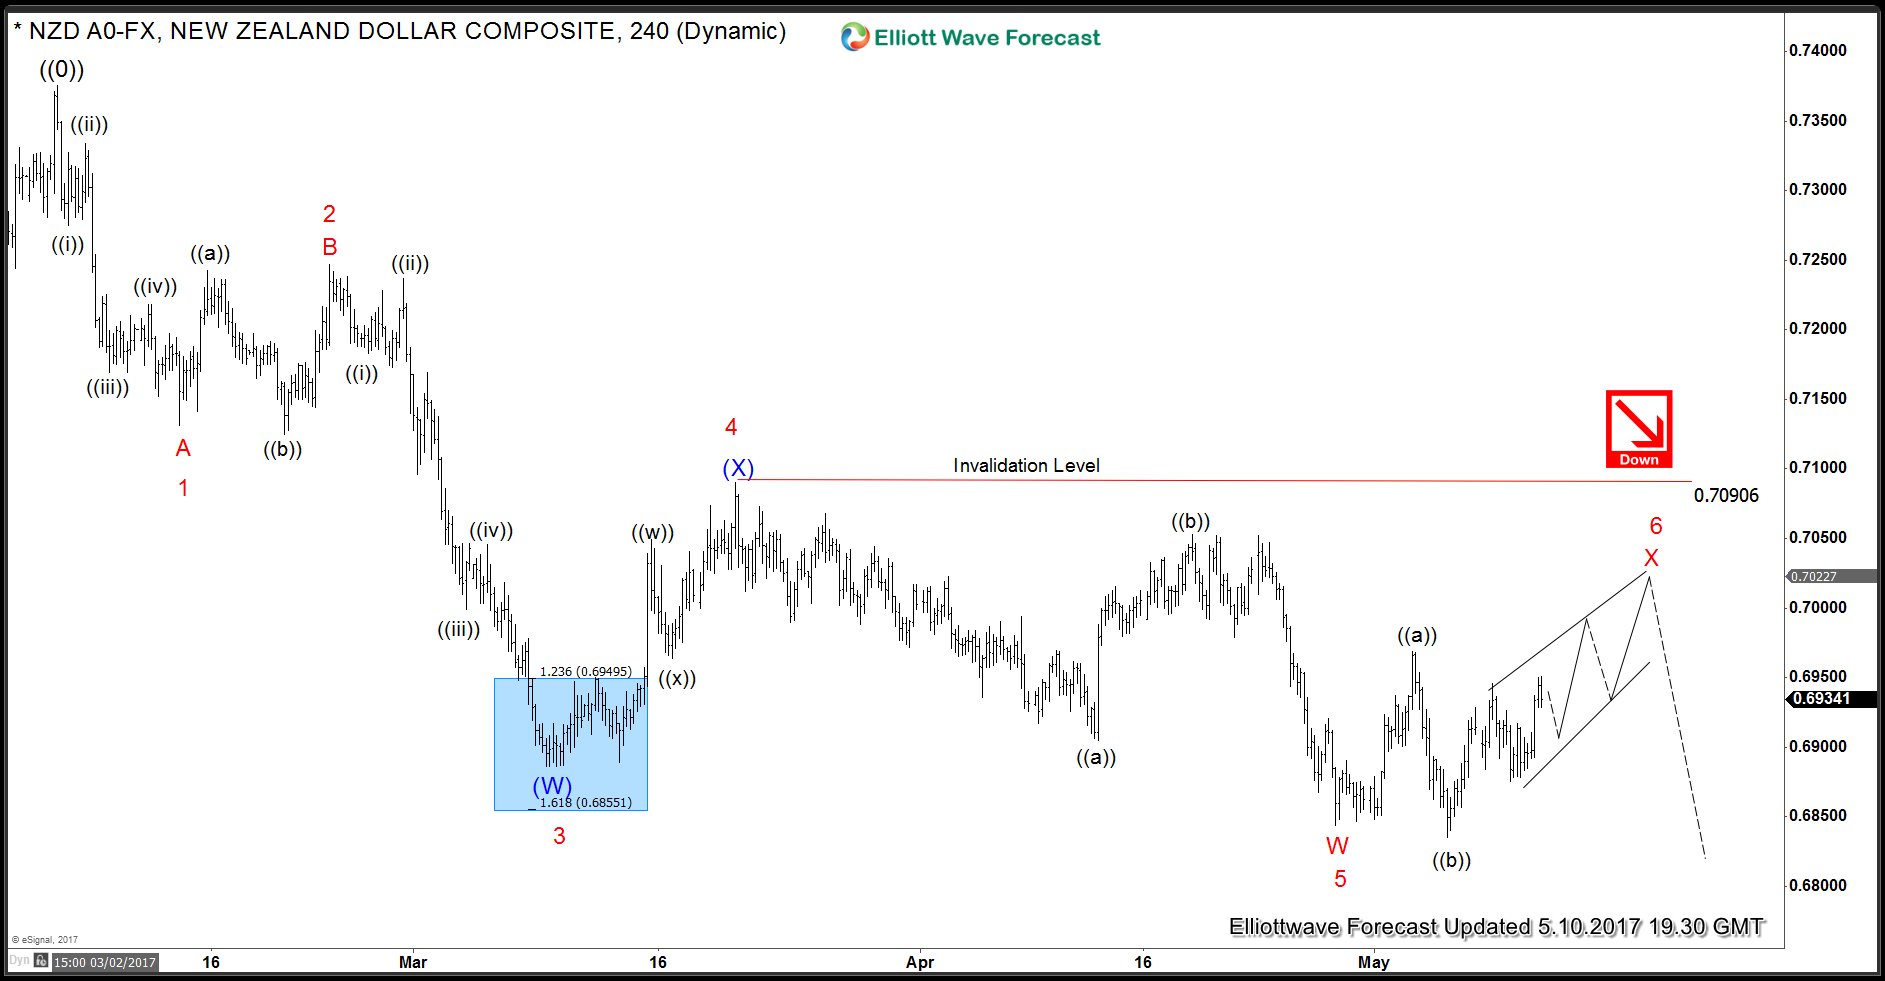
NZDUSD FLAT wave X
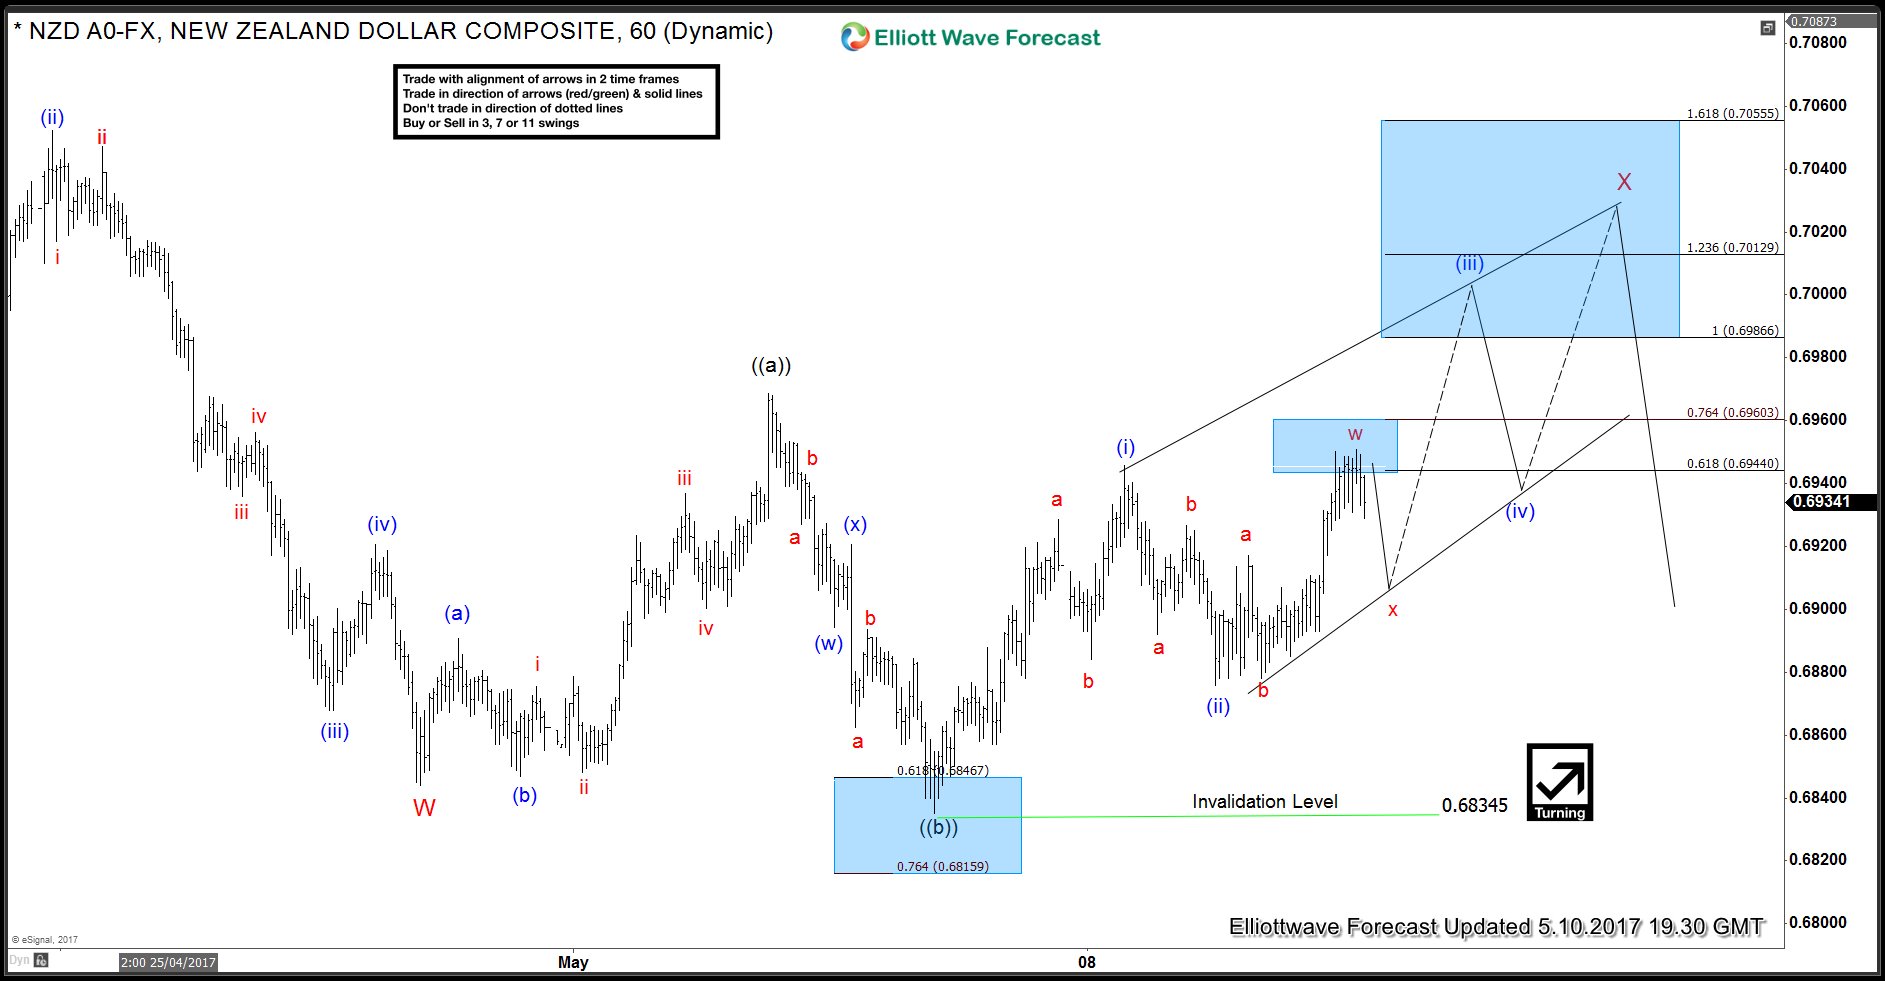
As the new low was marginal so another way to look at recent price action and new low to 0.6834 is an irregular (FLAT) correction. This would suggest drop from 0.7090 to 0.6844 was a 3 wave move and since then pair has been working on a FLAT correction. Move up from 0.6844 to 0.6945 was wave ((a)), dip to 0.6834 was wave ((b)) and wave ((c)) of the FLAT is now in progress. If price reaches 0.6986 – 0.7012 area, pulls back in 3 waves and then makes another push higher, that would make it 11 swings up from 0.6834 low and support the FLAT view. In either case, 0.7090 high should remain intact for the current bounce to be a 6th swing. If pivot at 0.7090 high breaks, that would suggest pair is doing a FLAT in blue wave (X), the 4th swing. and still could see extension lower as far as pivot at 2.6.2017 high remained intact.
Back


