
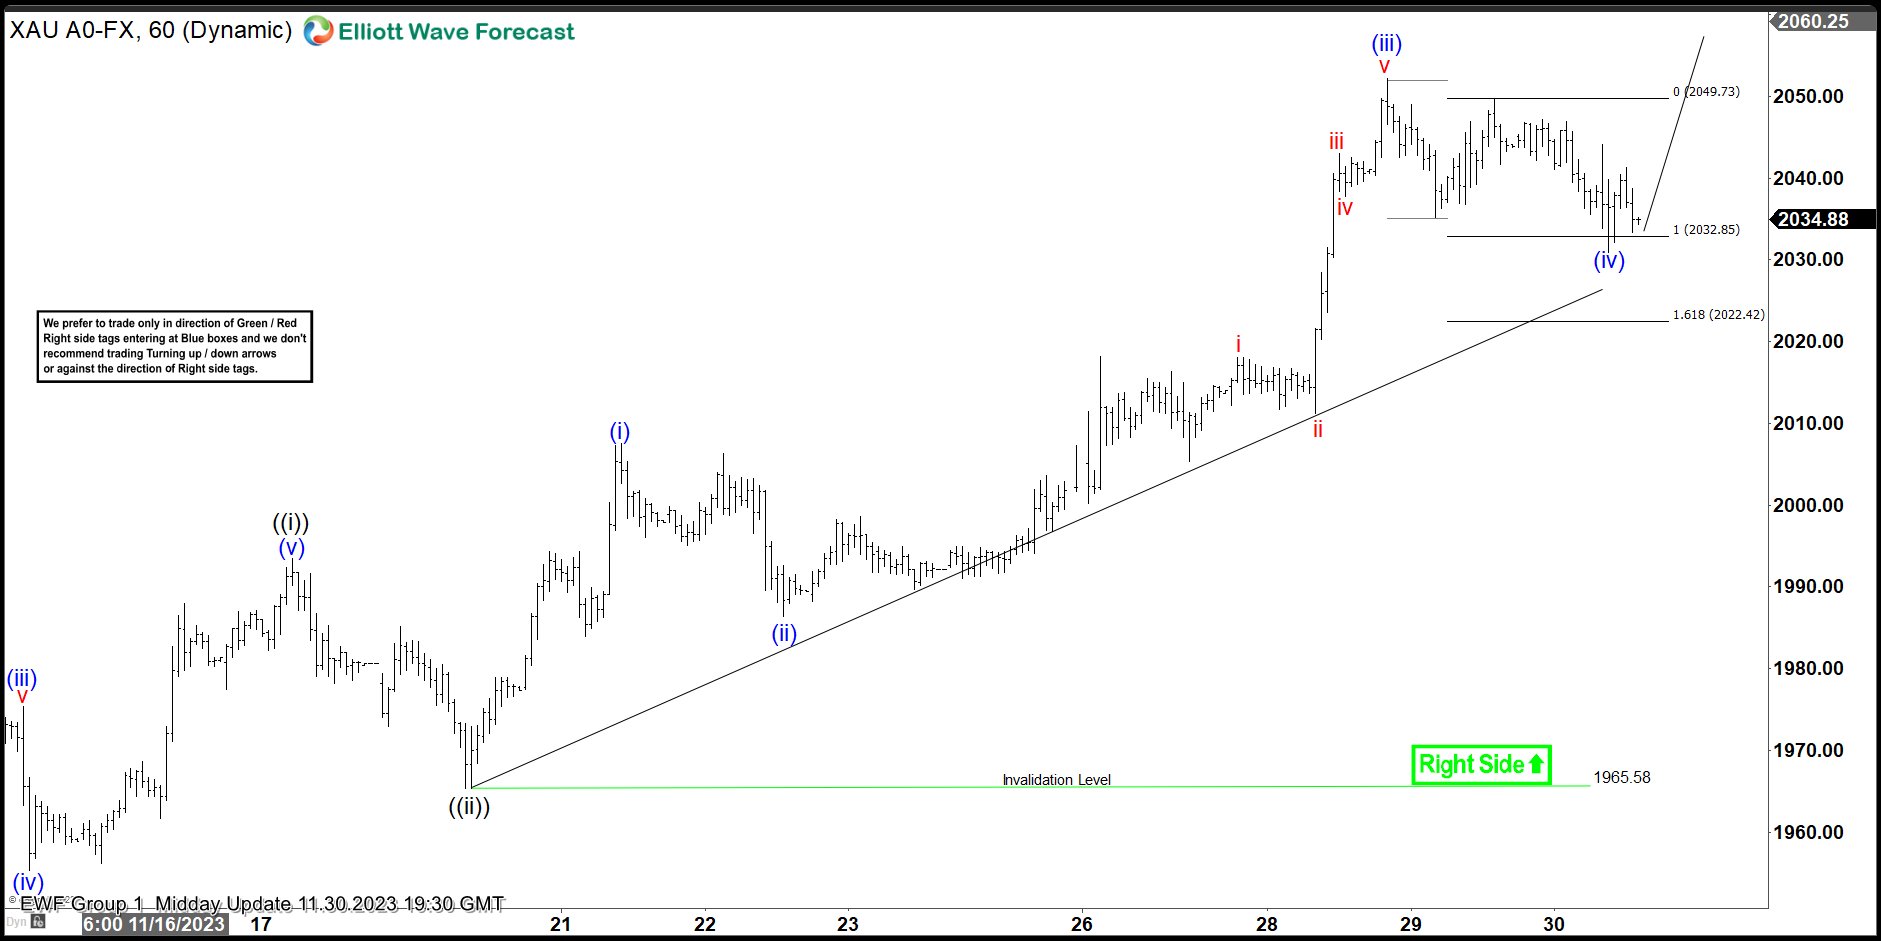
Last year, our live trading room provides 69% return annually across the 3 groups that we cover. In Live Trading Room, we scan the market everyday to find any tradable setup. We believe every serious traders need to have a good trading system with specific rules. A complete system must include the following: 1. Conditions […]
-
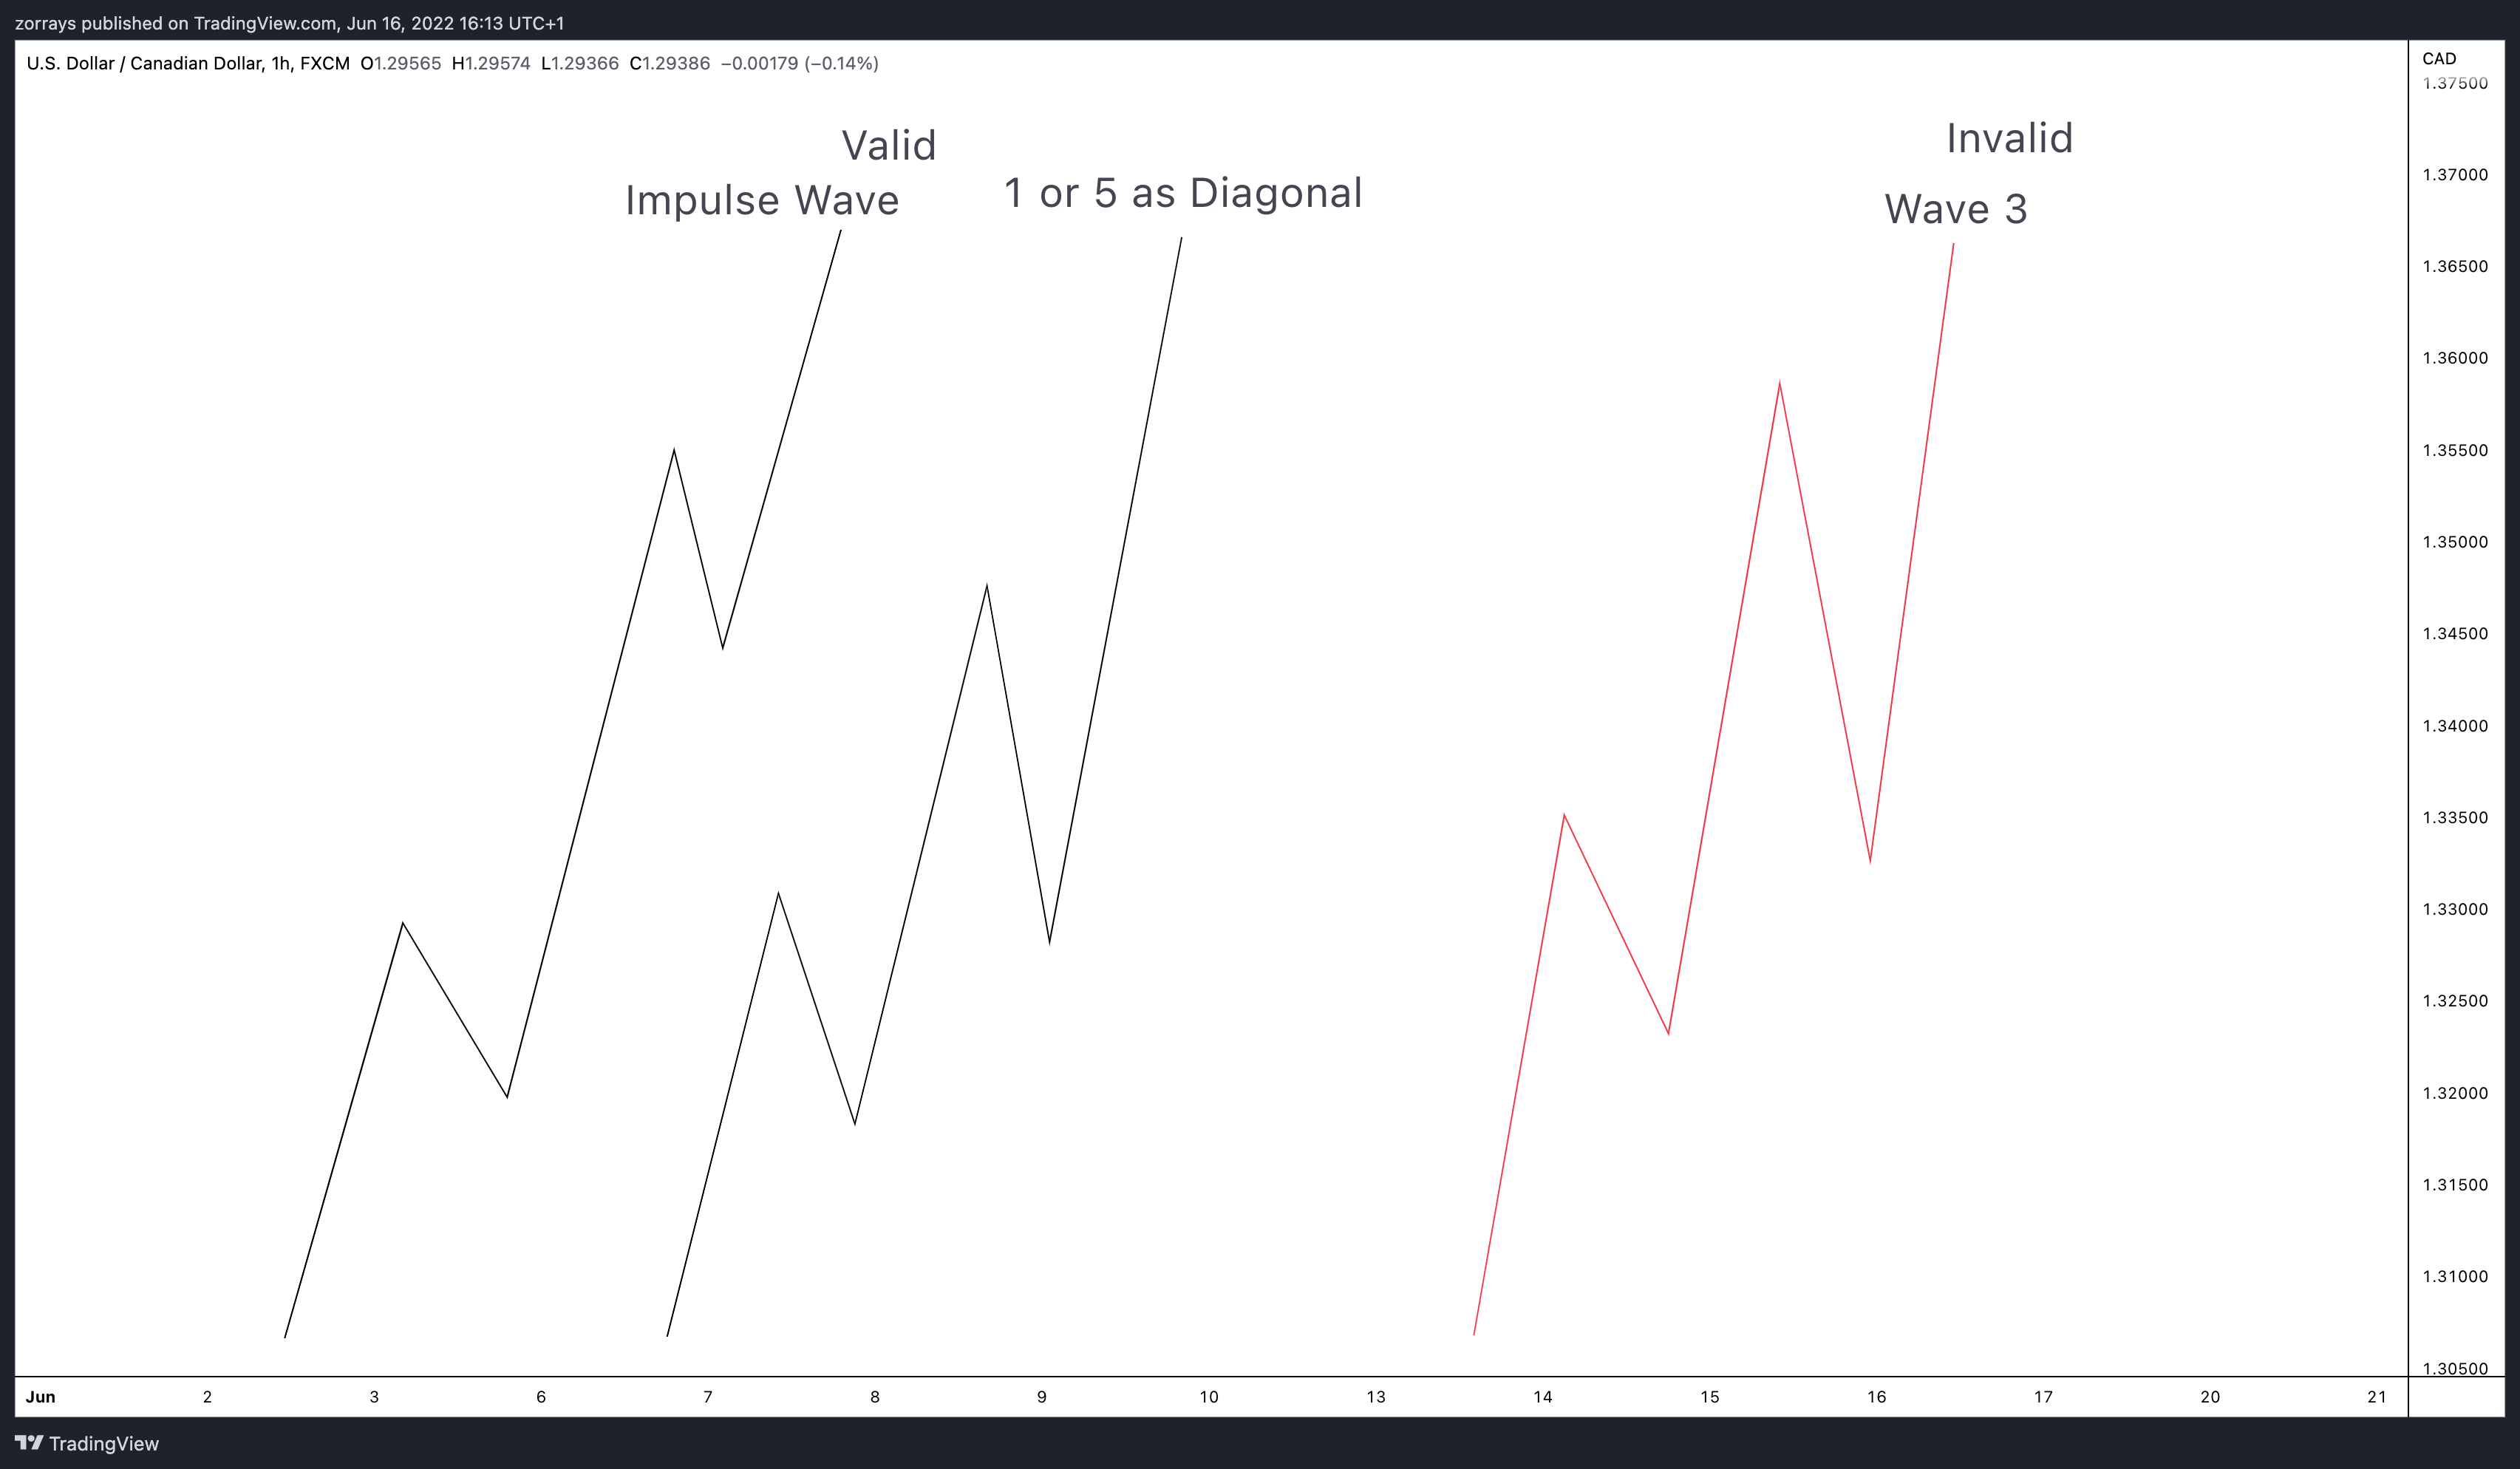
Never break these 3 rules to be a successful Elliott Wave Trader
Read MoreIn today’s blog, I want to take things back to basic when it comes to trading the Elliott Wave Theory – “theory”. There are 3 rules that you must follow to be a good trader. Within the theory, we have rules and guidelines. Guidelines are based on characteristics of the waves, Fibonnaci guidelines in terms […]
-
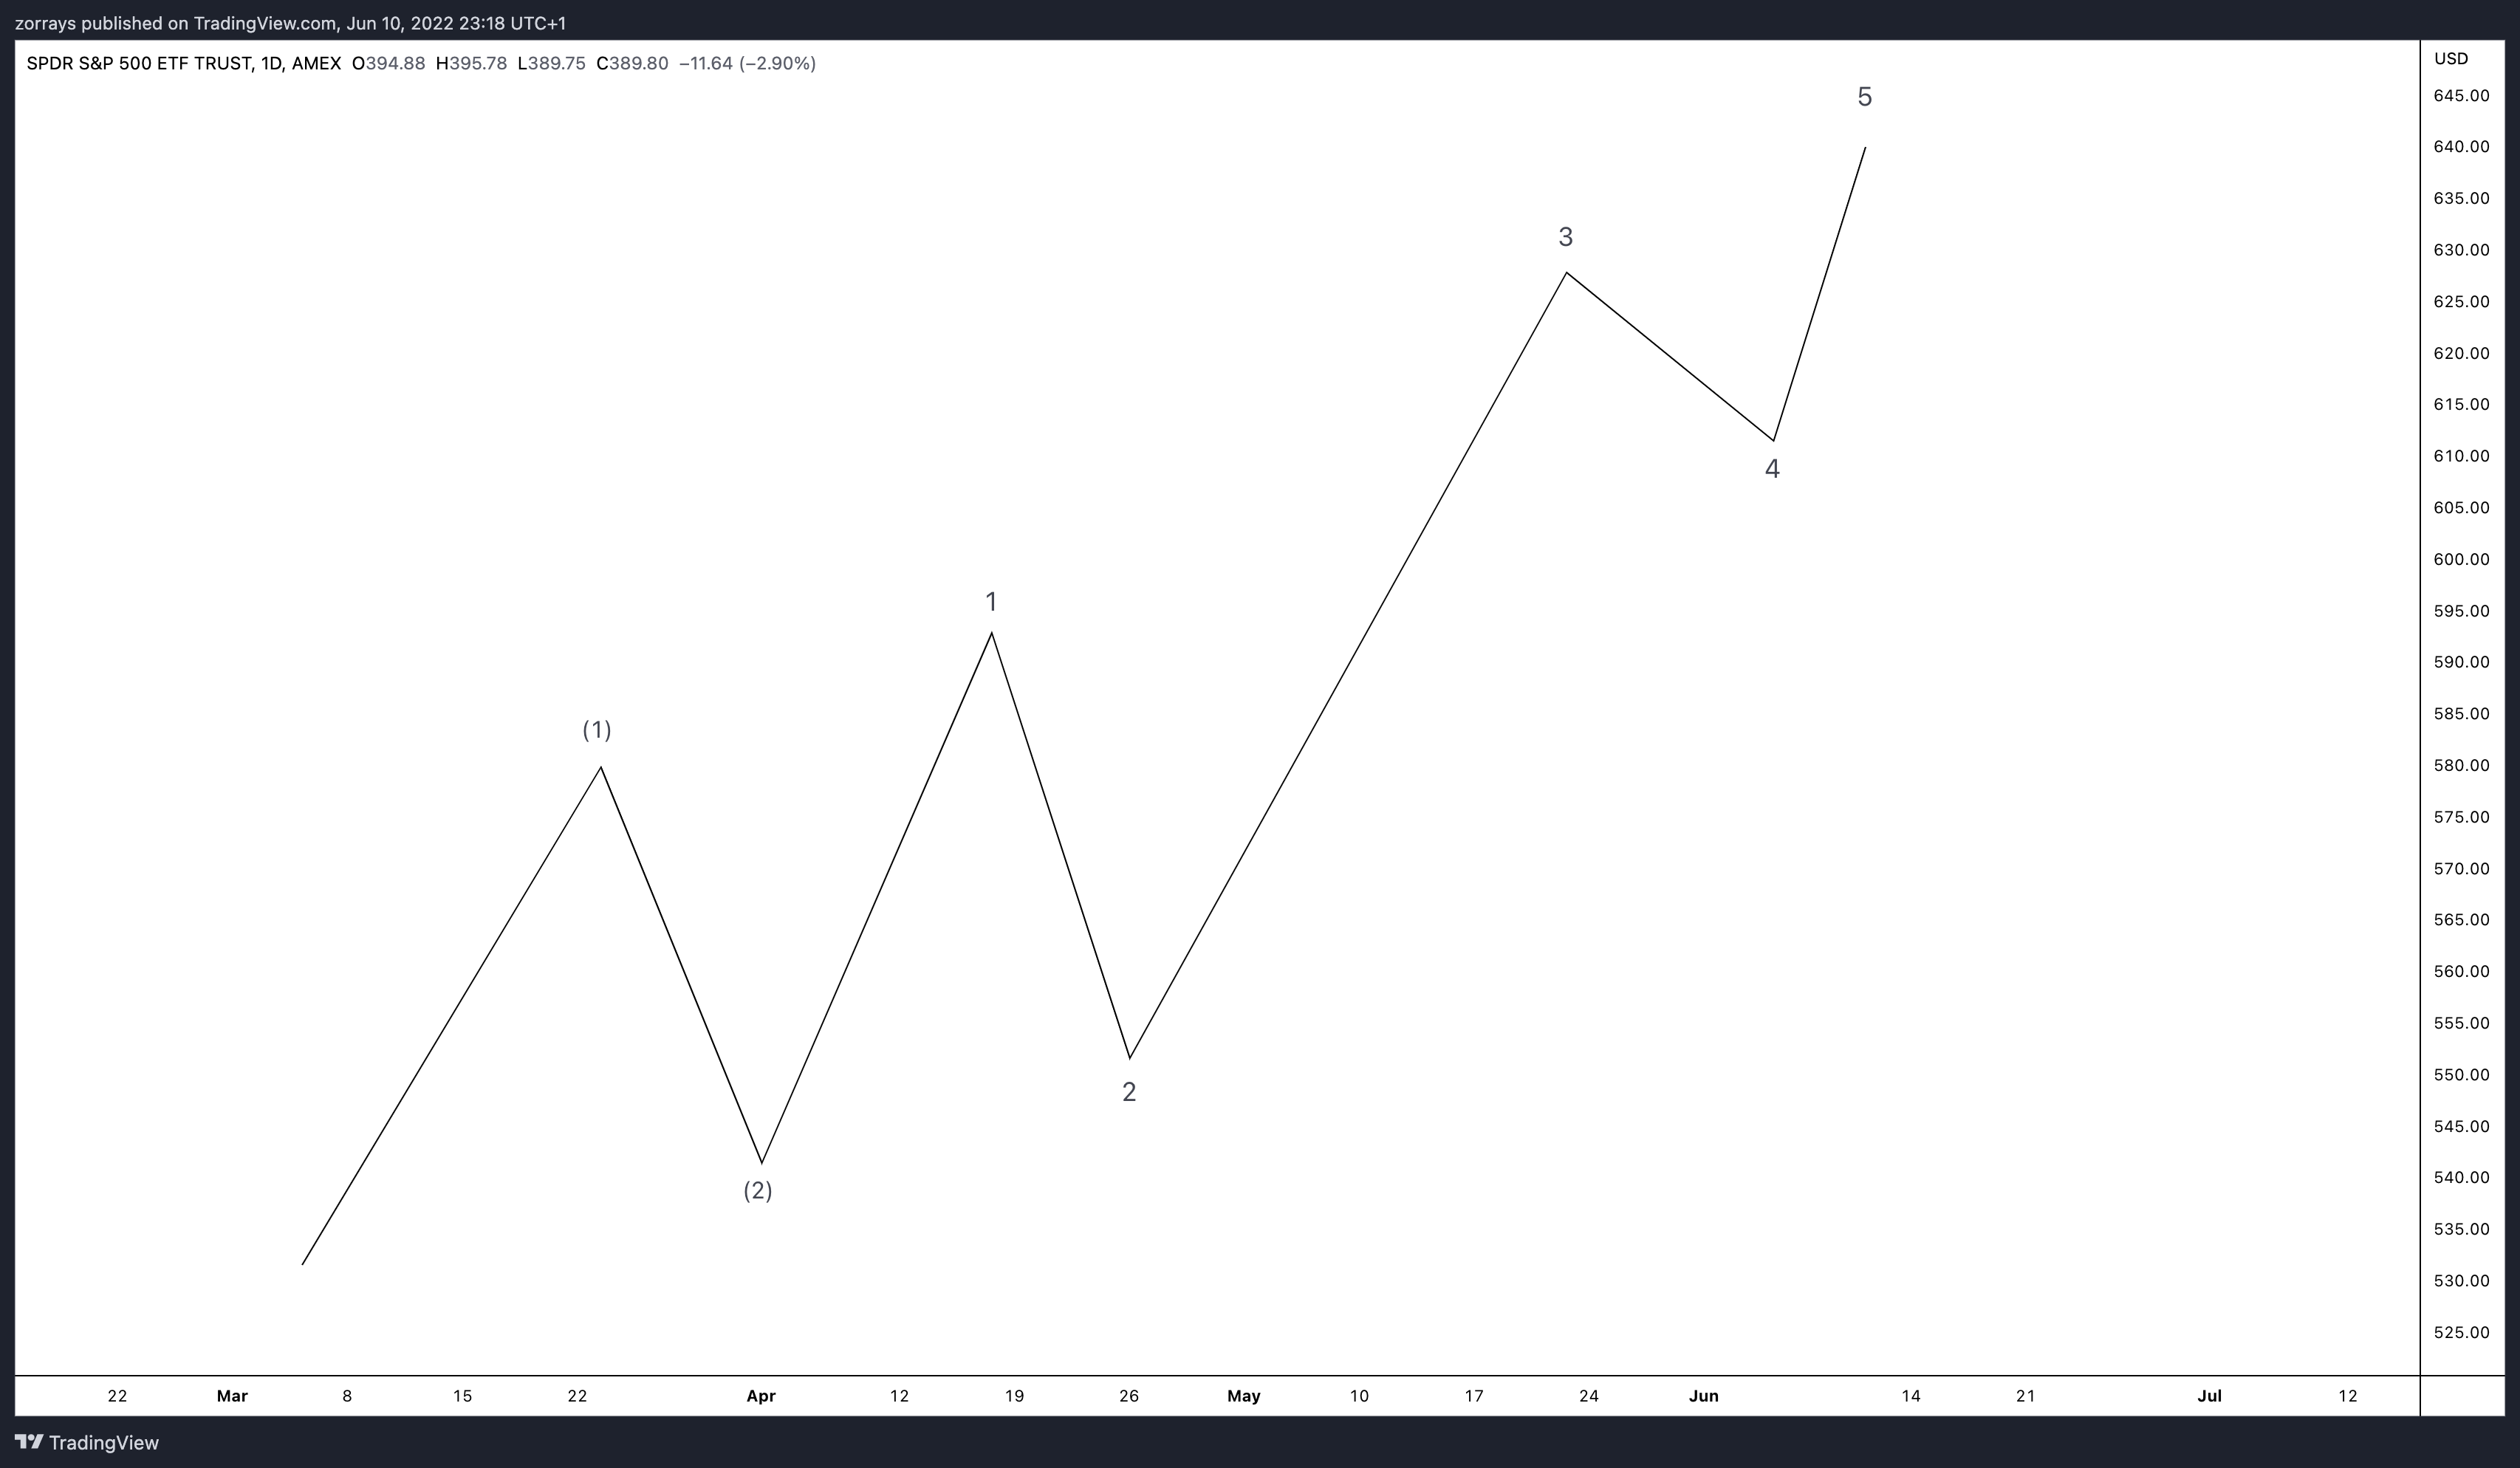
Why do wave counts change? Part 2
Read MoreSo, in my previous blog I mentioned the reasons why wave counts must change and be adjusted. Most of it is to do with the fact that rules are violated. Let’s go into a bit more detail on why else they may change and potentially trick you if you’re on top of the count. When […]
-
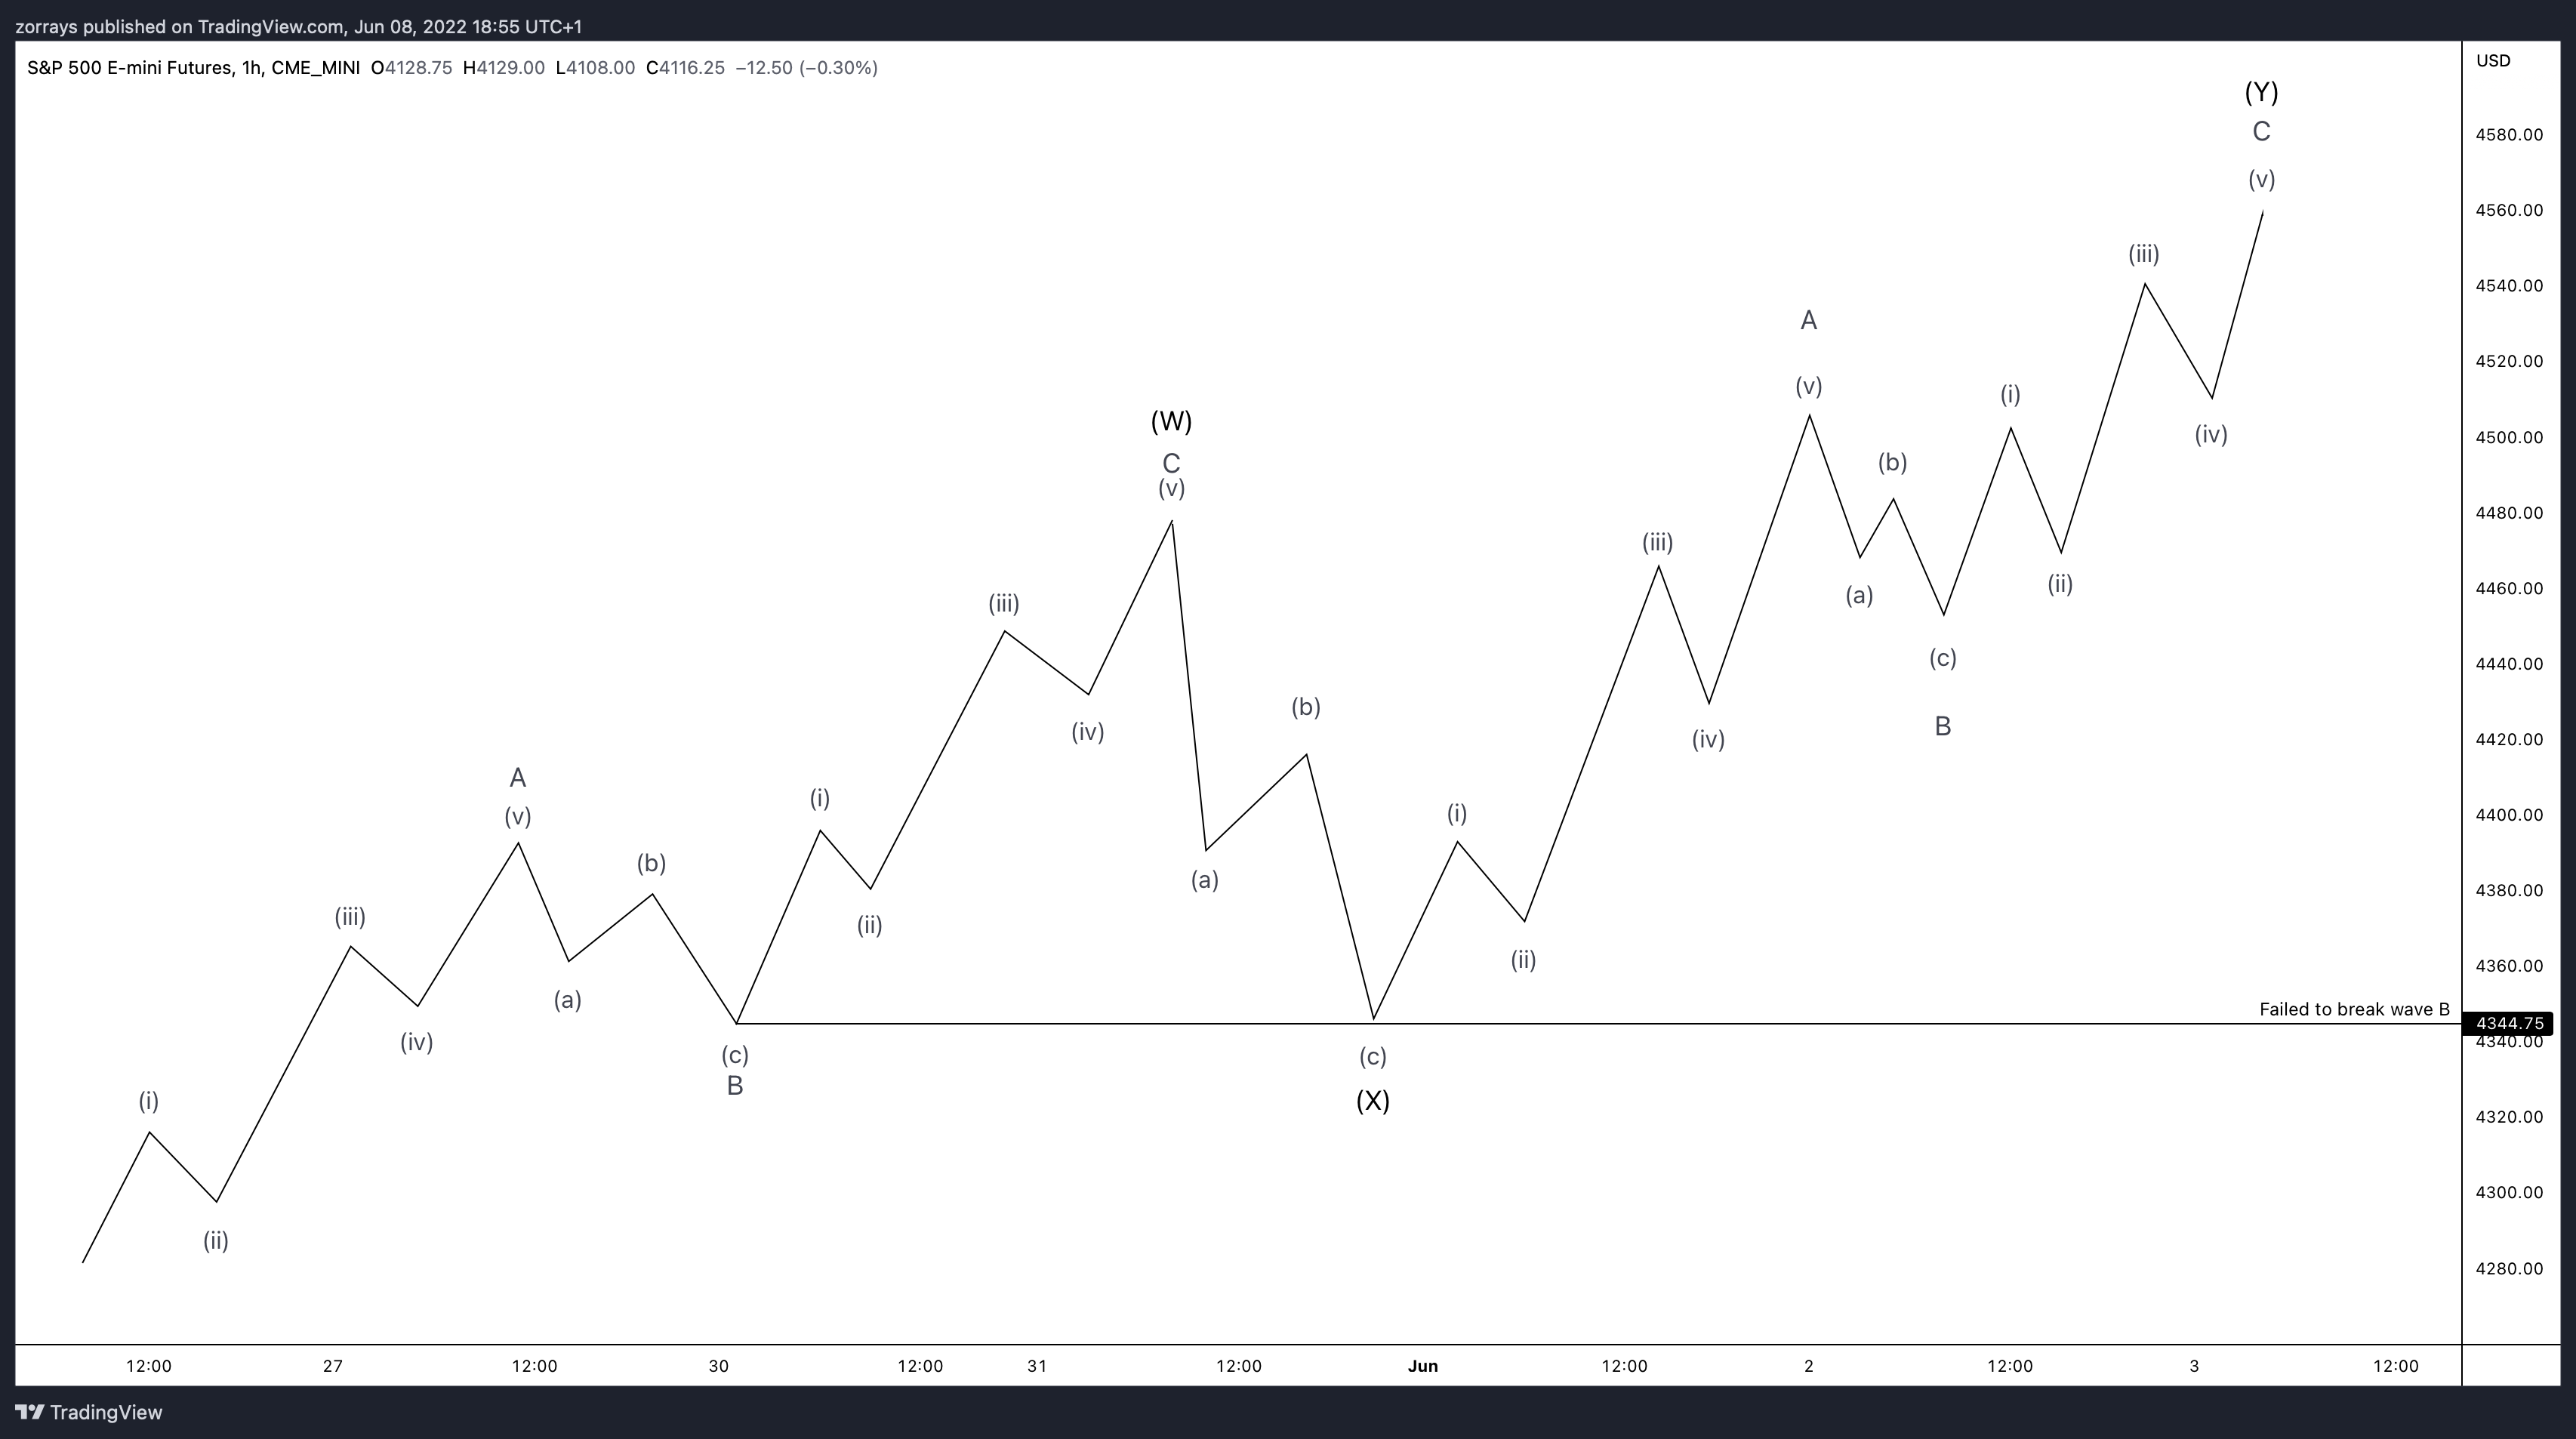
Why do wave counts change? Is it a good thing or detrimental to your trading?
Read MoreWe get asked a lot from novice Elliott Wave traders on why our counts change as the market progresses. One day we may have a bullish count, the next day it is bearish. We could be calling a corrective pattern a Zig-Zag, then a Double Correction and then next thing you know it turned into […]
-
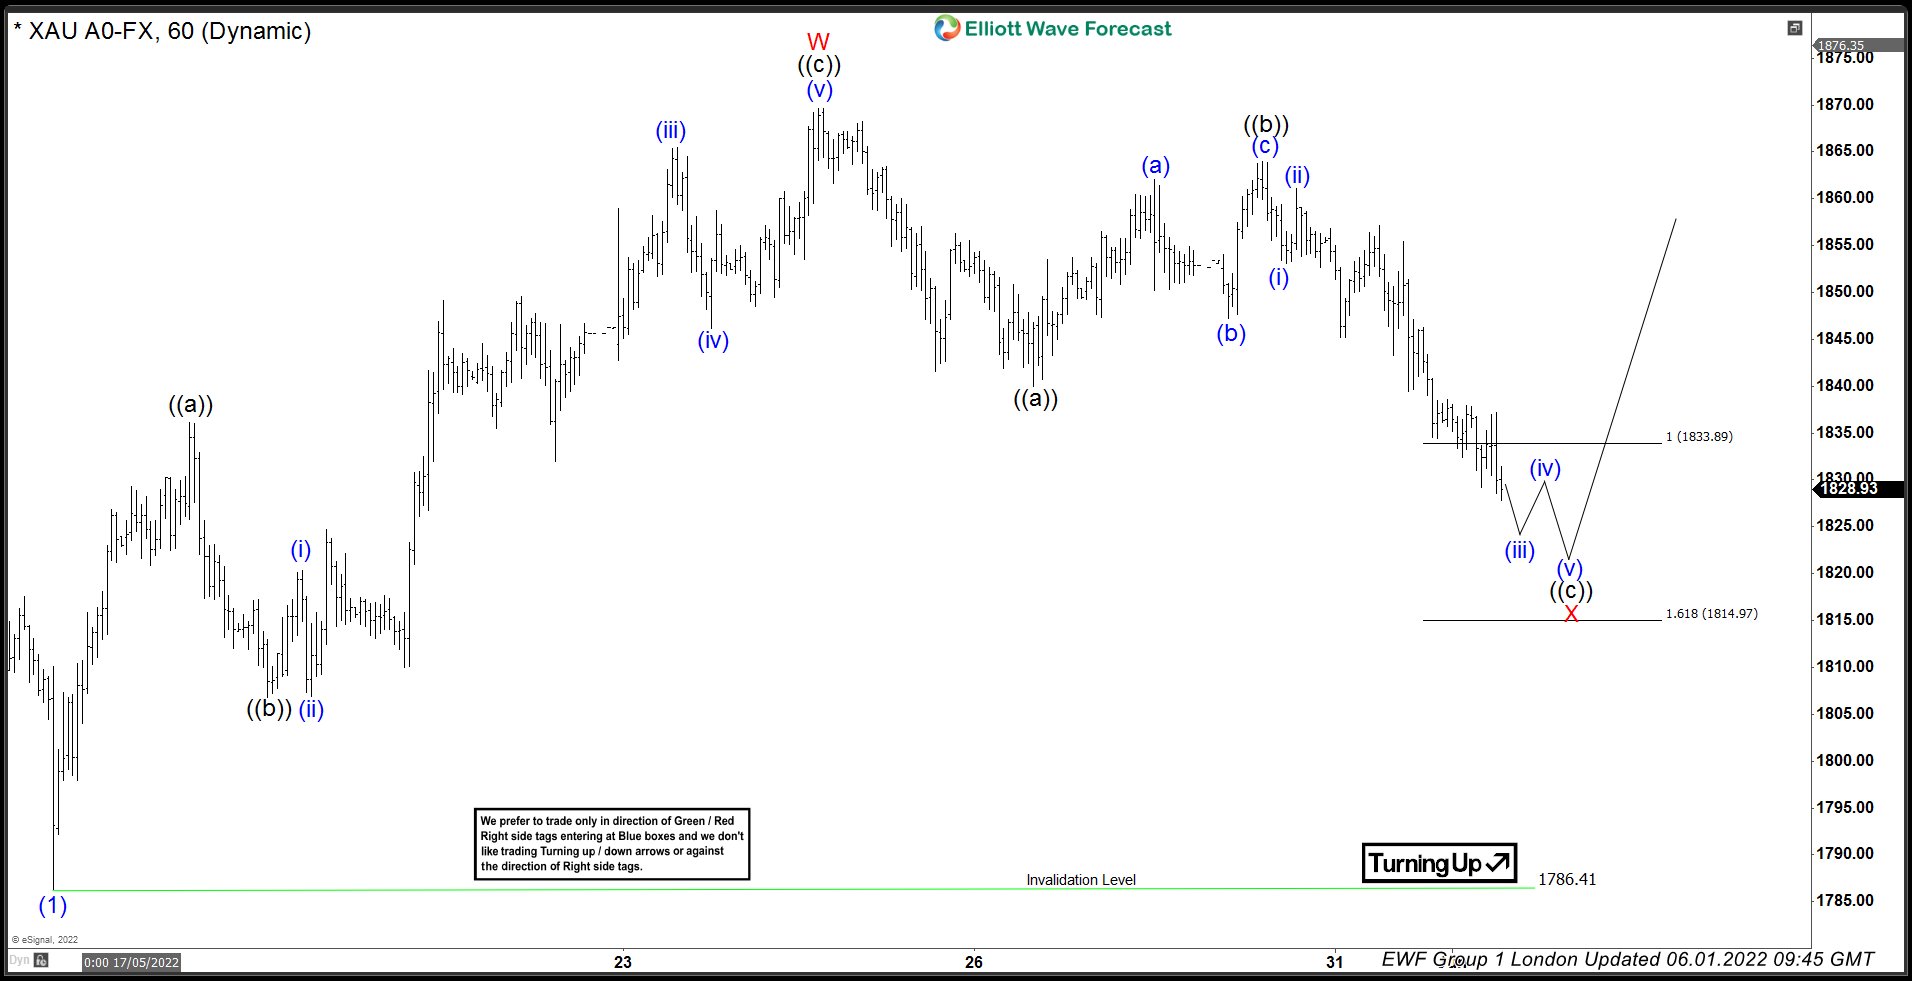
GOLD ( $XAUUSD) Forecasting The Rally After Elliott Wave Zig Zag Pattern
Read MoreHello fellow traders. In this technical blog we’re going to take a quick look at the Elliott Wave charts of GOLD, published in members area of the website. As our members know, GOLD is giving us correction of the cycle from the 2069 high. Recently GOLD ( $XAUUSD ) made a pull back that has […]
-
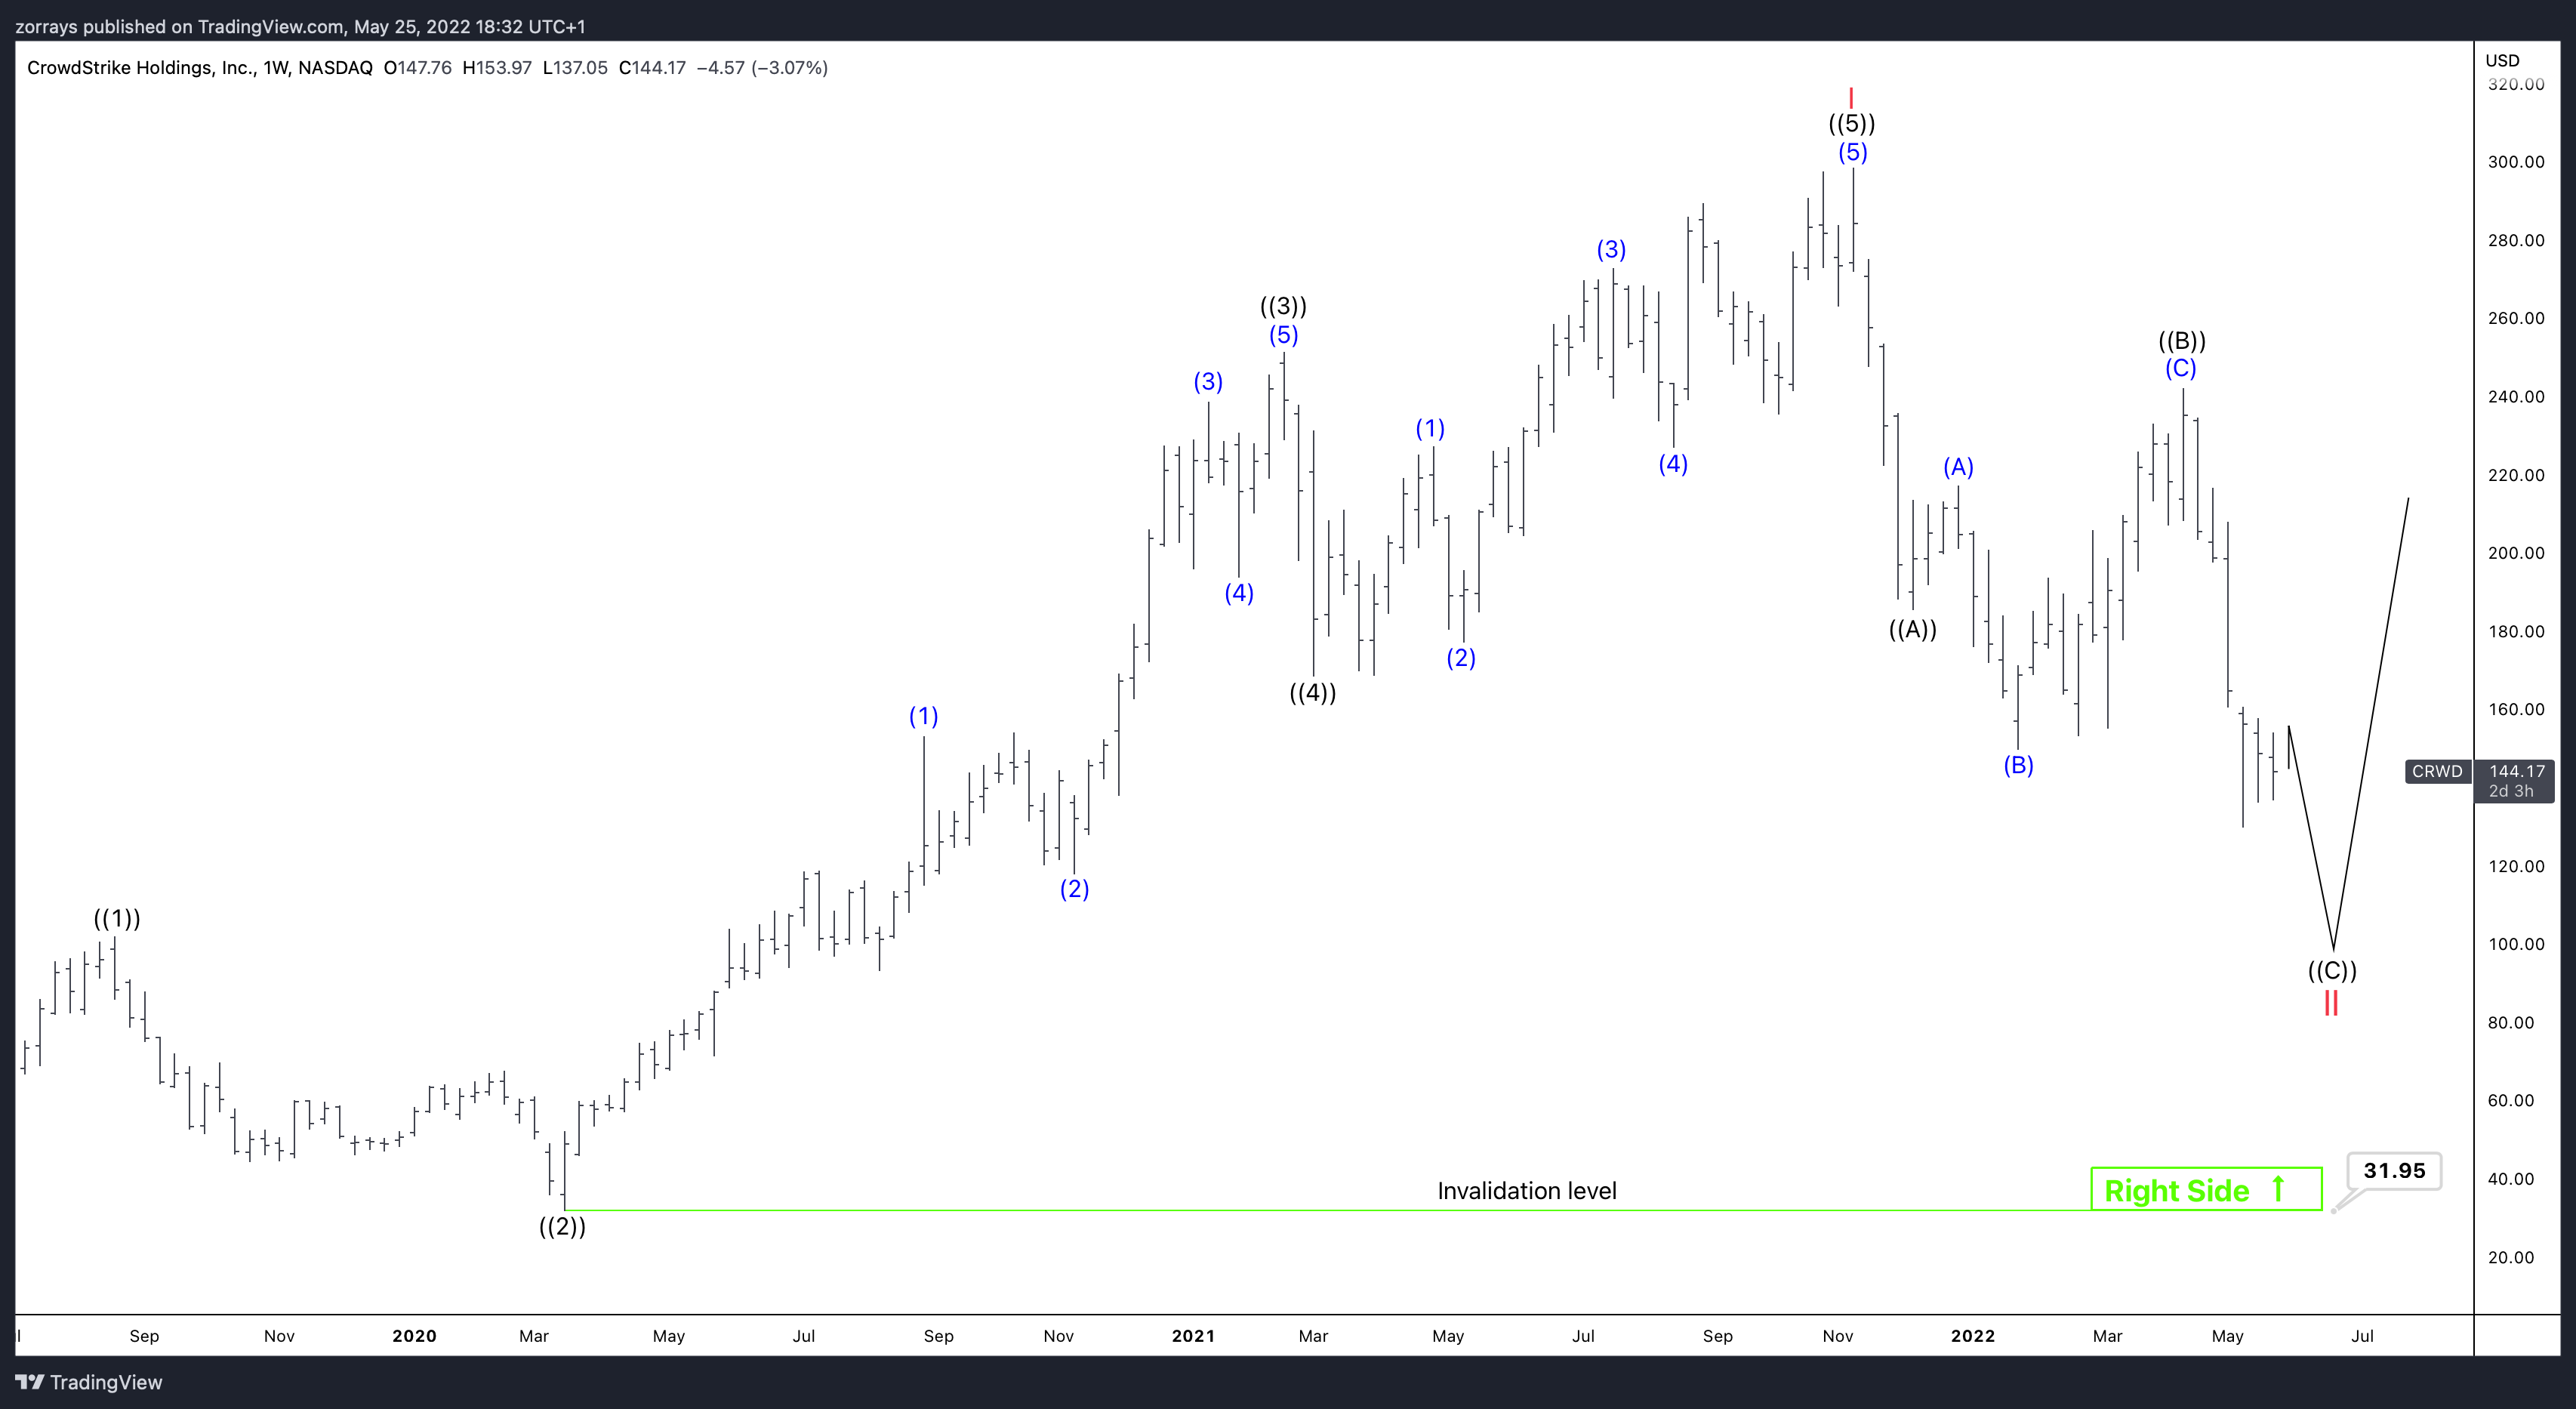
CRWD – CrowdStrike – A Stock to Watch During 2022
Read MoreCrowdStrike Holdings, Inc. is an American cybersecurity technology company based in Austin, Texas. Providing cloud workload and endpoint security, threat intelligence, and cyberattack response services. They have a market value of $51b. They generated sales of up to $1.5b within the last 12 months. We have noticed a huge demand of CrowdStrike due increase numbers […]
-
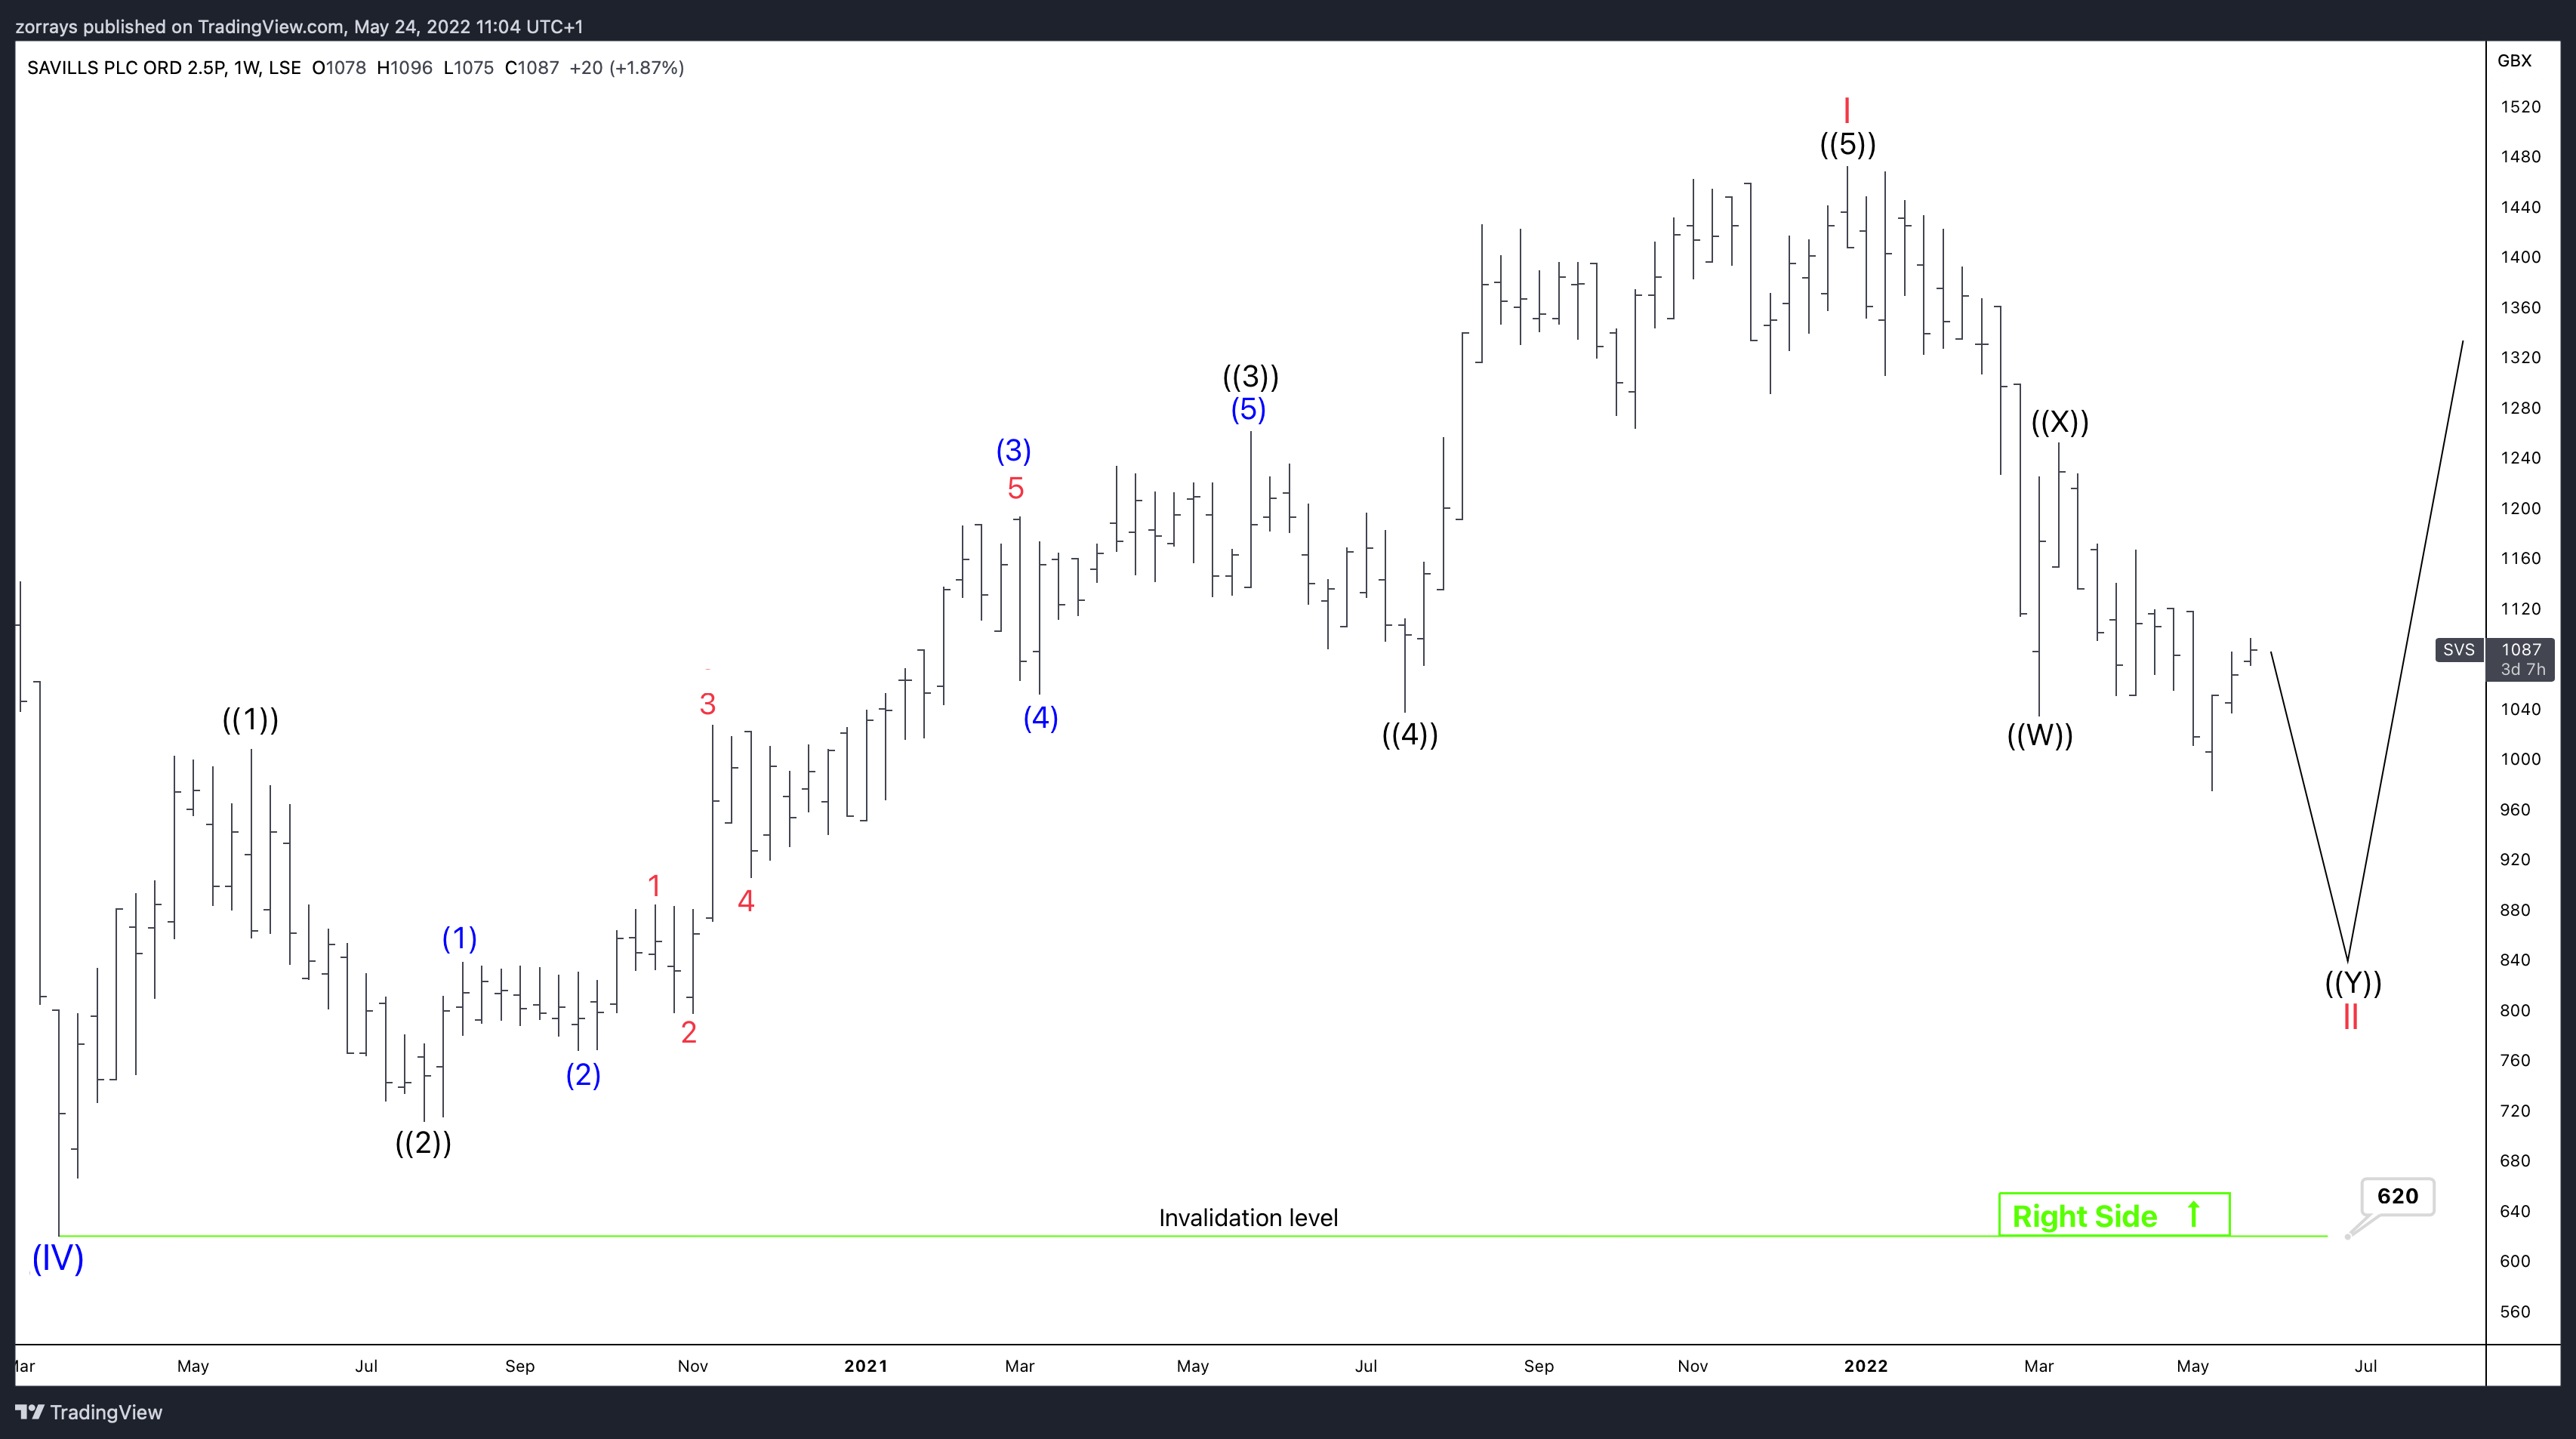
Savills (LSE) potentially going to advance? Will this reflect from the property market?
Read MoreSavills, founded in 1855 is a British based real estate company that deal with variety of different services. Such as, commercial property management, residential sales and lettings, property management and land. They are internationally based and regarded as one of the largest real estate companies in the world. They are listed on the London Stock […]