The Elliott Wave Principle is generally considered to be a subjective tool for technical analysis. This is because the interpretation of the wave patterns and counts relies on the experience and analysis of the price movements.
The Principle involves identifying repetitive patterns in price movements and using those patterns to make predictions about future price action. However, while there are guidelines and rules that can be used to identify this patterns, there is not a unique approach and different traders can come up with different wave counts and interpretations of a same chart.
Is there a way to change that subjective to objective?
There are methods that traders can use to try to make their wave counts more objective. Here are some approaches:
- Use clear and consistent guidelines. One way to make the wave counts more objective is to use clear and consistent guidelines for identifying the waves. For example, traders can use specific rules for wave length, wave amplitude, and wave duration, which can help to reduce subjectivity. (If you want to learn more about Elliott Wave Theory, please follow these links: Elliott Wave Education and Elliott Wave Theory).
- Validate the wave counts with multiple indicators. Another way to make wave counts more objective is to validate them with multiple indicators. This can include technical indicators such as moving averages, relative strength index, stochastic, etc. which can help to confirm the direction and strength of the trend.
- Use a systematic approach. To make wave counts more objective, traders can use a systematic approach to analyzing the charts. This can include breaking down the chart into smaller time frames and looking for patterns and trends that are consistent across multiple time frames. To determinate sequences, cycles, market dynamics, correlations, etc., also is a good support to make a objective count.
- Backtest the wave counts. Another way to make wave counts more objective is to backtest them on historical data. This can help to identify which wave counts have been most accurate in the past and can give traders a better idea of which wave patterns to look for in the future.
While these approaches can help to make the Elliott Wave Principle more objective, it is important to remember that there is always a degree of subjectivity in technical analysis. Most technical analysis tools involve some degree of subjectivity. Ultimately, it is up to the individual trader to use their judgment and experience to interpret the charts and make trading decisions.
How is the must common way to trade using The Elliott Wave Principle?
The most common way to trade using the Elliott Wave Principle is to identify and trade with the trend, which is determined by the direction of the wave patterns.
Traders who use Elliott Wave typically start by identifying the major trend in the market by looking for larger timeframes. They then look for corrective waves that move against the trend. These corrections can be used as potential entry points for trades in the direction of the trend. We have created the Rigth Side System to trade in favor of the trend. Read More about our Right Side System.
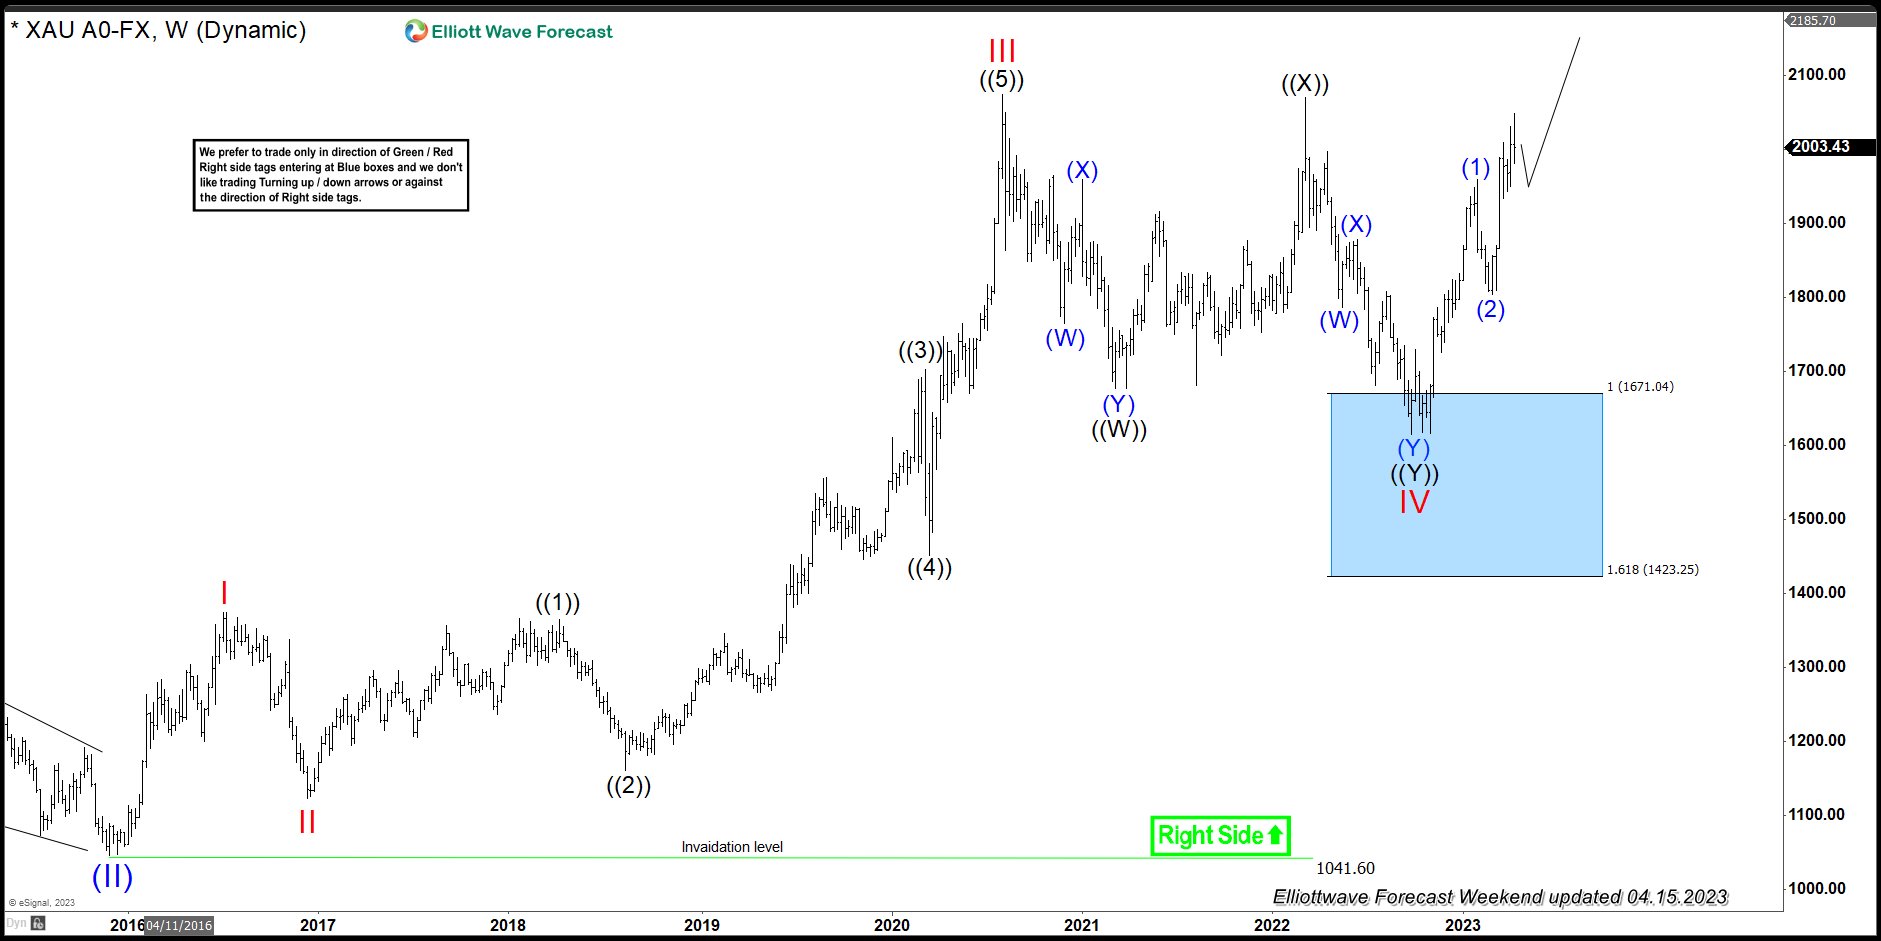
For example, This is the gold weekly chart updated from April 15th. XAUUSD is bullish and traders may look for corrective waves that move downward, such as ABC or WXY corrections. Once the correction is over, traders may enter a long position with the expectation that the trend resumes. In the chart, we can see how gold reacted higher from the blue box. The market completed a double correction structure as wave IV and rally in favor of the trend. We have developed the blue box area where we expect a trend continuation or a contrarian reaction of the market. Read more about Blue Boxes Trading.
 Traders may also use other technical indicators, such as support, resistance, invalidation levels and Fibonacci tools. These will help to confirm their Elliott Wave counts and to identify potential entry and exit points for trades. Traders who use this approach often have their own unique methods and strategies. They can take time and experience to become proficient in its use.
Taking 14 Days Trial
Elliottwave Forecast updates one-hour charts 4 times a day and 4-hour charts once a day for all our 78 instruments (Stocks, ETFs, Indices, Commodities, Forex, Cryptos). We do a daily live session where we guide our clients on the right side of the market. In addition, we have a chat room where our moderators will help you with any questions about the market.
Let’s trial 14 days for only $9.99 here: I want 14 days trial. Cancel Any time at support@elliottwave-forecast.com
Back
