In this Technical blog, we are going to take a quick look at the past 1 hour Elliott Wave performance of Palladium. Which we presented to our clients at elliottwave-forecast.com. We are going to explain the structure from 10/16 (1005.21) cycle below.
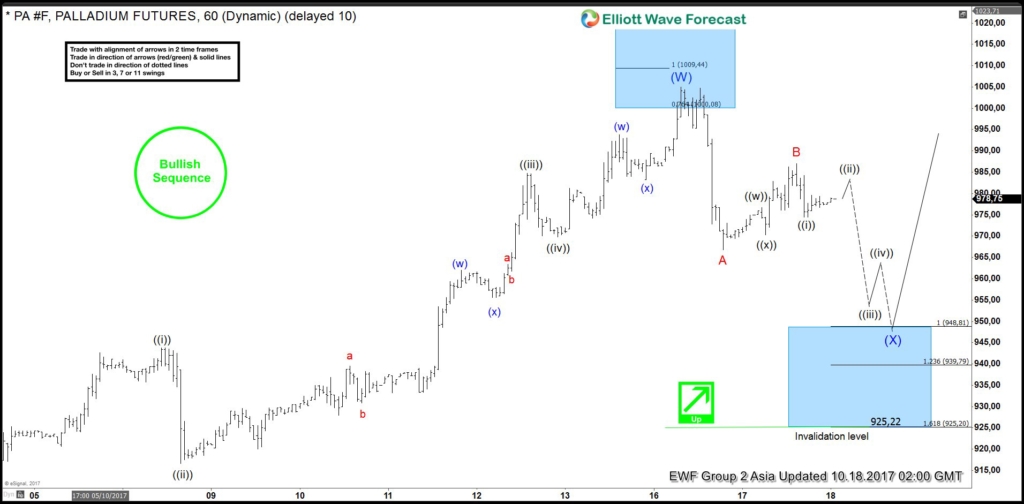
Palladium 1 Hour October 18 Asia updated Elliott Wave Chart
A rally from 9/20 low (898.27) to 10/16 peak (1005.21) ended the intermediate wave (W) higher as a flat. Where Minor wave A ended at 938.78 peak, Minor wave B ended at 904.38 low and Minor wave C of a flat-ended in 5 waves at 1005.21 peak. Below from there, metal was expected to do a pullback to correct that intermediate cycle in wave (X) and was expected to find the buyer’s in a sequence of 3, 7 or 11 swings. It is also important to bear in mind that, in the above Chart, we can see that there is a green arrow to indicate that the trend is up, the bullish Sequence mark to maintain the sequence is also bullish. So, we advised our member’s to buy the dips in the metal on any blue box in 3, 7 or 11 swings provided the pivot at 9/20 low (898.27) stays intact.
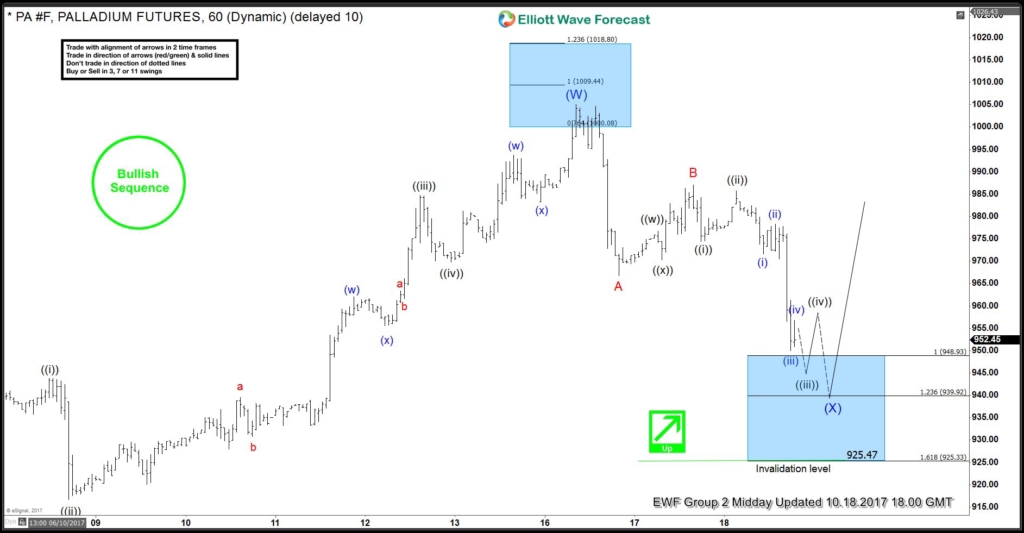
Palladium 1 Hour October 18 Midday updated Elliott Wave Chart
Below from wave (W) peak, the metal corrected that cycle in 3 waves as zigzag correction. Where Minor wave A ended in 5 waves at 969.77 low, Minor wave B bounce ended in 3 swings at 986.85 peak and Minor wave C of (X) was expected to end 5 waves in between 949.06-925.45 100%-1.618% Fibonacci extension area of A-B. And that area in the metal was expected to see buyer’s for new highs ideally provided the pivot at 9/20 low (898.27) stayed intact or for a 3 wave bounce at least to allow our members to create a risk-free position.
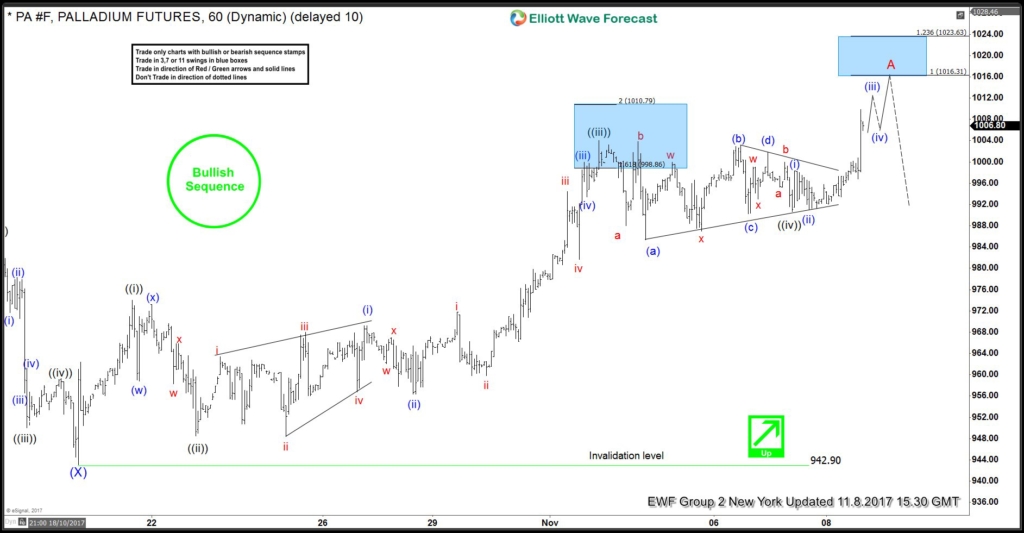
Palladium 1 Hour November 08 Elliott Wave Chart
The metal gave us the reaction higher as expected from the area in between 949.06-925.45 100%-1.618% Fibonacci extension area of A-B and ended the wave C of (X) at 942.90 on 10/19 low. Afterwards, metal broke to new highs suggested that the instrument started the intermediate (Y) leg higher already. The 1 hour NY updated chart from 11.08 above, is showing metal breaking higher and showing another bullish sequence within the cycle from 9/20 low. And was looking to start the Minor wave B pullback from 1016.13-1023.63 area before further upside. If interested in latest 1hr, 4hr, Daily & Weekly path then Try 14-day Free Trial & get the latest market update in Palladium & other commodities as well.
Back


