
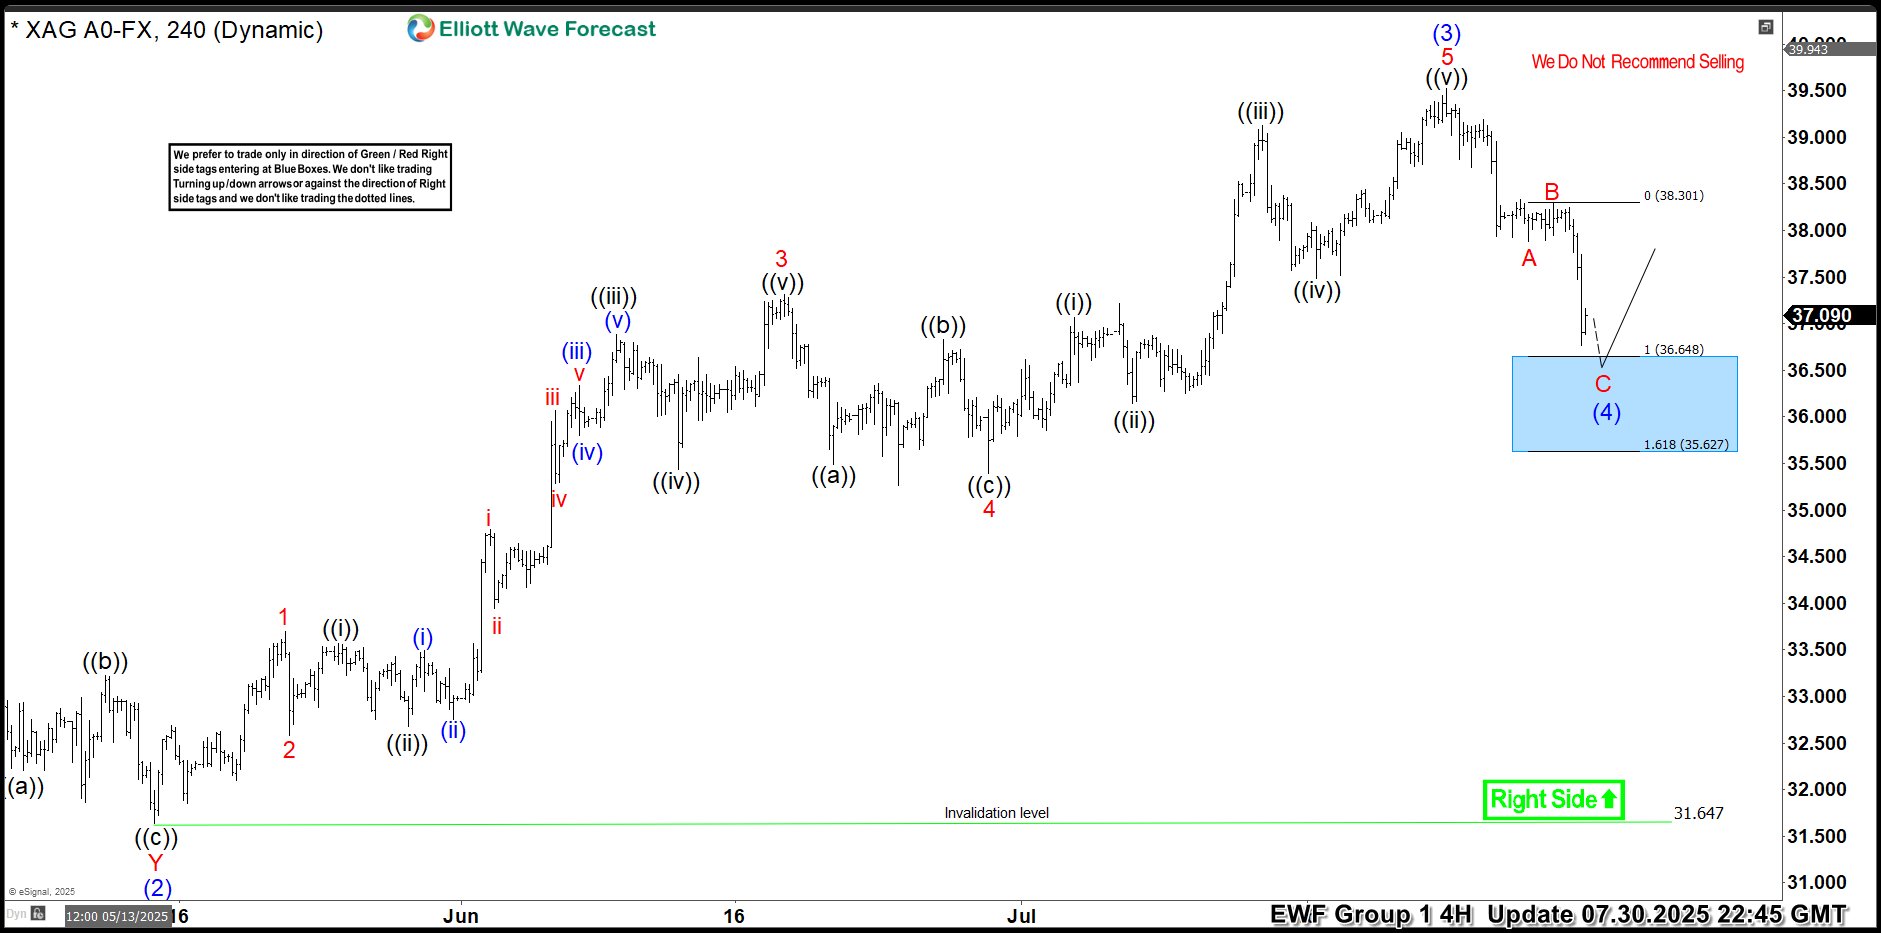
Hello traders. As our members know, we have had many profitable trading setups recently. In this technical article, we are going to talk about another Elliott Wave trading setup we got in Silver (XAGUSD). The commodity has completed its correction exactly at the Equal Legs zone, also known as the Blue Box Area. In this […]
-

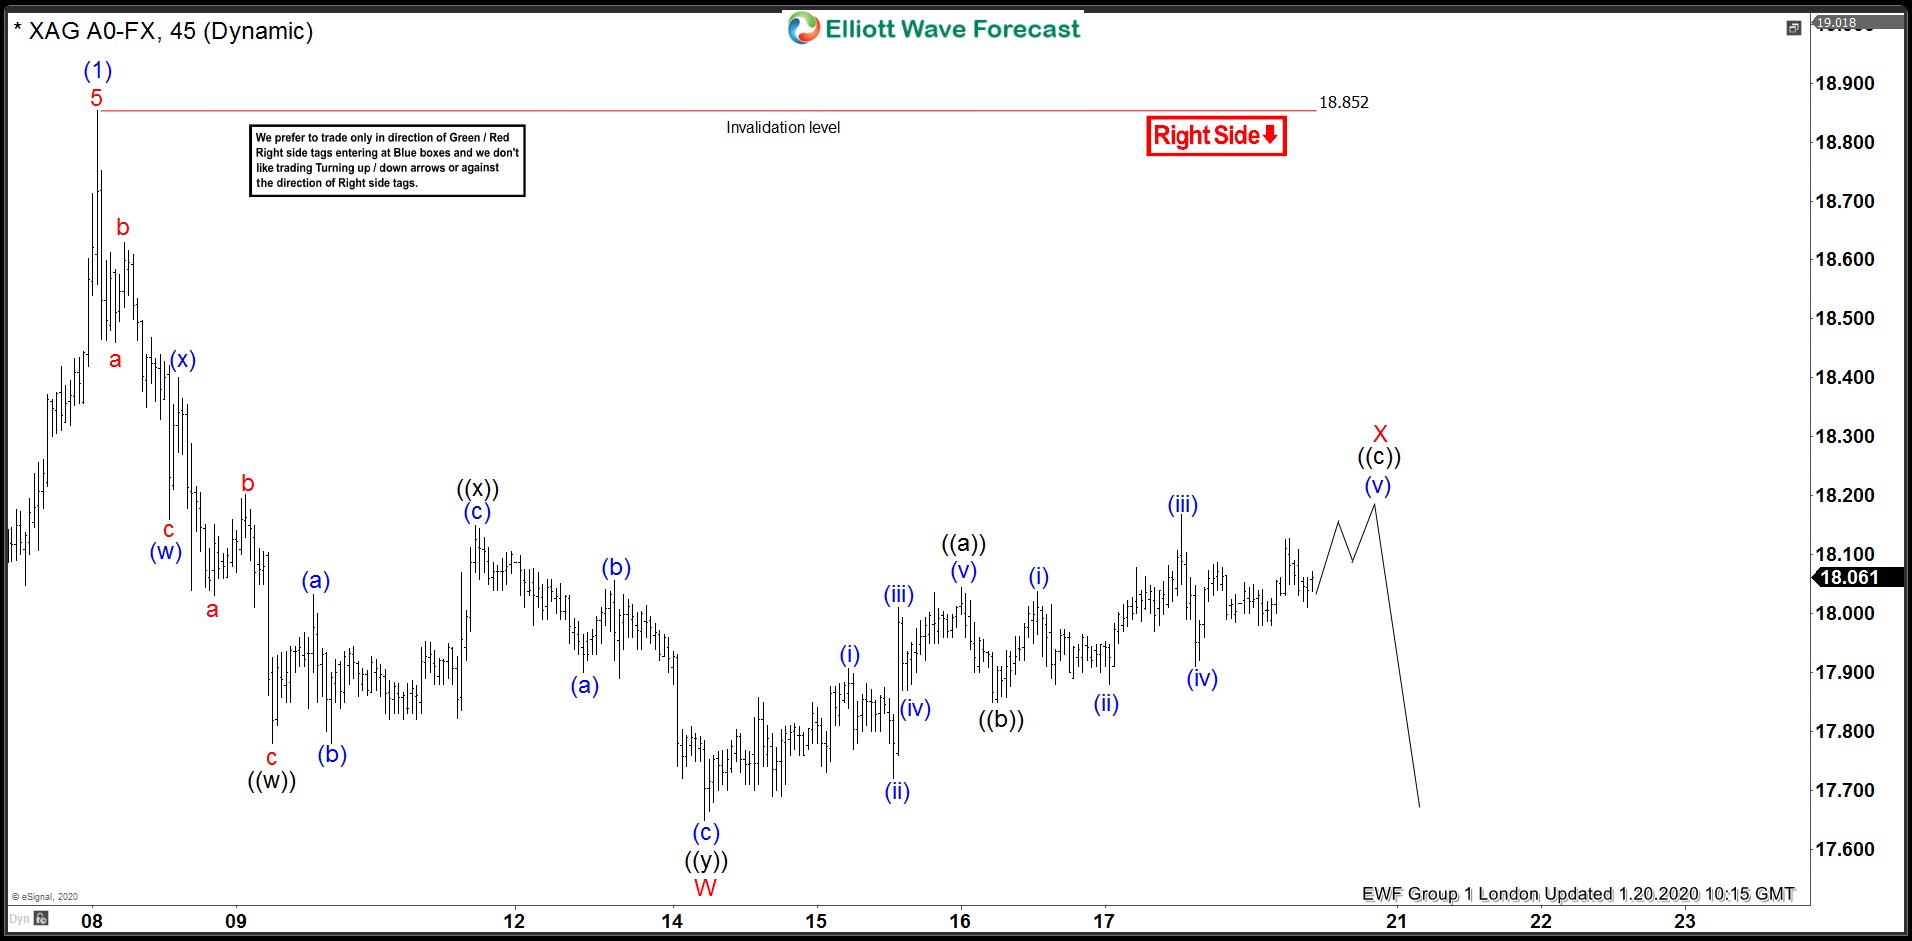
Elliott Wave View: Silver Has Scope for More Downside
Read MoreSilver shows incomplete sequence from Jan 8 and the metal has scope to see more downside. This article and video look at the Elliott Wave path.
-
Silver Elliott Wave View: Forecasting The Path Using Elliott Wave Theory
Read MoreIn this technical blog, we’re going to make a recap of our recent forecast in Silver (XAG), which has been following the path that we had established in our charts offered to the customers of Elliottwave-Forecast. If you’ve been following us in the last couple of weeks, an interesting move has happened in the metal […]
-
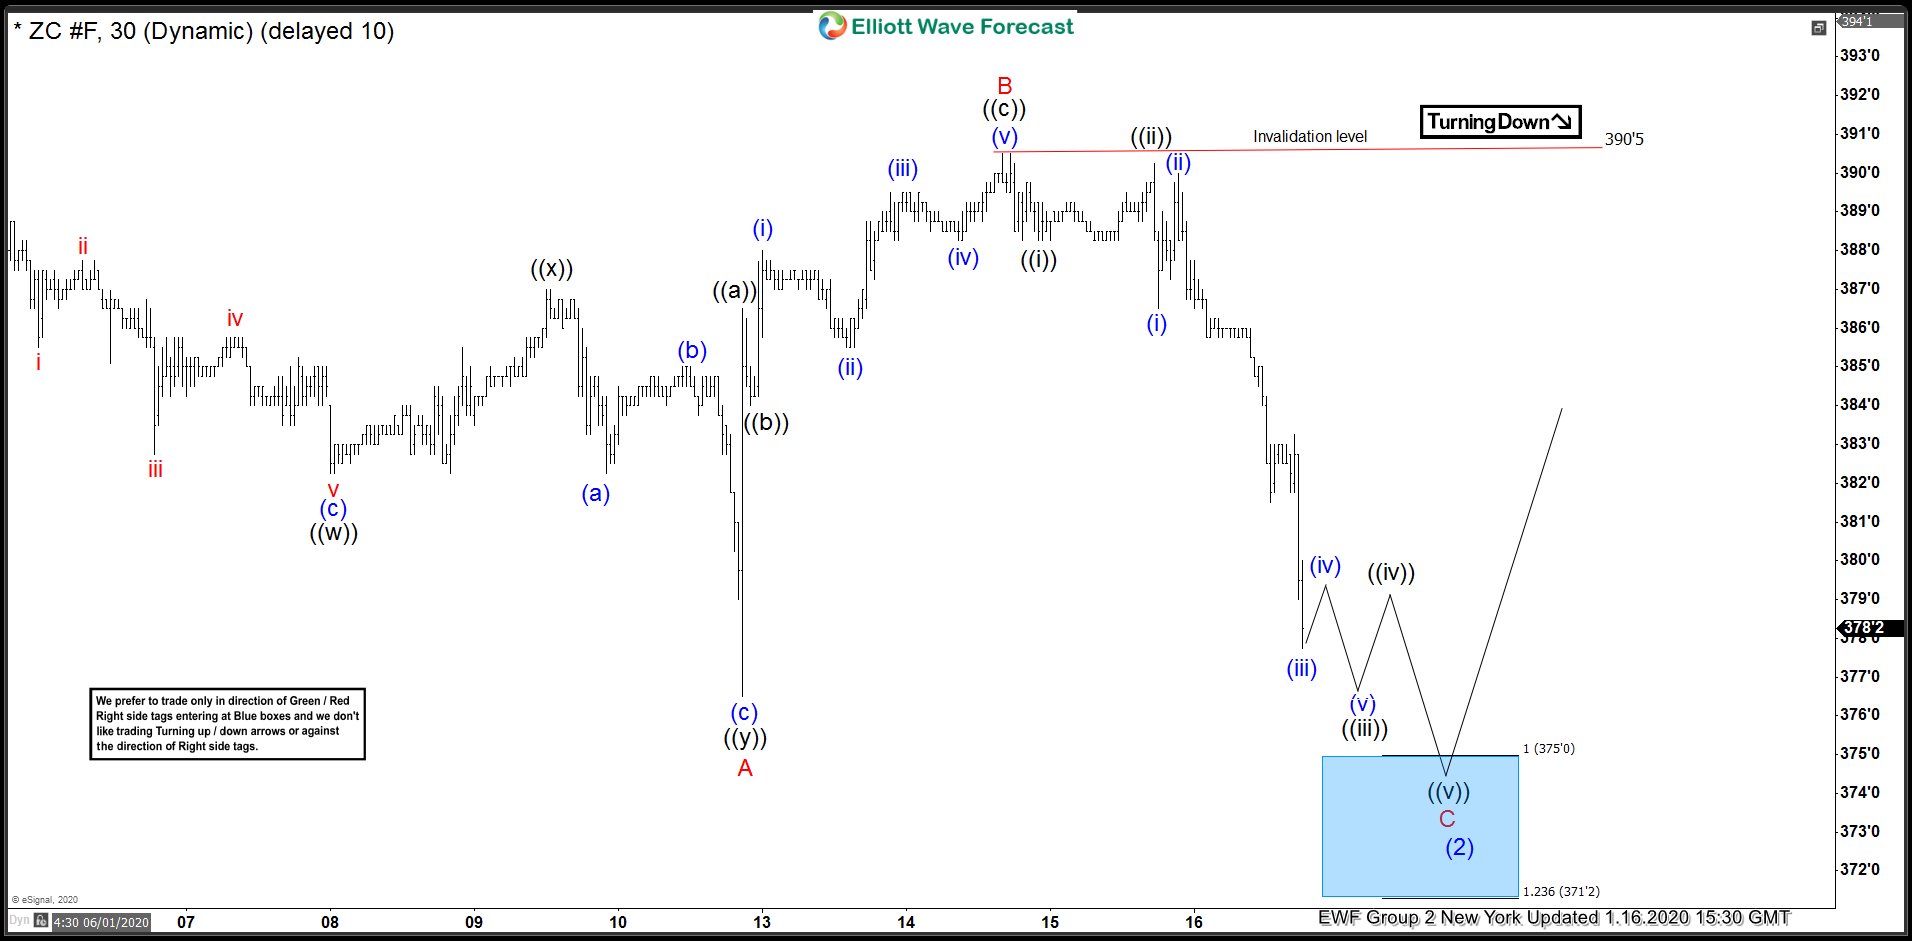
Corn (ZC_F) Forecasting The Bounce From The Blue Box Area
Read MoreIn this blog, we are going to take a quick look at the Elliottwave chart of Corn (ZC_F). The chart from 1.16.2020 New York update showed that Corn was doing a pullback in wave (2). Wave A of (2) ended at 376’4 low. Wave B of (2) ended at 390’5 high. From there, we expect […]
-
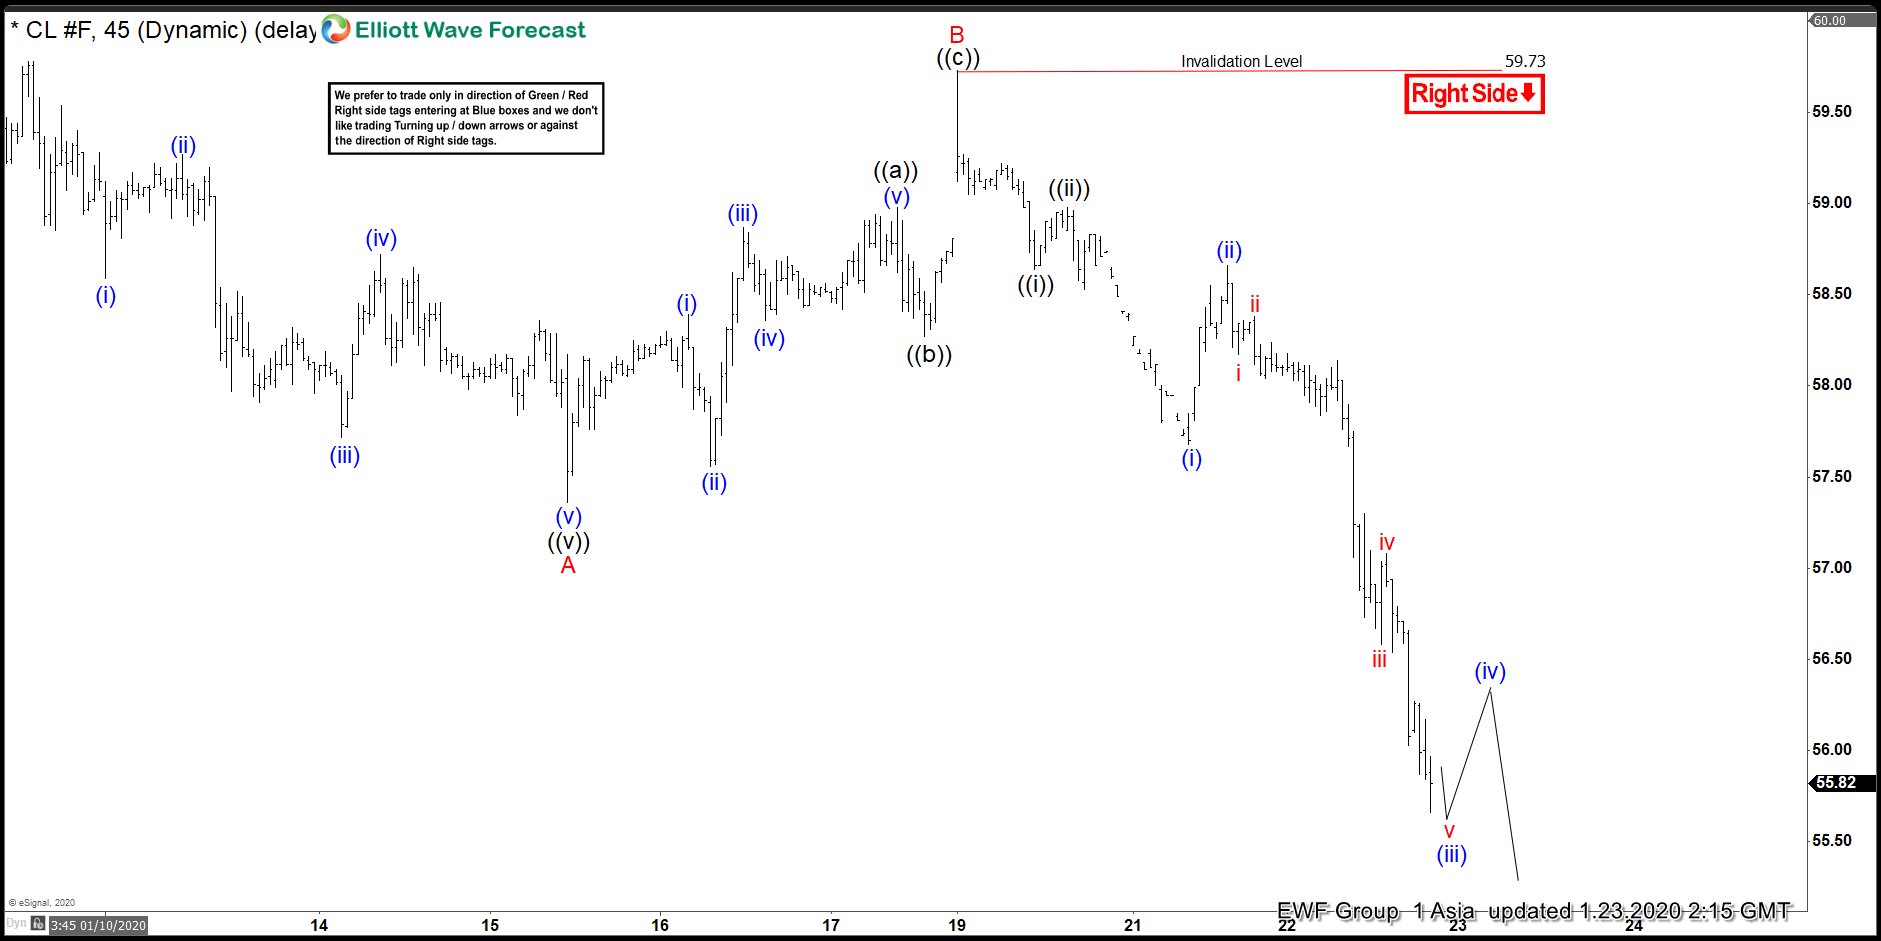
Elliott Wave View: Oil Downside Target
Read MoreOil extends lower in Elliott Wave impulsive structure within a bigger zigzag pattern. This article and video looks at the potential downside target.
-
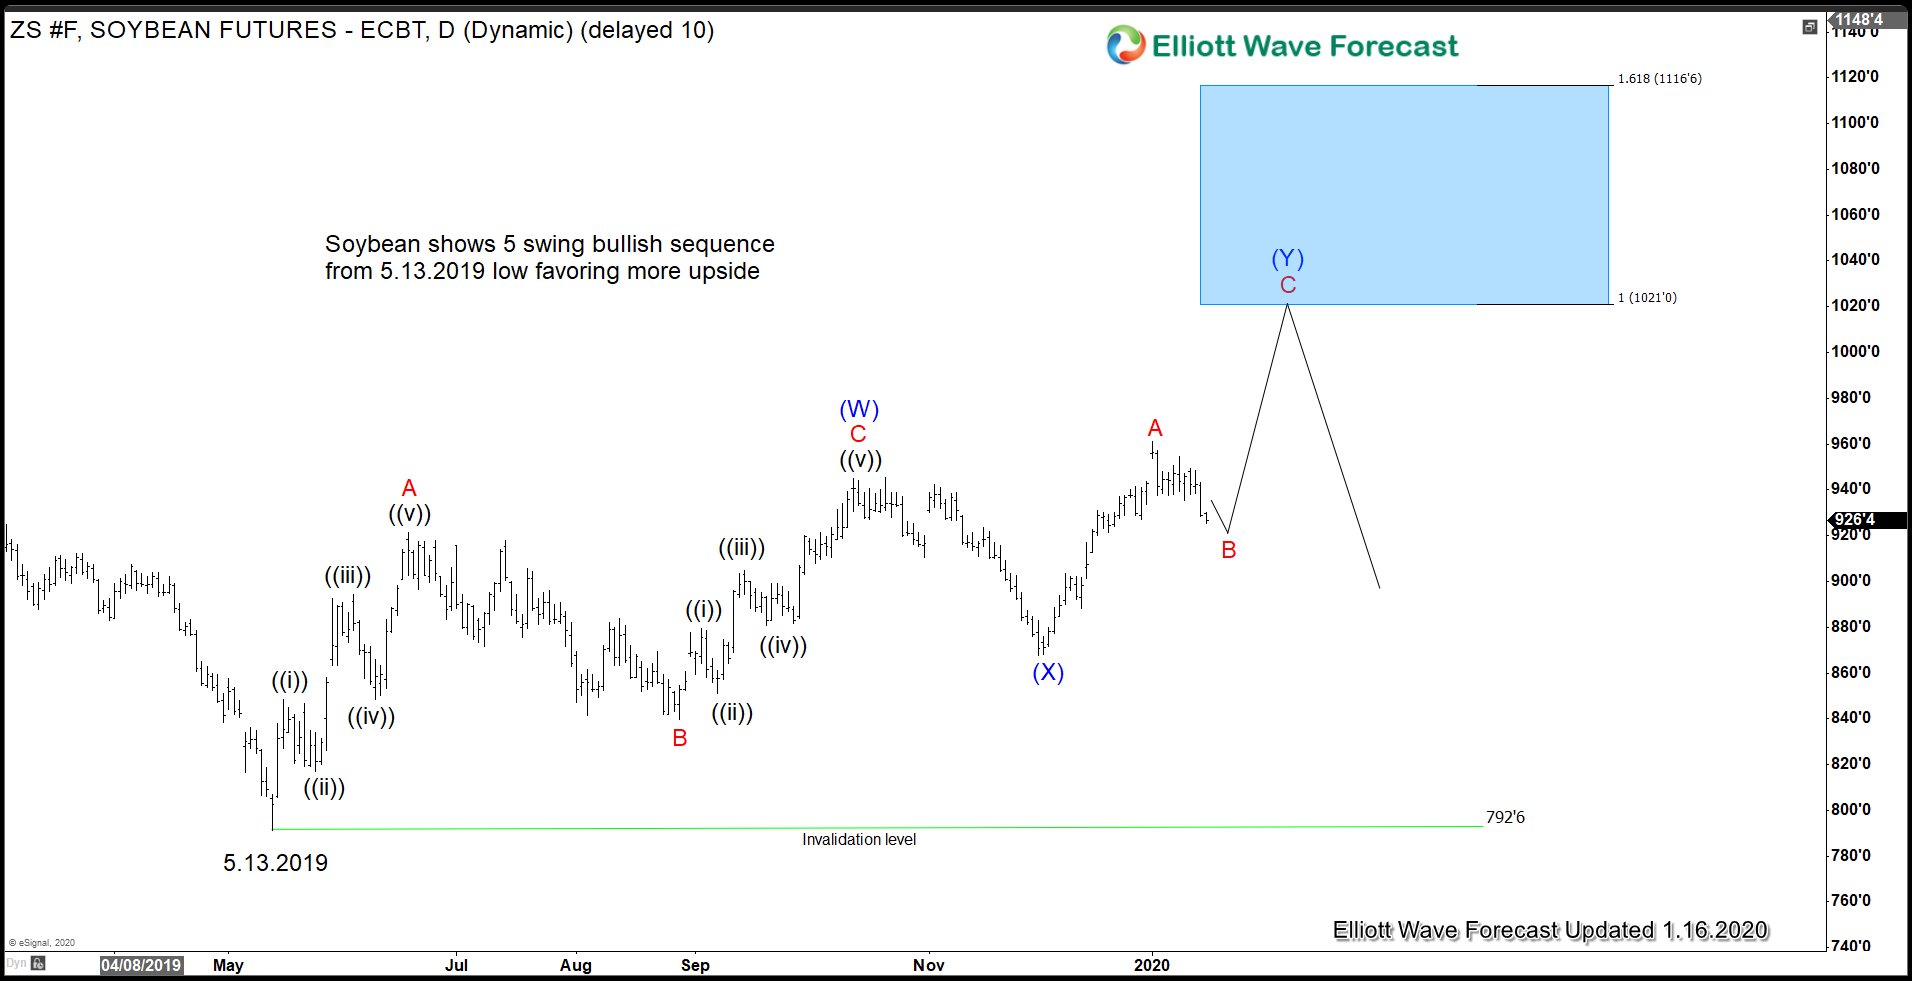
Soybean May Benefit From US – China Phase 1 Trade Deal
Read MoreWith the official signing of Phase 1 trade deal between US and China today, we may have seen the worst in Soybean’s market at least in the short term. This of course assumes that China can commit to the agreement and US doesn’t take another measure. However, it seems safe to say that the tit-for-tat […]
-
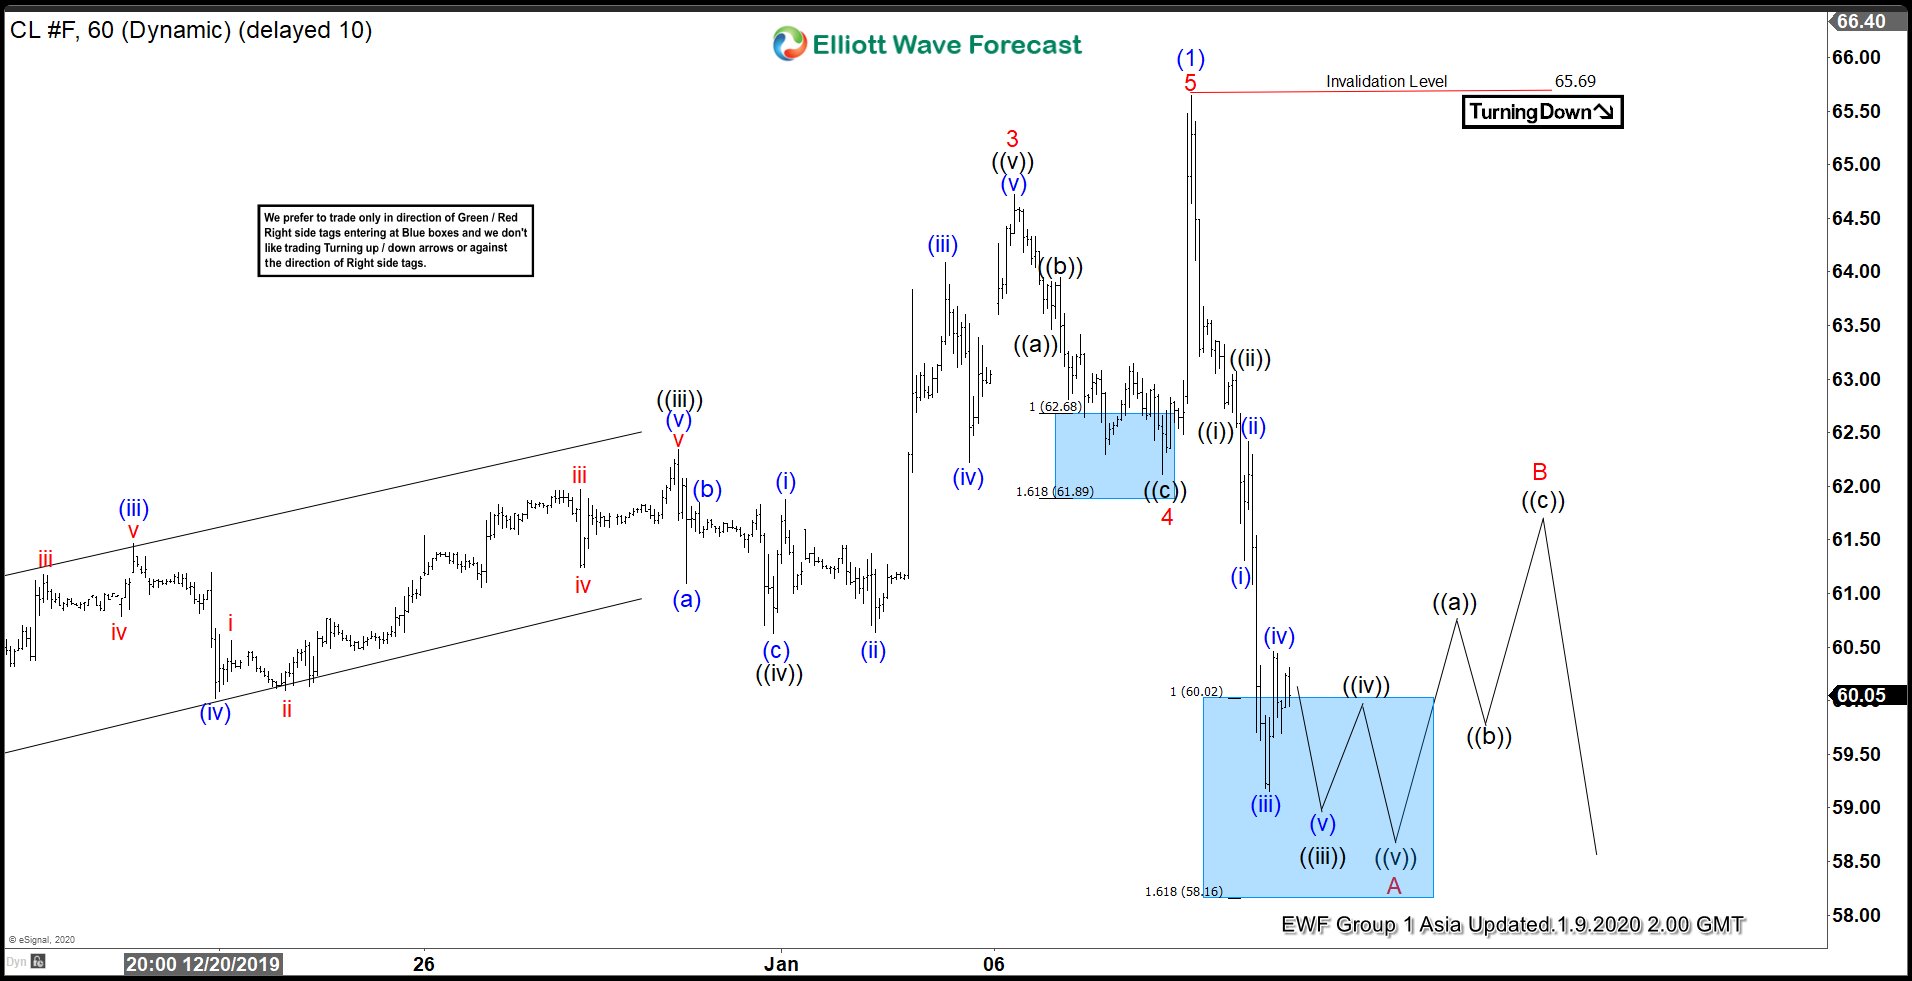
Elliott Wave View: Oil ($CL_F) Decline in Impulsive Structure
Read MoreOil decline from Jan 8 high is impulsive suggesting it can see further downside. This article looks at the Elliott Wave path.