
-
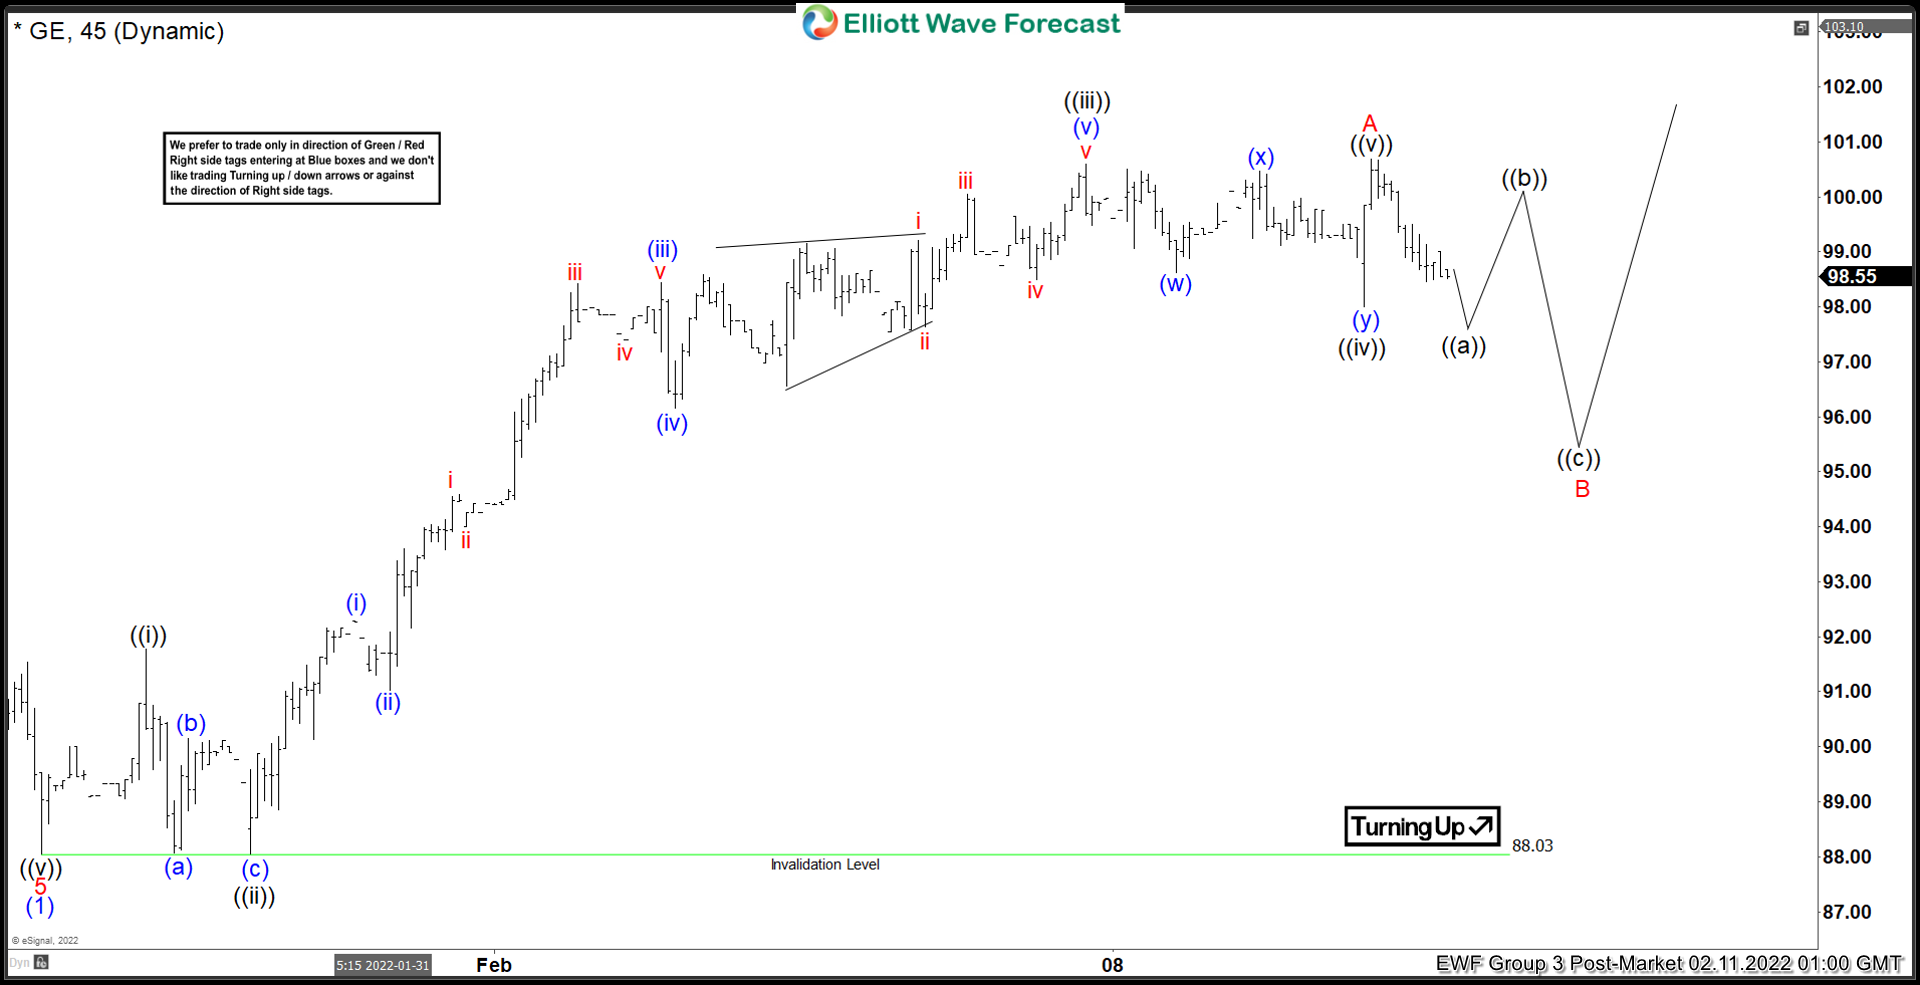

Elliott Wave View: General Electric (GE) Ended 5 Waves Rally
Read MoreGE (General Electric) is correcting cycle from January 27 low before the next leg higher. This article and video look at the Elliott Wave path.
-
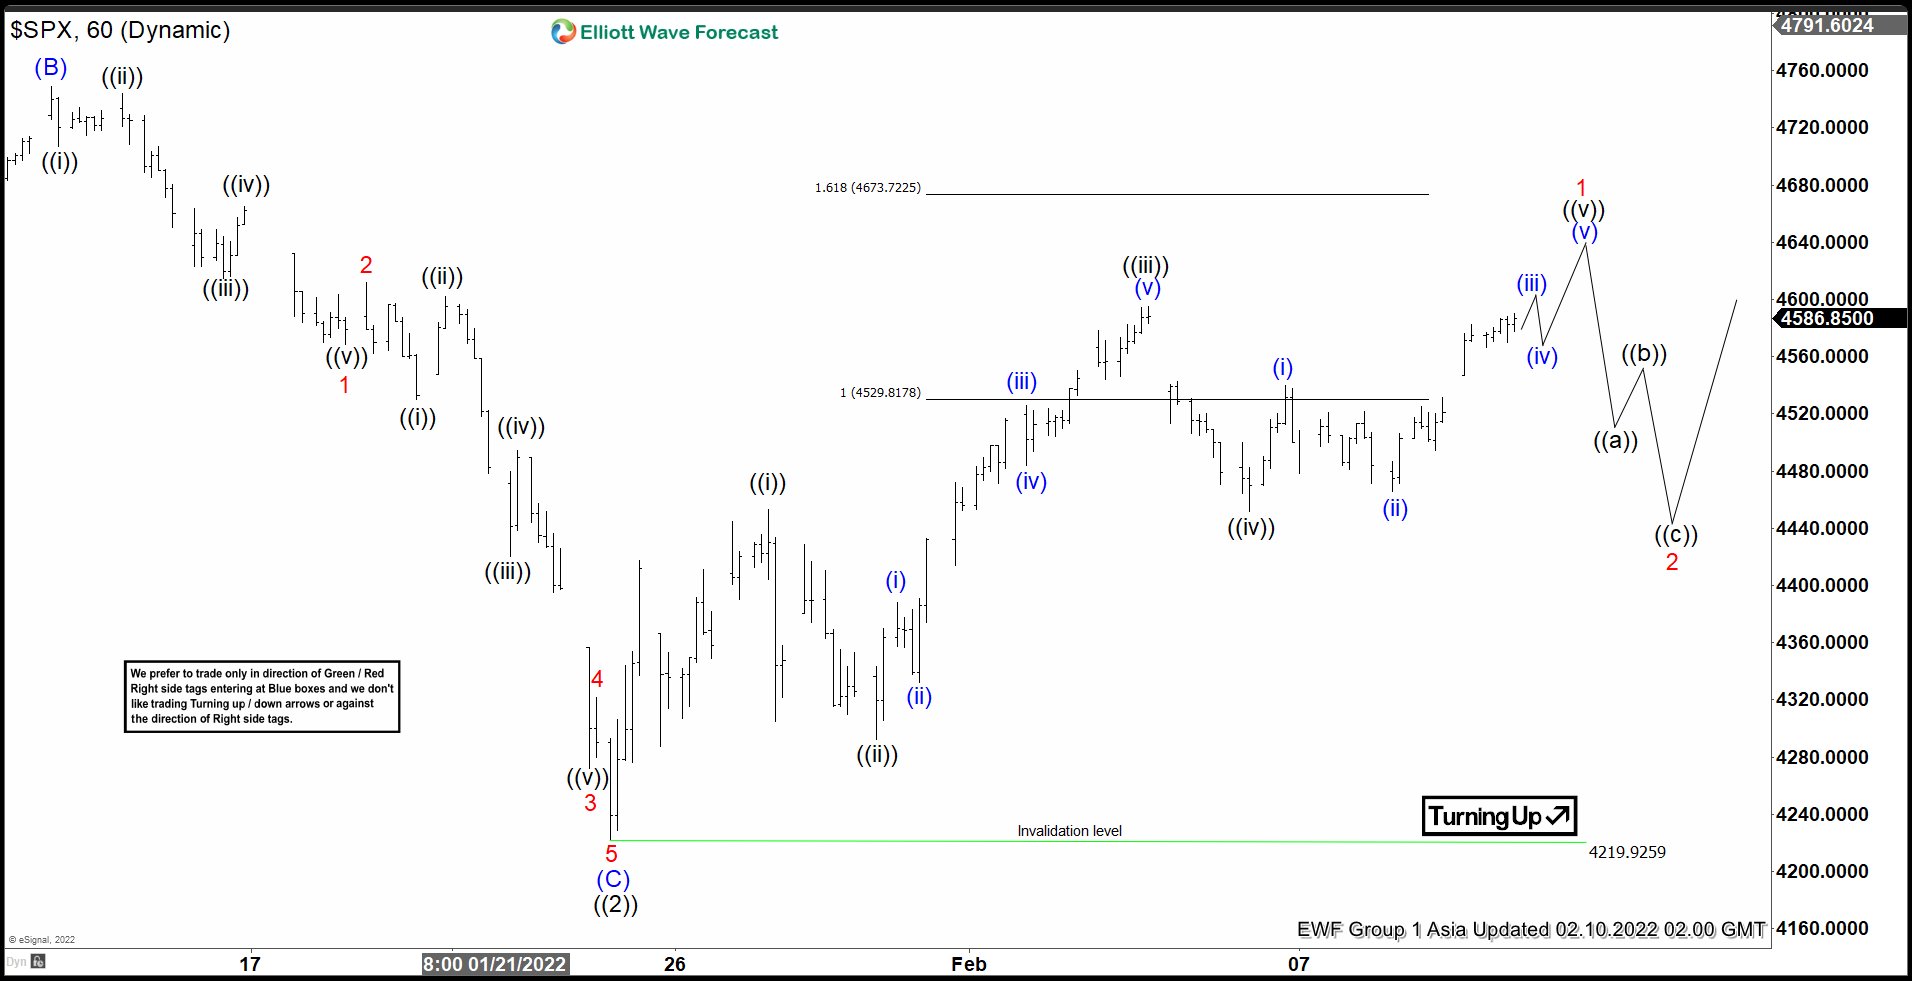
Elliott Wave View: S&P500 (SPX) 5 Waves Rally Favors the Bulls
Read MoreSPX is looking to complete a 5 waves impulse from January 25 low which favors the bulls. This article and video look at the Elliott Wave path.
-
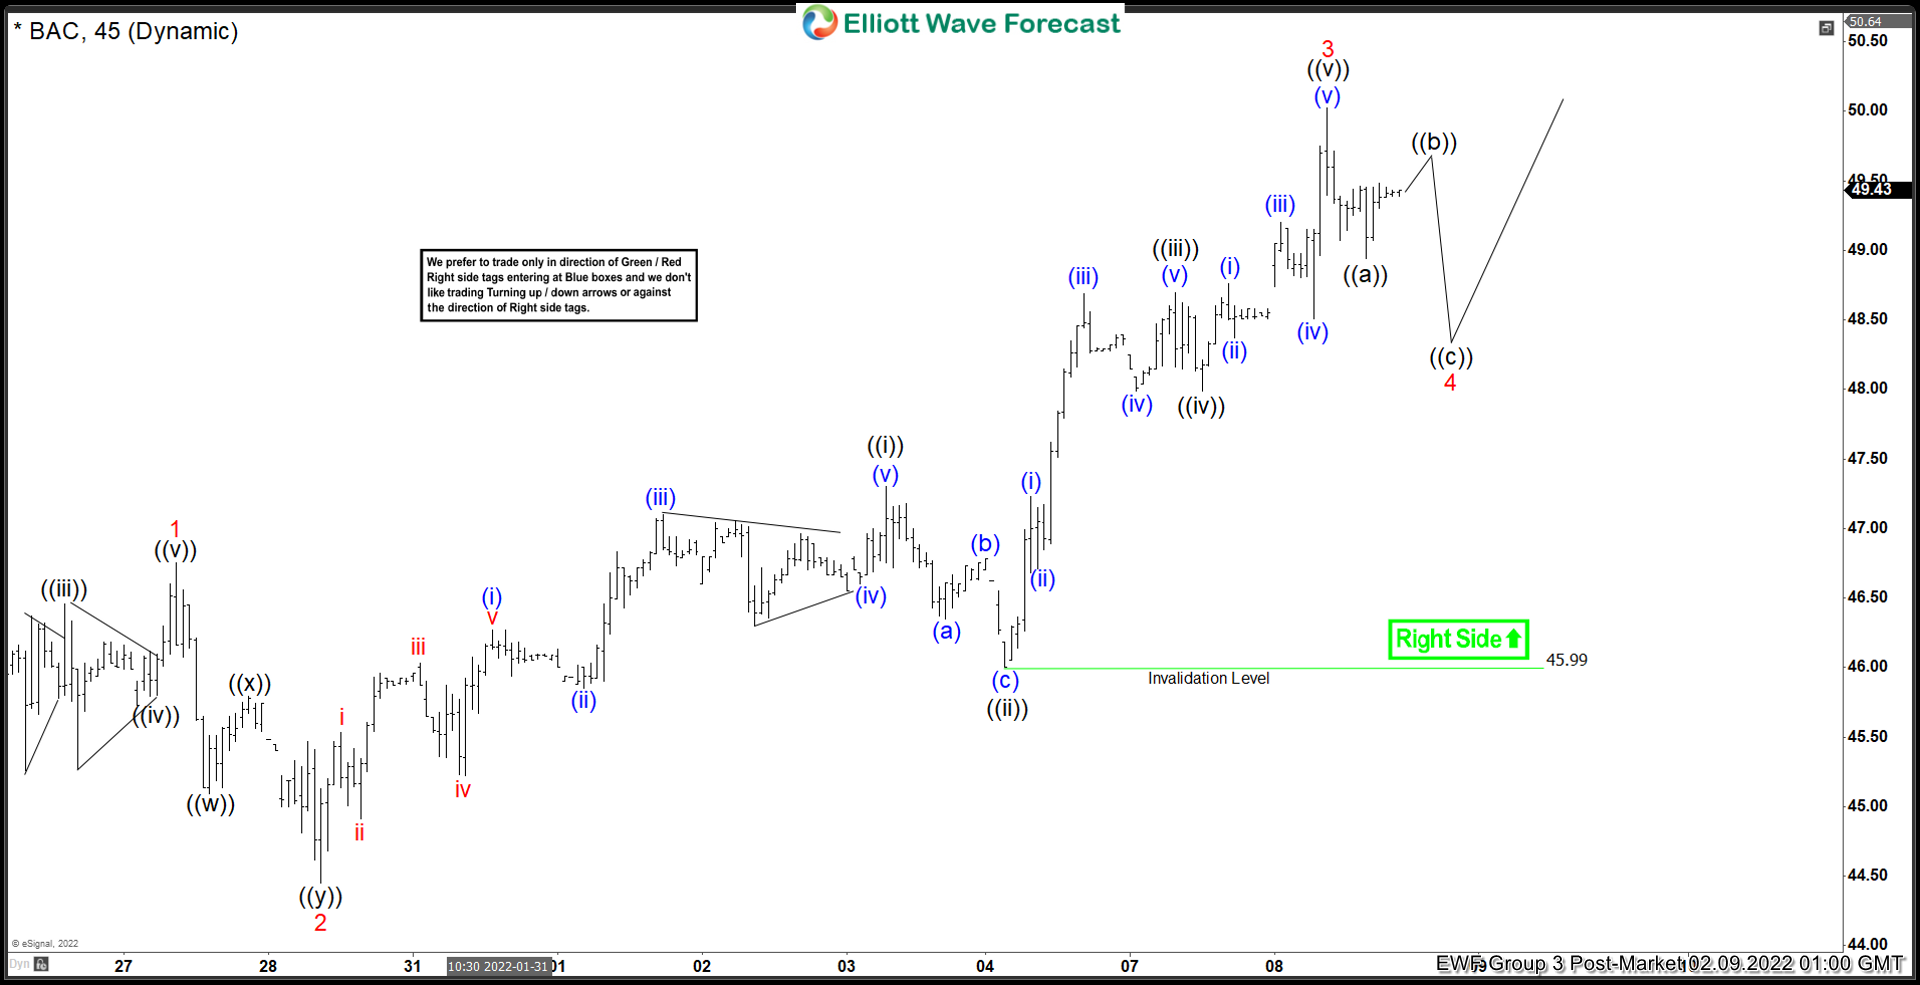
Elliott Wave View: Bank of America (BAC) Looking to Extend Higher
Read MoreBAC is looking to complete an impulse move from January 24, 2022 low looking for more upside. This article and video look at the Elliott Wave path.
-
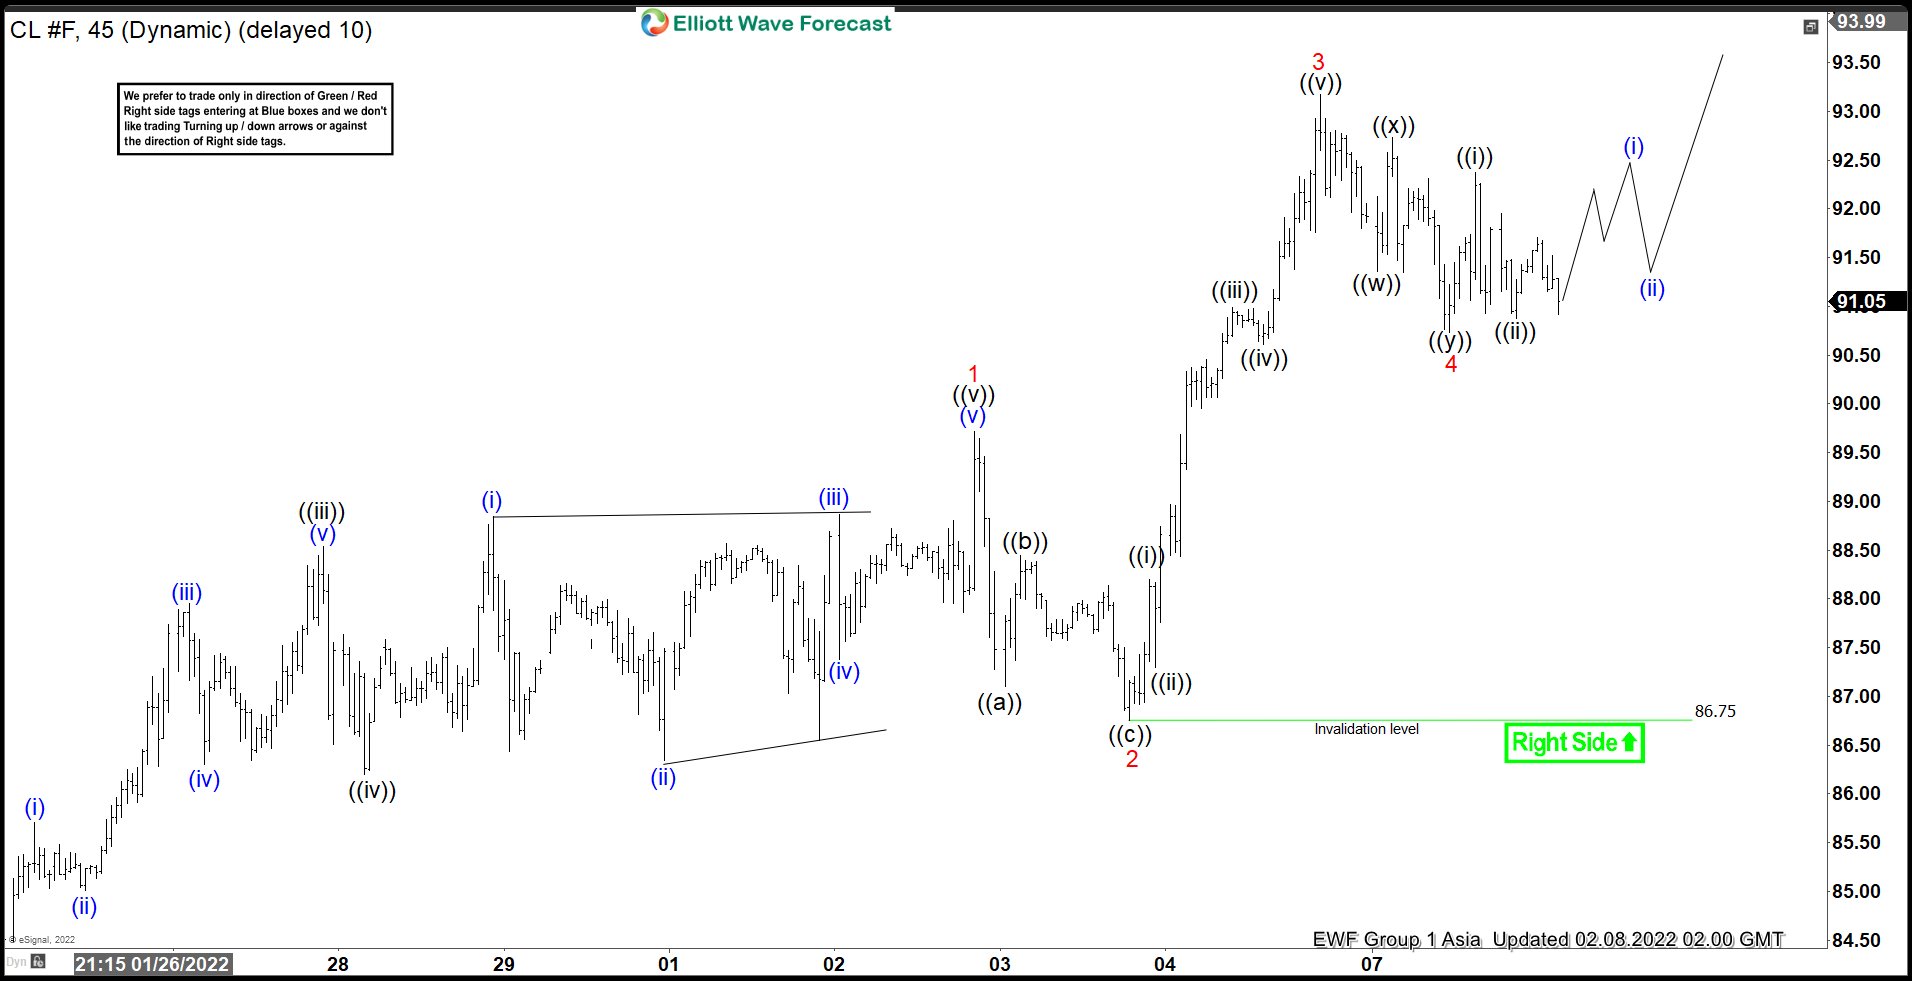
Elliott Wave View: Oil (CL) Wave 5 Near Complete
Read MoreOil (CL) is looking to complete an impulse move from January 24, 2022 low. This article and video look at the Elliott Wave path.
-
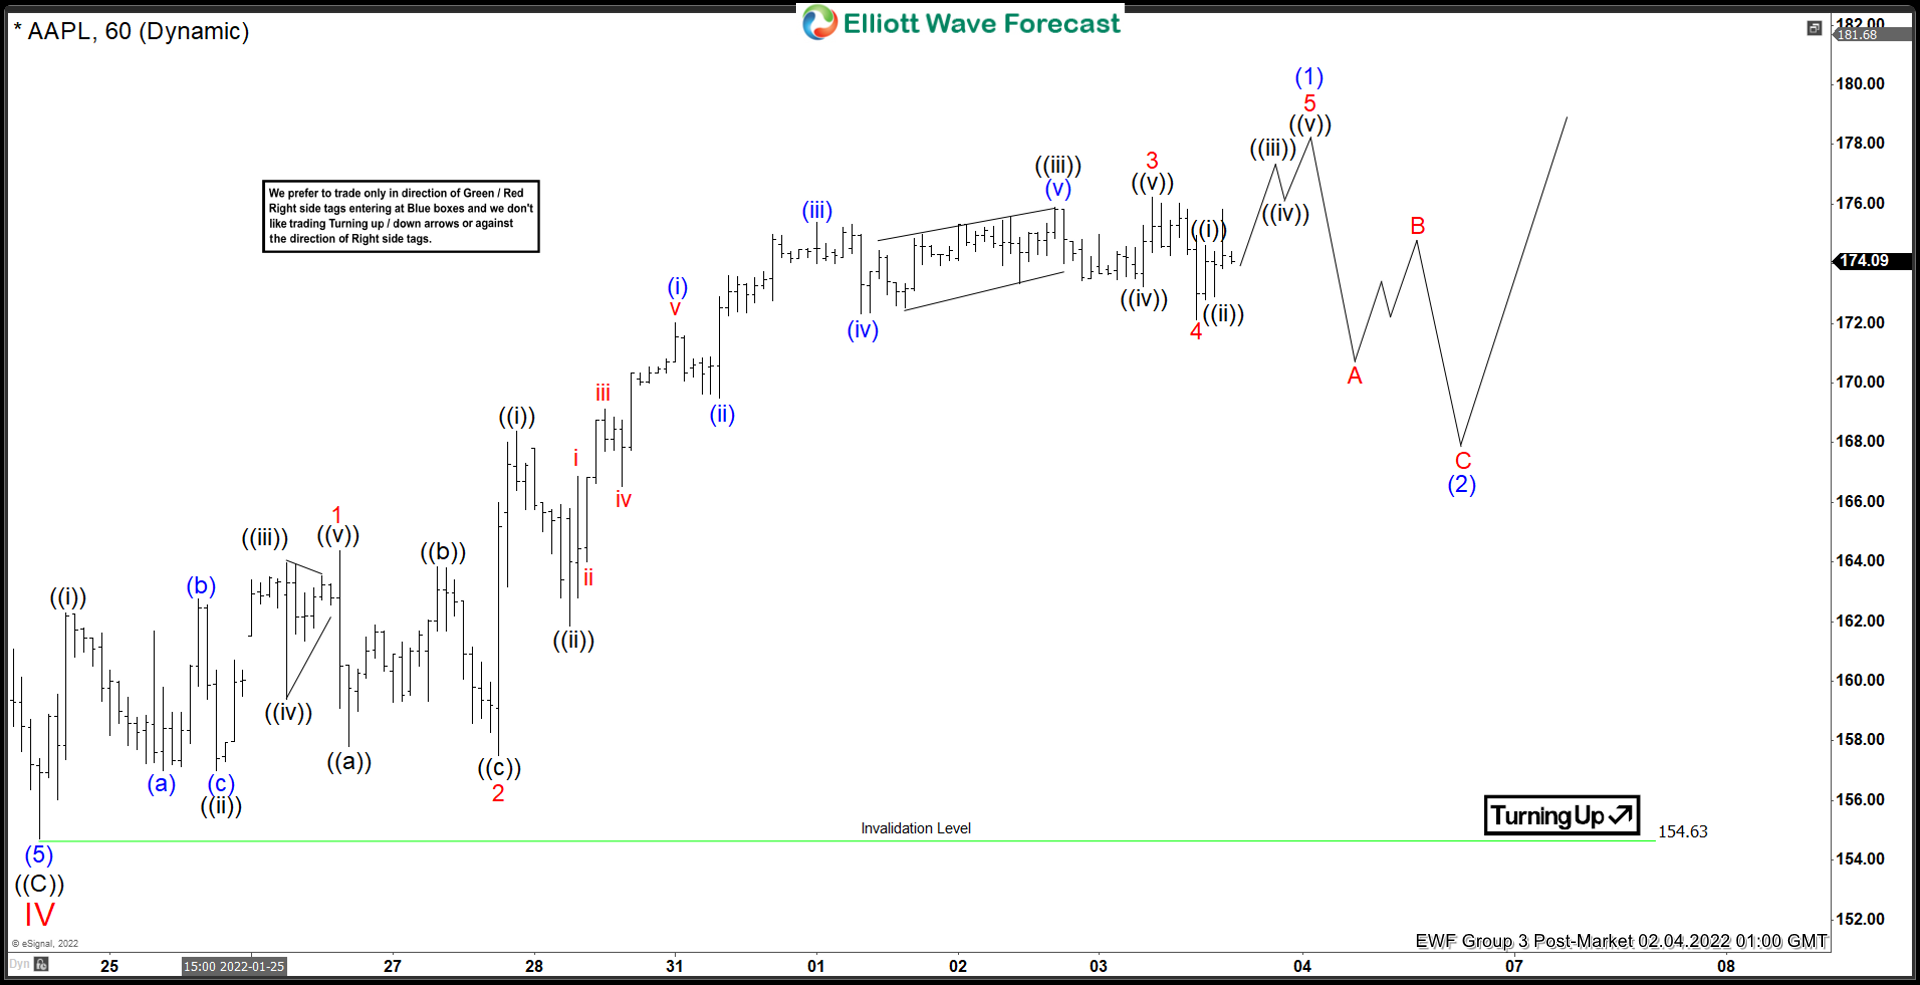
Elliott Wave View: Apple (AAPL) Resumes Higher
Read MoreApple (AAPL) has resumed higher after ending the correction on January 25 low. This article and video look at the Elliott Wave path.
-
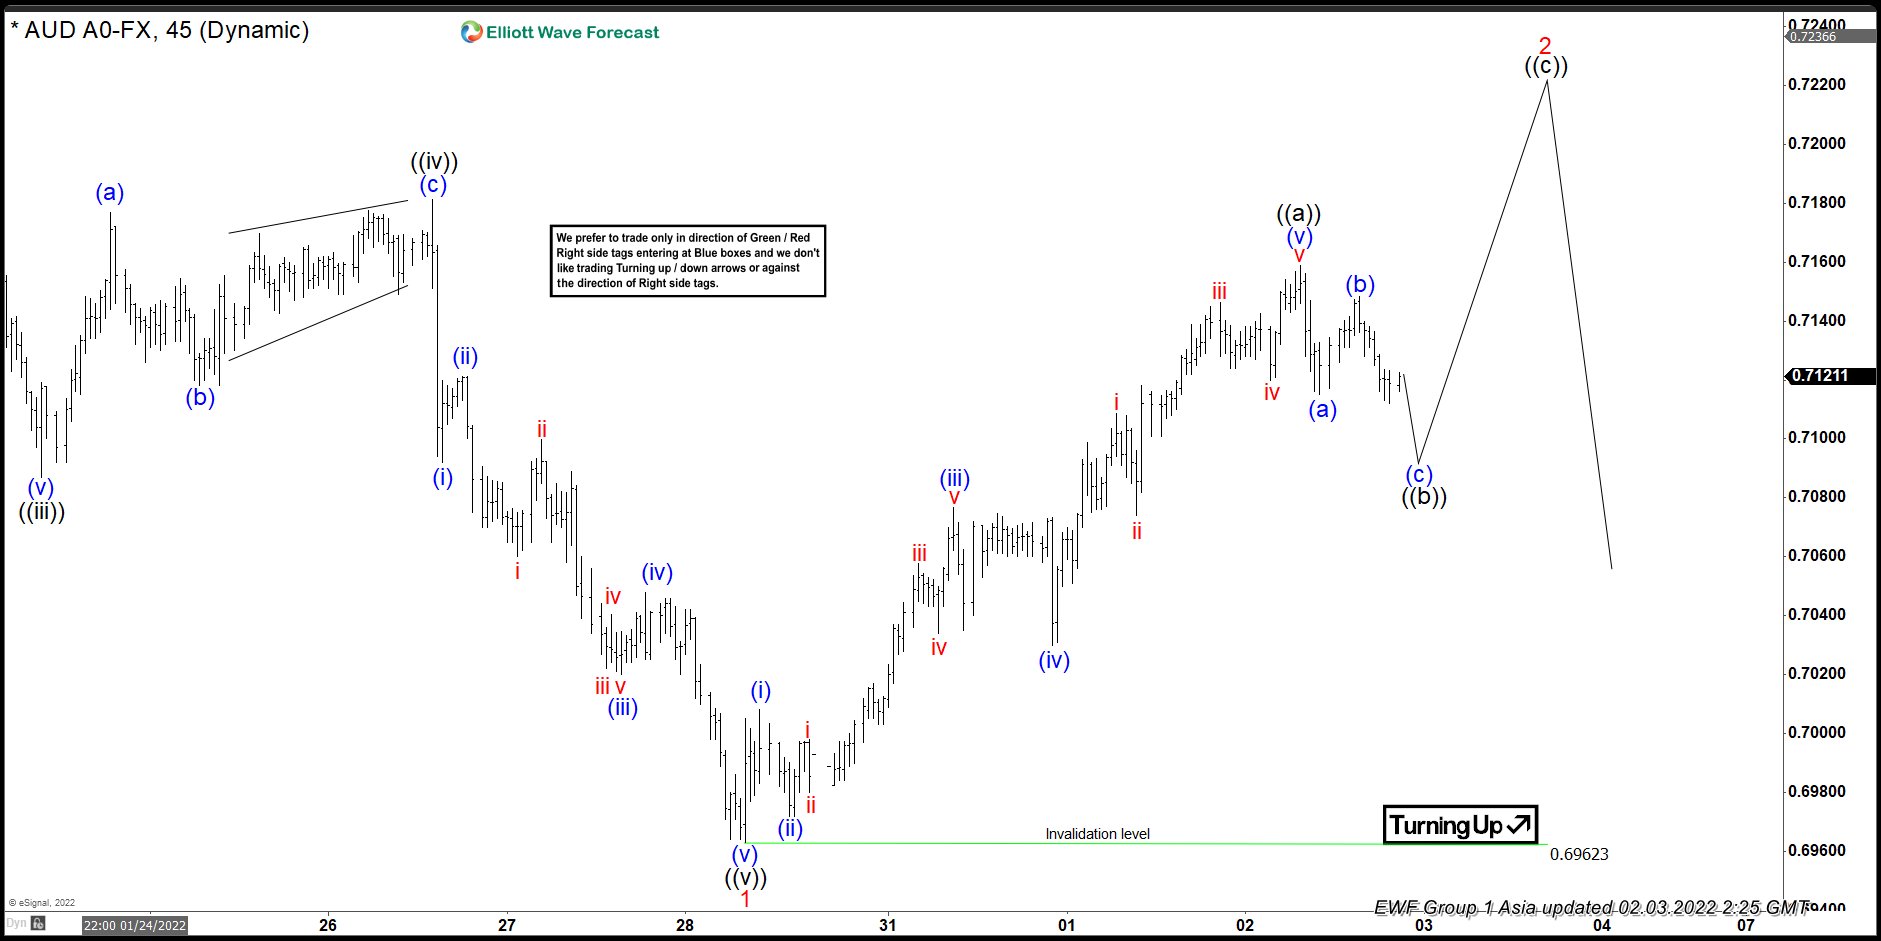
AUDUSD Elliott Wave View: Bounce Can Extend Higher
Read MoreAUDUSD the bounce from January 28 low is unfolding as a zigzag structure & expected to extend higher. This article and video look at the Elliott Wave path.