
The Power of 3-7-11 and the Grand Super Cycle: How We Saw the Bullish Turn in April 2025 Back on April 9, 2025, while World Indices were dropping sharply and global sentiment had turned overwhelmingly bearish, we published an article that challenged the fear-driven narrative. We explained why selling was not the right approach and […]
-

Elliott Wave View: GDX Rally Remains Corrective
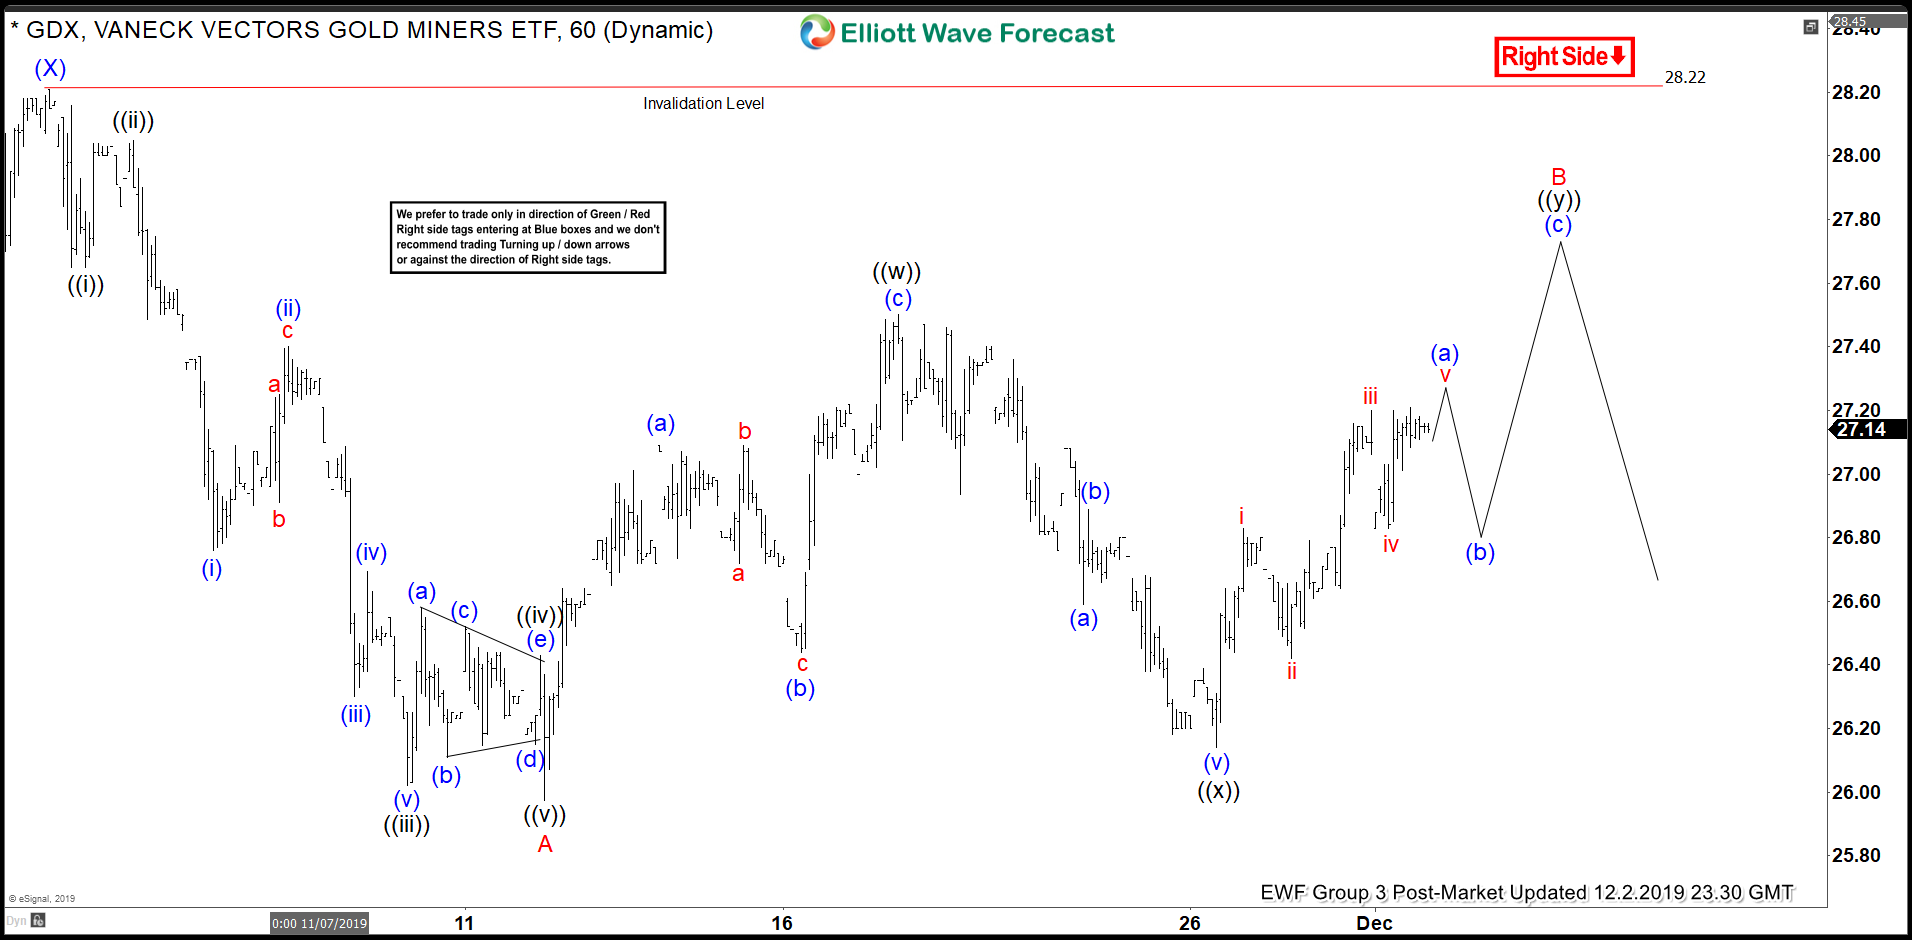
Read MoreGDX rally from Nov 12 low is unfolding as a double zigzag Elliott Wave structure & while bounce stays below Nov 1 peak, it can extend lower.
-

Global Indices Should Remain Resilient Despite Geopolitical Threat
Read MoreDespite Beijing’s objection, President Trump has gone ahead and signed two bills backing Hong Kong’s protesters into law. Beijing has continuously voiced strong objection against the legislation as China sees it as meddling in its domestic affairs. Trump signed these bills as US and China still try to reach a phase one trade deal. China […]
-

Elliott Wave View: FTSE Bullish Sequence Favors Higher
Read MoreFTSE shows a bullish Elliott Wave sequence from October 3, 2019 low favoring further upside. The rally from October 3 low is unfolding as a double three Elliott Wave structure. On the chart below, we can see wave ((w)) ended at 7431.94 and pullback in wave ((x)) ended at 7199.40. Internal structure of wave ((x)) […]
-

Elliott Wave View: Russell (RTY_F) Ending Wave 5
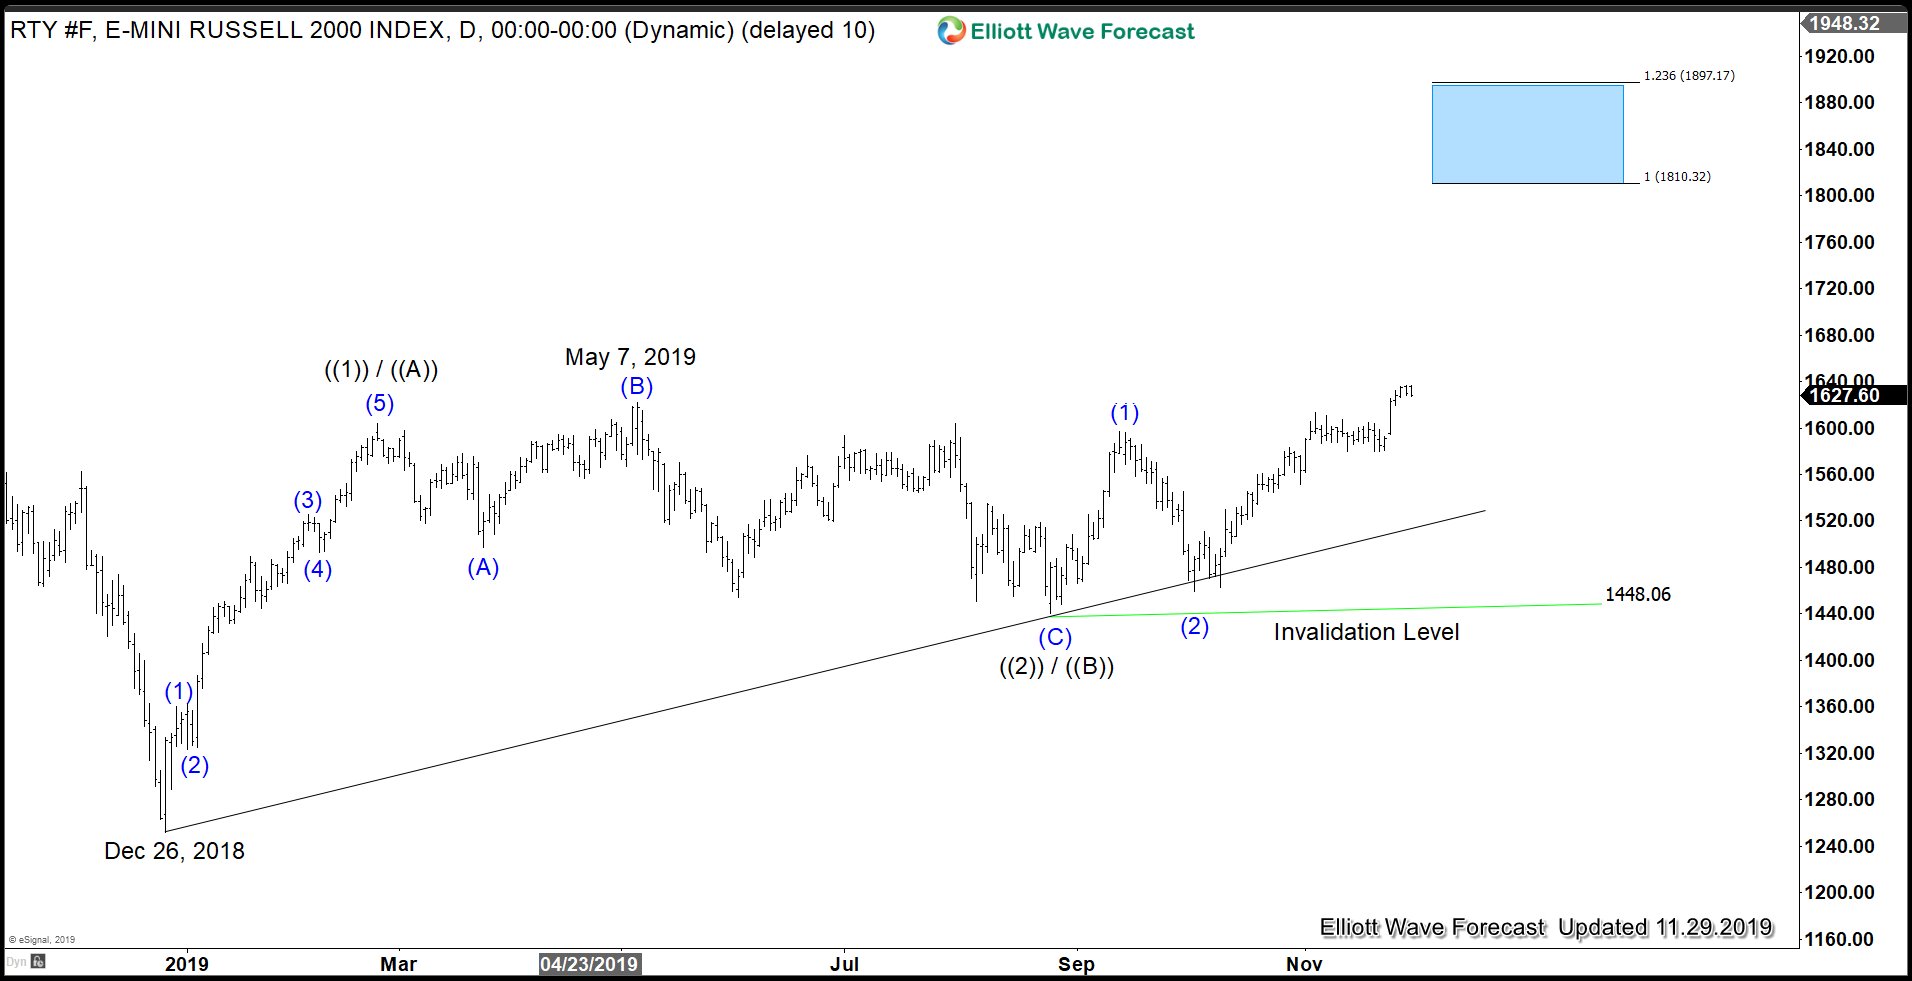
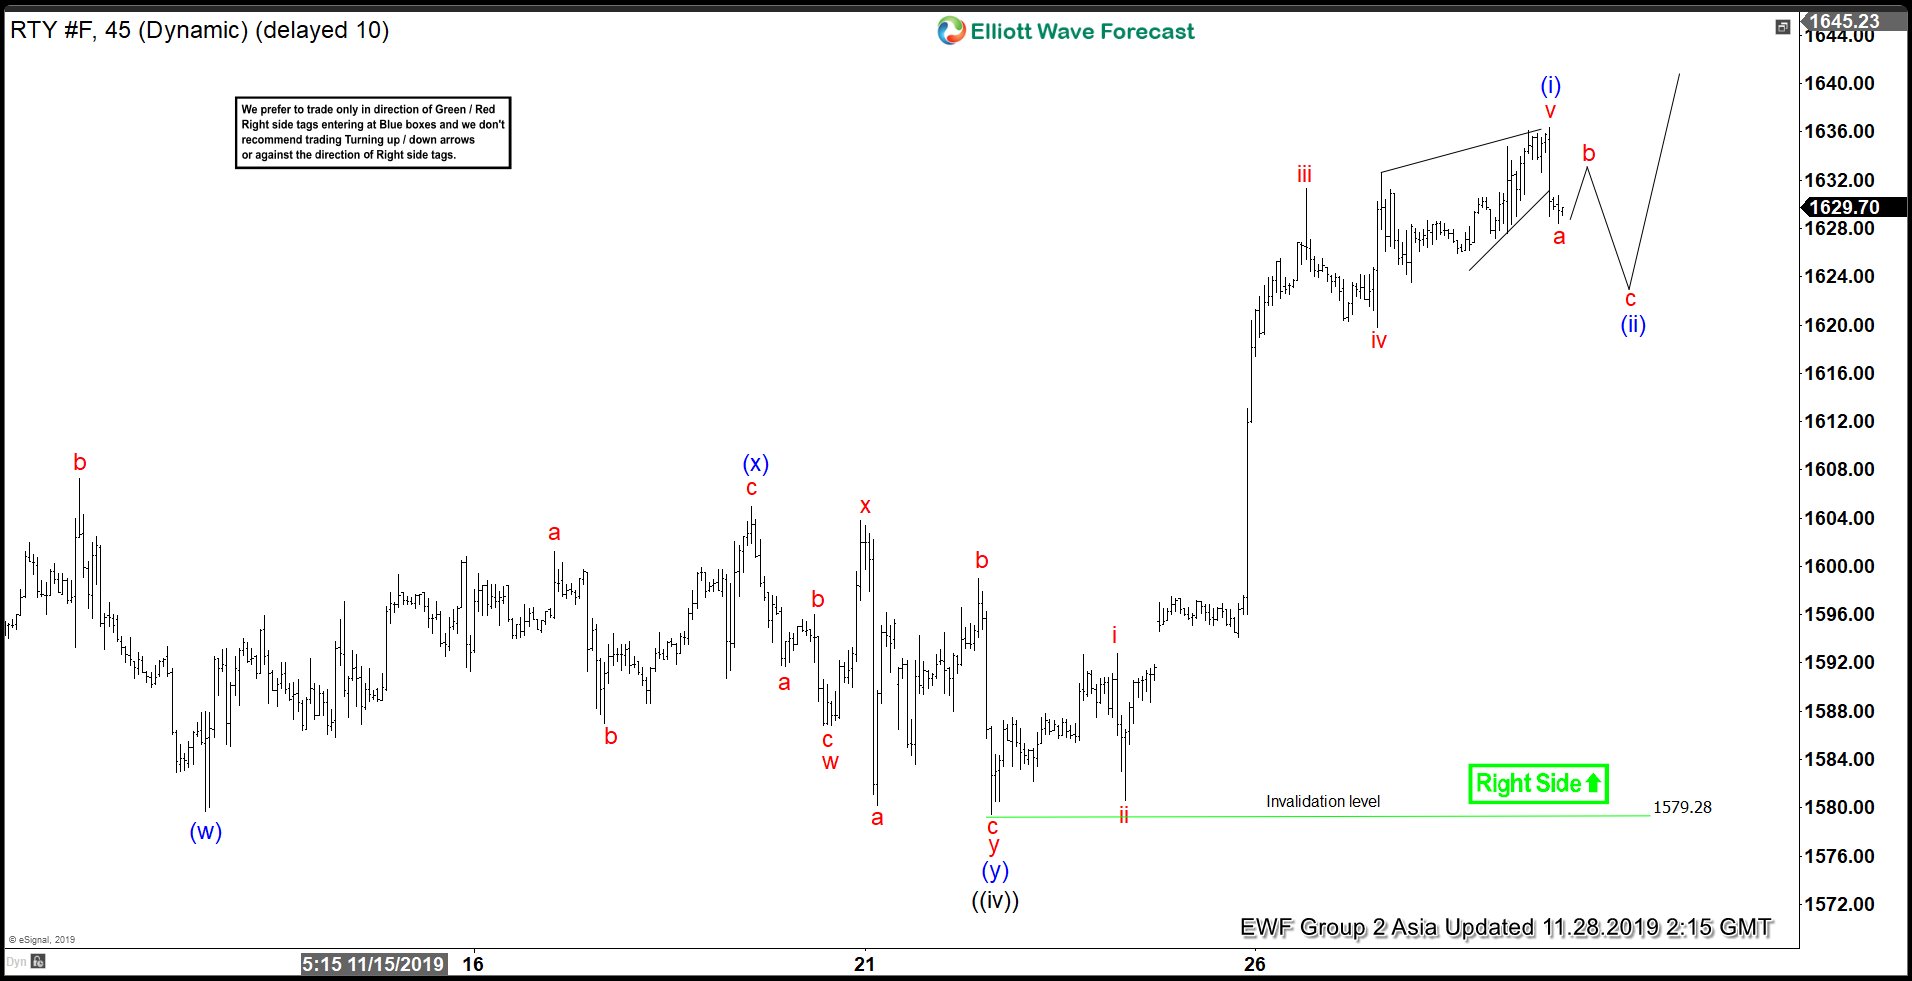
Read MoreRally in in Russell 2000 (RTY_F) from October 3, 2019 low is unfolding as 5 waves impulsive Elliott Wave structure. The chart below shows wave ((iv)) of the impulse ended at 1579.28. Index is currently within wave ((v)) before ending the cycle from October 3 low. Up from wave ((iv)), wave i ended at 1592.8 and wave ii […]