
The Power of 3-7-11 and the Grand Super Cycle: How We Saw the Bullish Turn in April 2025 Back on April 9, 2025, while World Indices were dropping sharply and global sentiment had turned overwhelmingly bearish, we published an article that challenged the fear-driven narrative. We explained why selling was not the right approach and […]
-

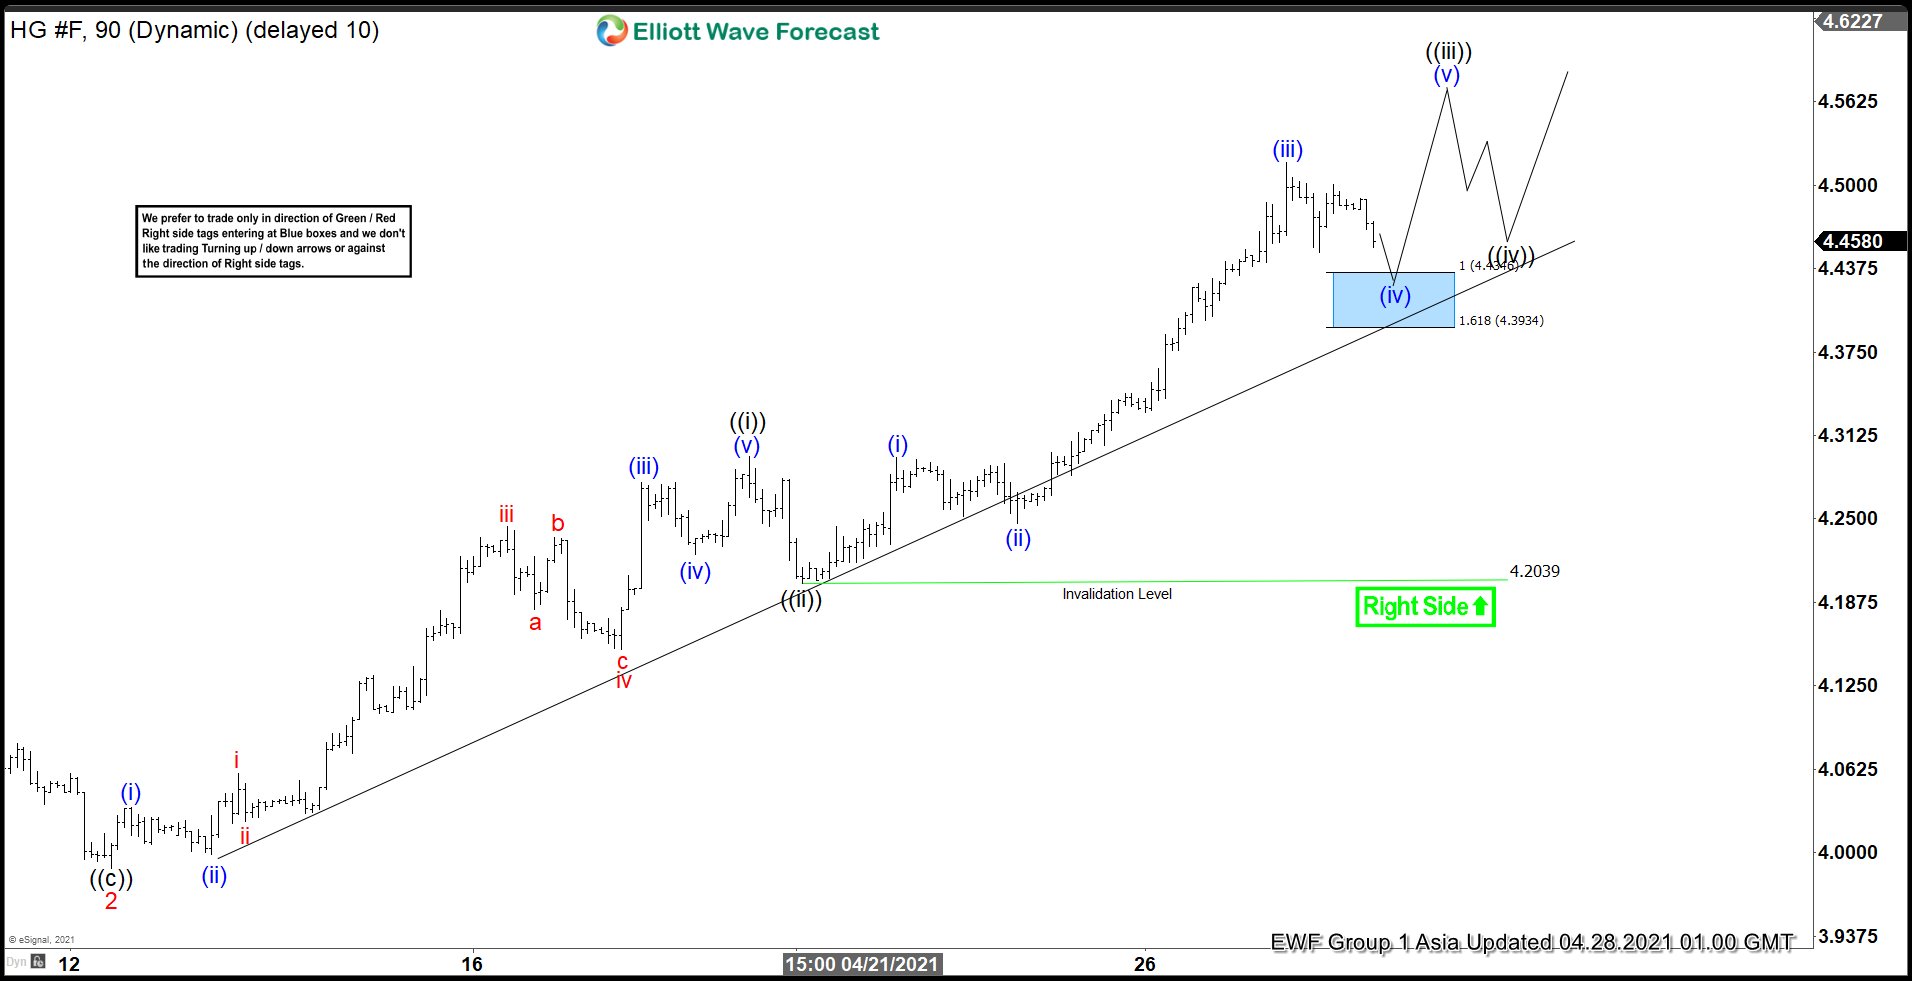
Elliott Wave View: Copper Should Remain Supported
Read MoreCopper has made a 10 year high and should continue to rally higher. This article and video look at the Elliott Wave path of the metal.
-

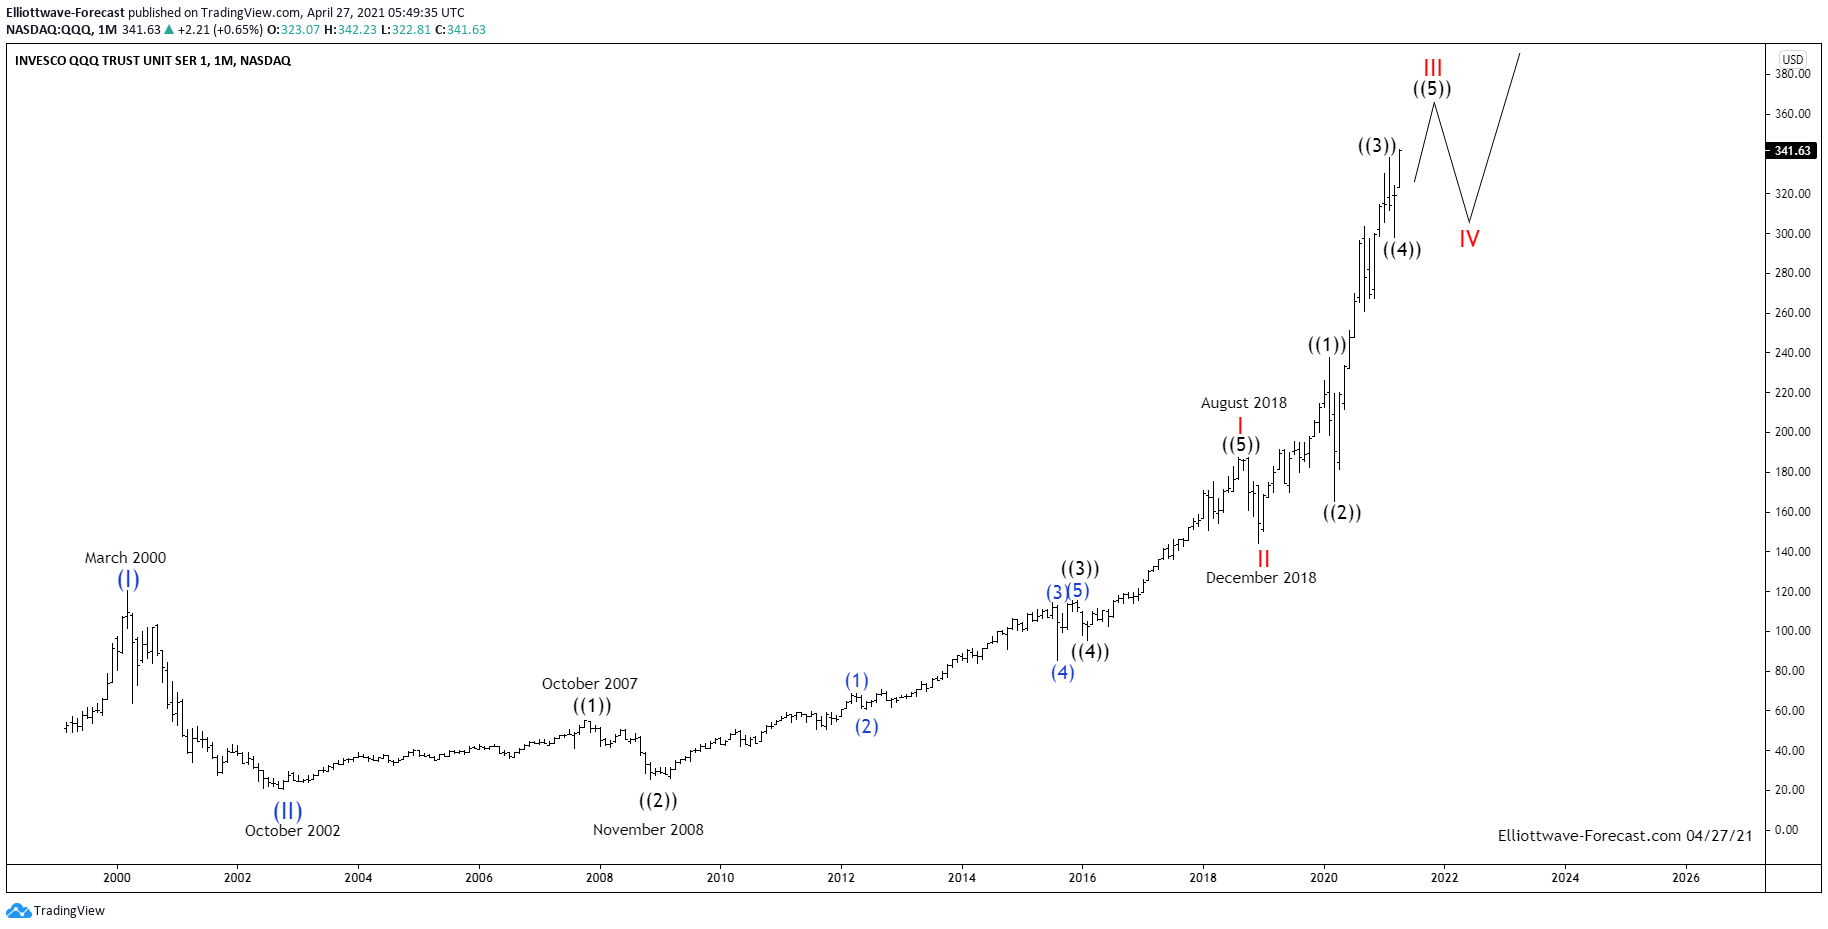
Qubes Long Term Cycles & Elliott Wave $QQQ
Read MoreQubes Long Term Cycles & Elliott Wave $QQQ Firstly the QQQ instrument inception date was in March 1999. That was before it ended a larger cycle up from the all time lows in March 2000. The ETF instrument mirrors the price movement of the Nasdaq. As shown below from the March 2000 highs the instrument […]
-

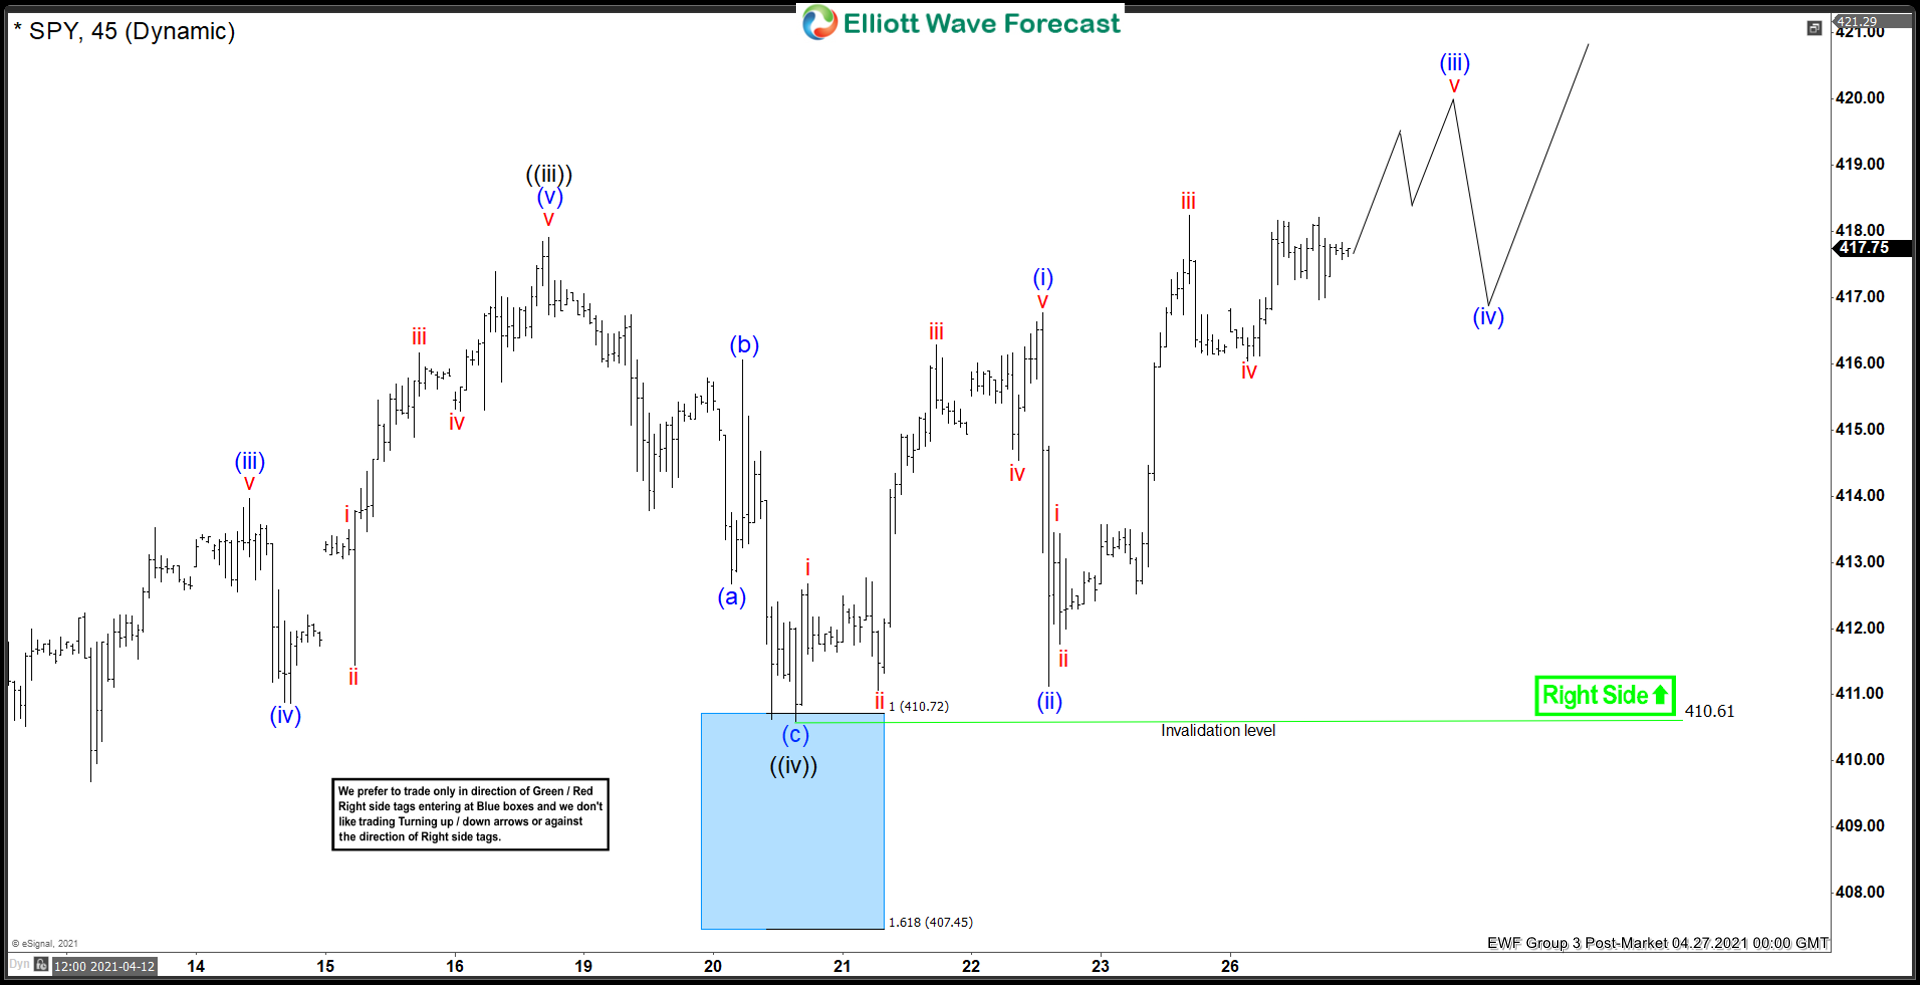
Elliott Wave View: SPY Ending Wave 5 Soon
Read MoreSPY is ending a 5 waves rally from March 5, 2021 low. Short term, it should see more upside. This article & video look at the short term Elliott Wave path.
-

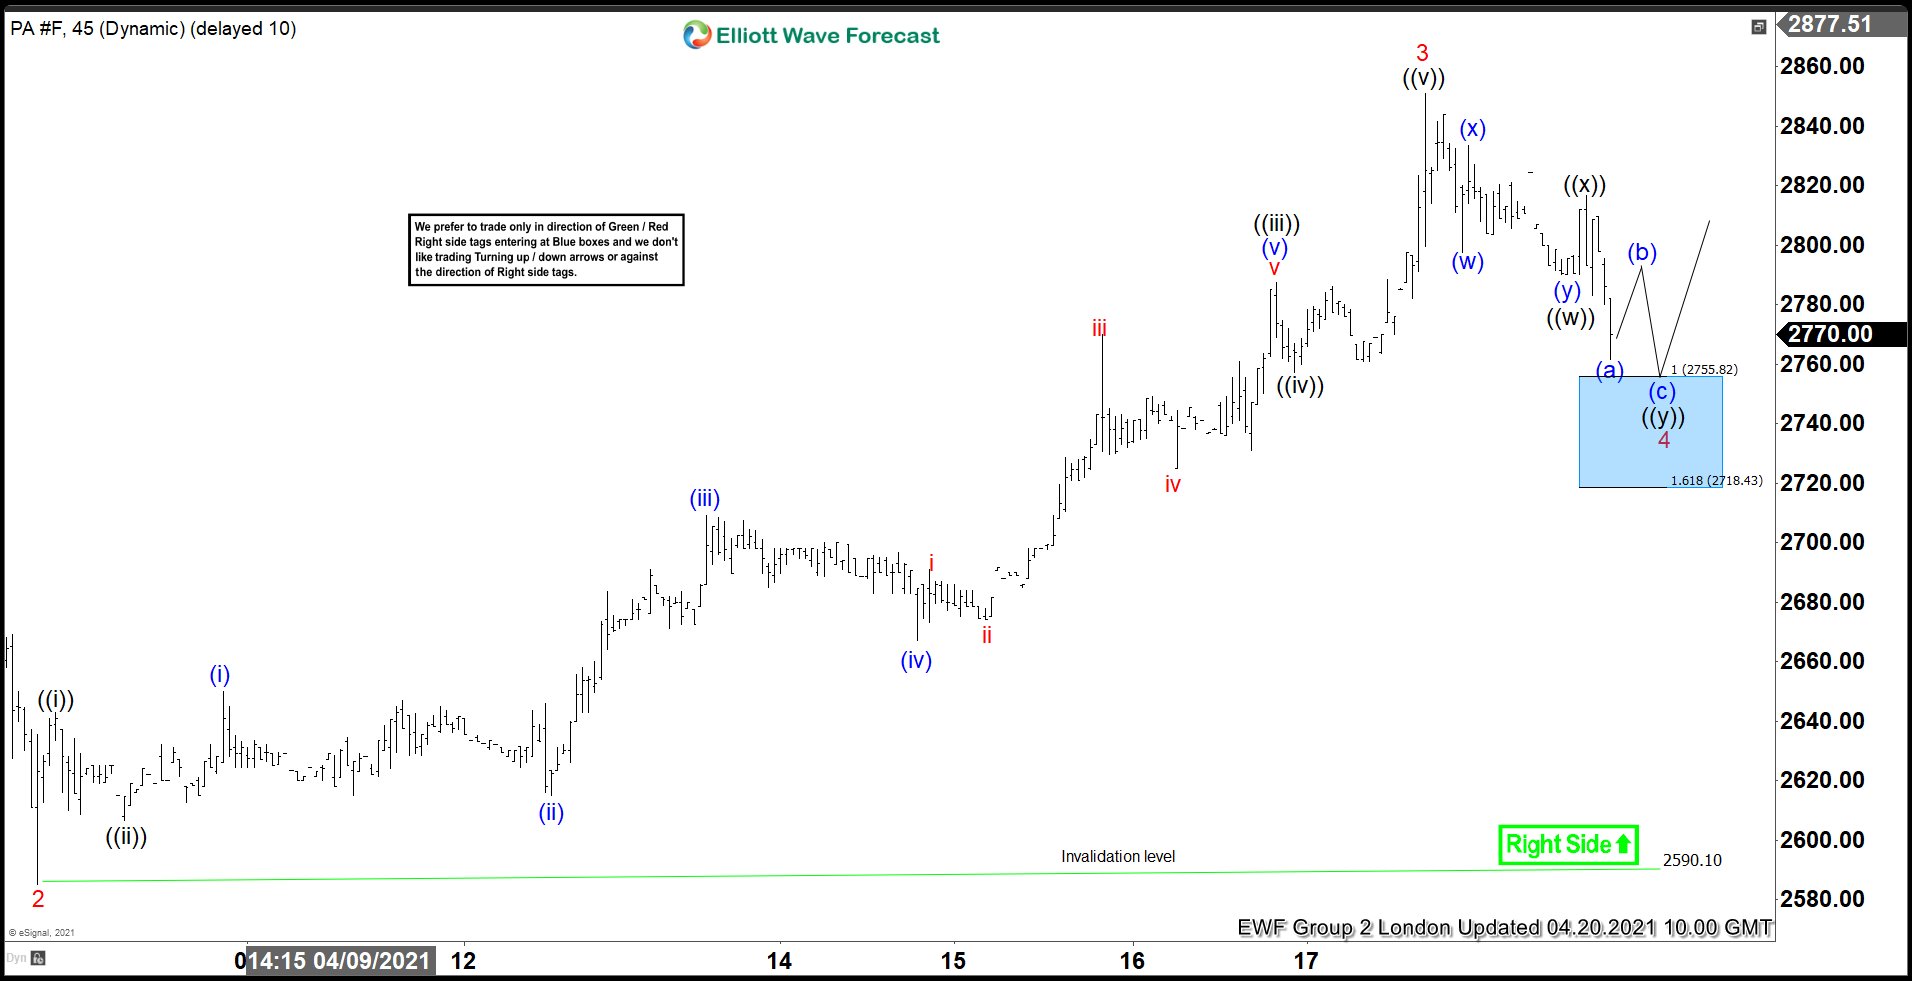
Palladium ($PA_F) Forecasting The Rally & Buying The Dips
Read MoreHello fellow traders. Palladium Futures ( $PA_F ) is another instrument that has given us nice trading opportunity lately . As our members know the commodity is showing impulsive bullish sequence. We recommended members to avoid selling the commodity and keep on buying the dips in 3,7,11 sequences when get chance. In this technical blog we’re going […]