
The Power of 3-7-11 and the Grand Super Cycle: How We Saw the Bullish Turn in April 2025 Back on April 9, 2025, while World Indices were dropping sharply and global sentiment had turned overwhelmingly bearish, we published an article that challenged the fear-driven narrative. We explained why selling was not the right approach and […]
-

Elliott Wave View: Nifty Impulsive Rally Likely Extends
Read MoreShort Term Elliott Wave view in Nifty suggests that decline to 15513.45 on July 28 ended wave 2. The Index has resumed higher in wave 3 with internal subdivision as 5 waves in a lesser degree. Up from wave 2, wave (i) ended at 16359.25, and a pullback in wave (ii) ended at 16162.55. Index resumes higher […]
-

Microsoft $MSFT Forecasting The Rally After Elliott Wave Flat
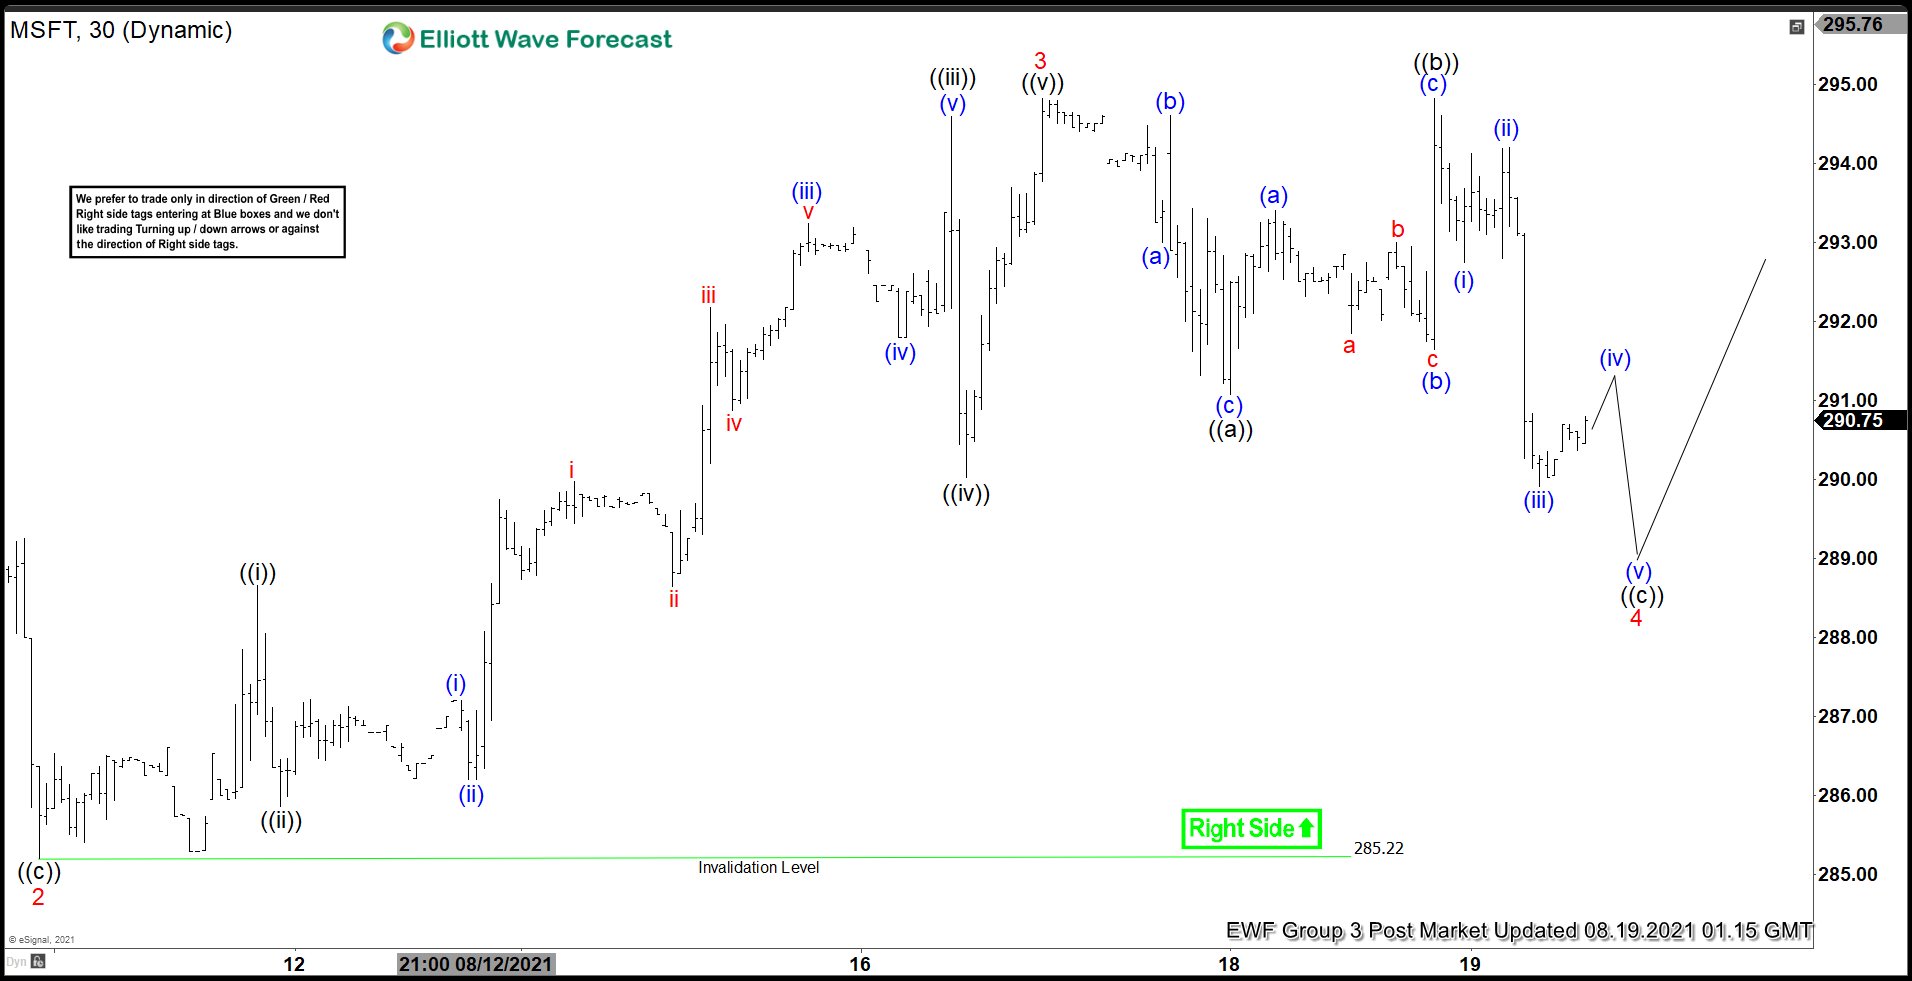
Read MoreHello fellow traders. In this technical blog we’re going to talk about Microsoft $MSFT stock and take a look at the charts presented in members area of the Elliottwave-Forecast. As our members know, Microsoft is showing incomplete bullish sequences , calling the further rally. The stock is bullish against the 268.66 low. Consequently, we advised […]
-

$RIO : Mining Geant Rio Tinto Should Continue Higher
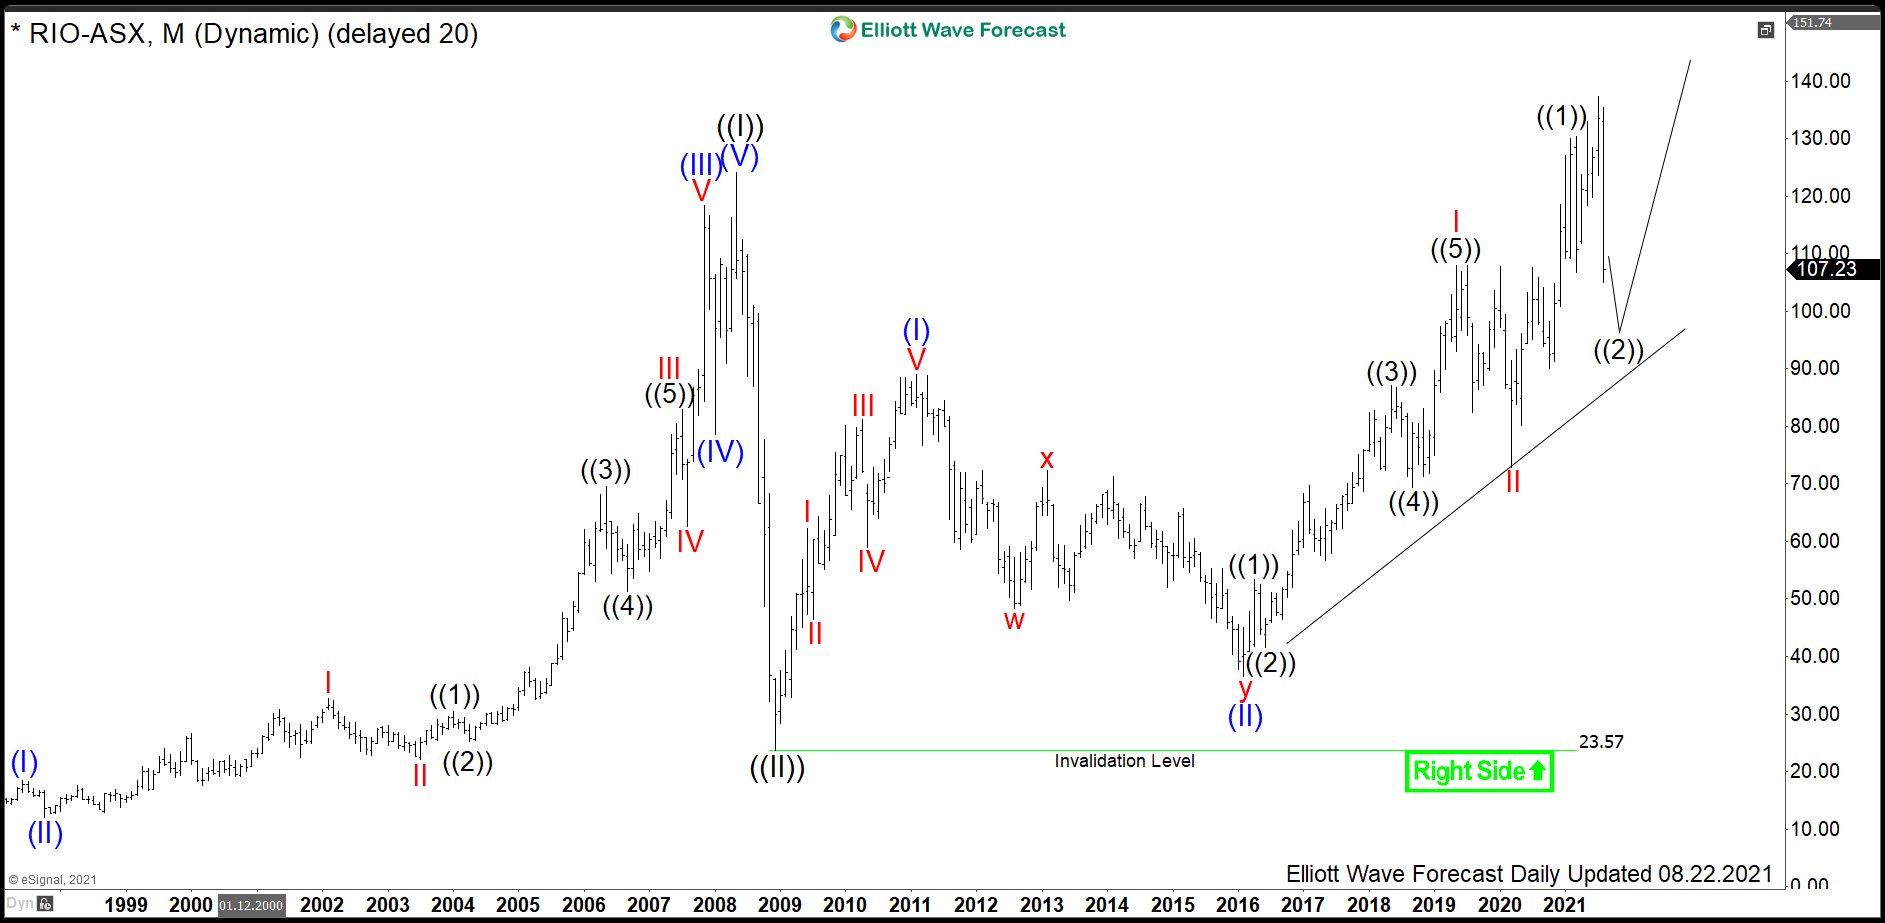
Read MoreRio Tinto Group is the world’s second largest metals and mining corporation which has its headquarters in London and Melbourne. Founded in 1873 and traded under tickers $RIO at LSE, ASE and also in US in form of ADRs, it is a component of both the FTSE100 and ASX200 indices. In terms of operations, Rio Tinto […]
-

12 Best Forex Indicators for Forex Currency Trading
Read MoreOne of the prime concerns of a trader is to decide which is the right time to enter or exit the market. To help determine, Best Forex Indicators are used, which indicate the best time to buy or sell. These indicators help understand the complex market movements and assist traders in understanding the momentum of […]