
The Power of 3-7-11 and the Grand Super Cycle: How We Saw the Bullish Turn in April 2025 Back on April 9, 2025, while World Indices were dropping sharply and global sentiment had turned overwhelmingly bearish, we published an article that challenged the fear-driven narrative. We explained why selling was not the right approach and […]
-

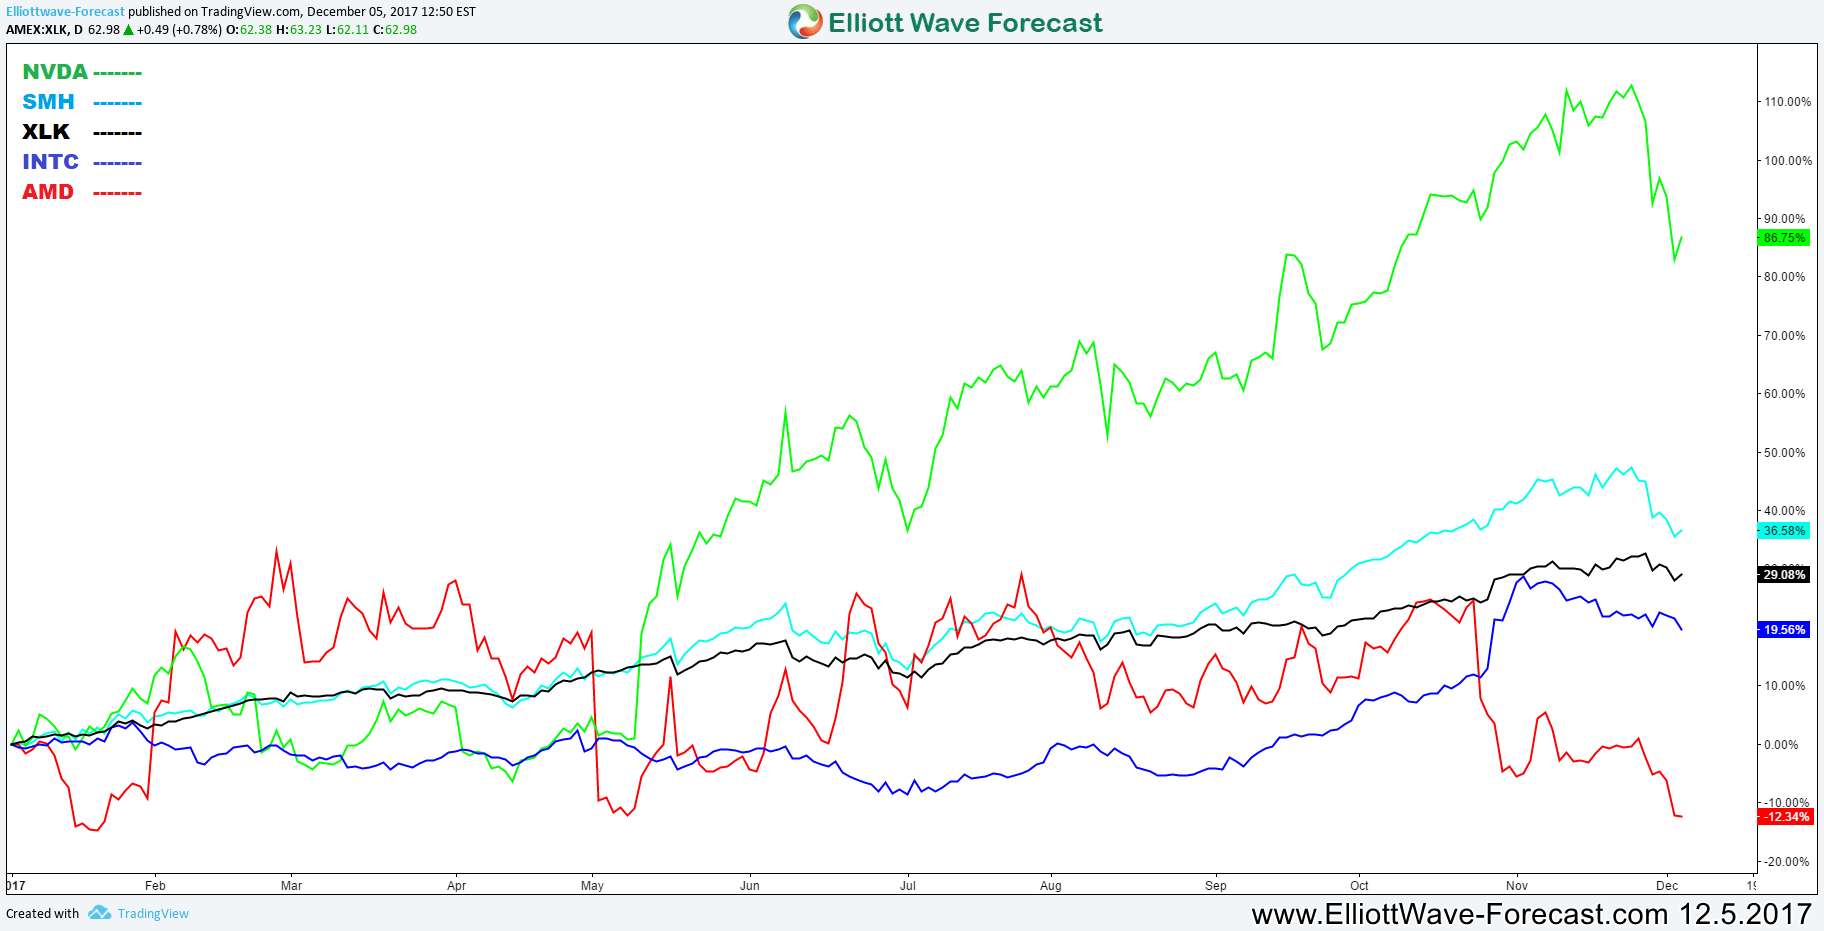
Nvidia NVDA Correction is Around the Corner
Read MoreThe American semiconductors company Nvidia (NASDAQ: NVDA) is specialized is designing graphics processing units (GPUs) for the gaming, cryptocurrency, and professional markets, as well as system on a chip units (SoCs) for the mobile computing and automotive market. Nvidia is considered as one of the strongest technology companies this year and its stock NVDA enjoyed a great rally this […]
-

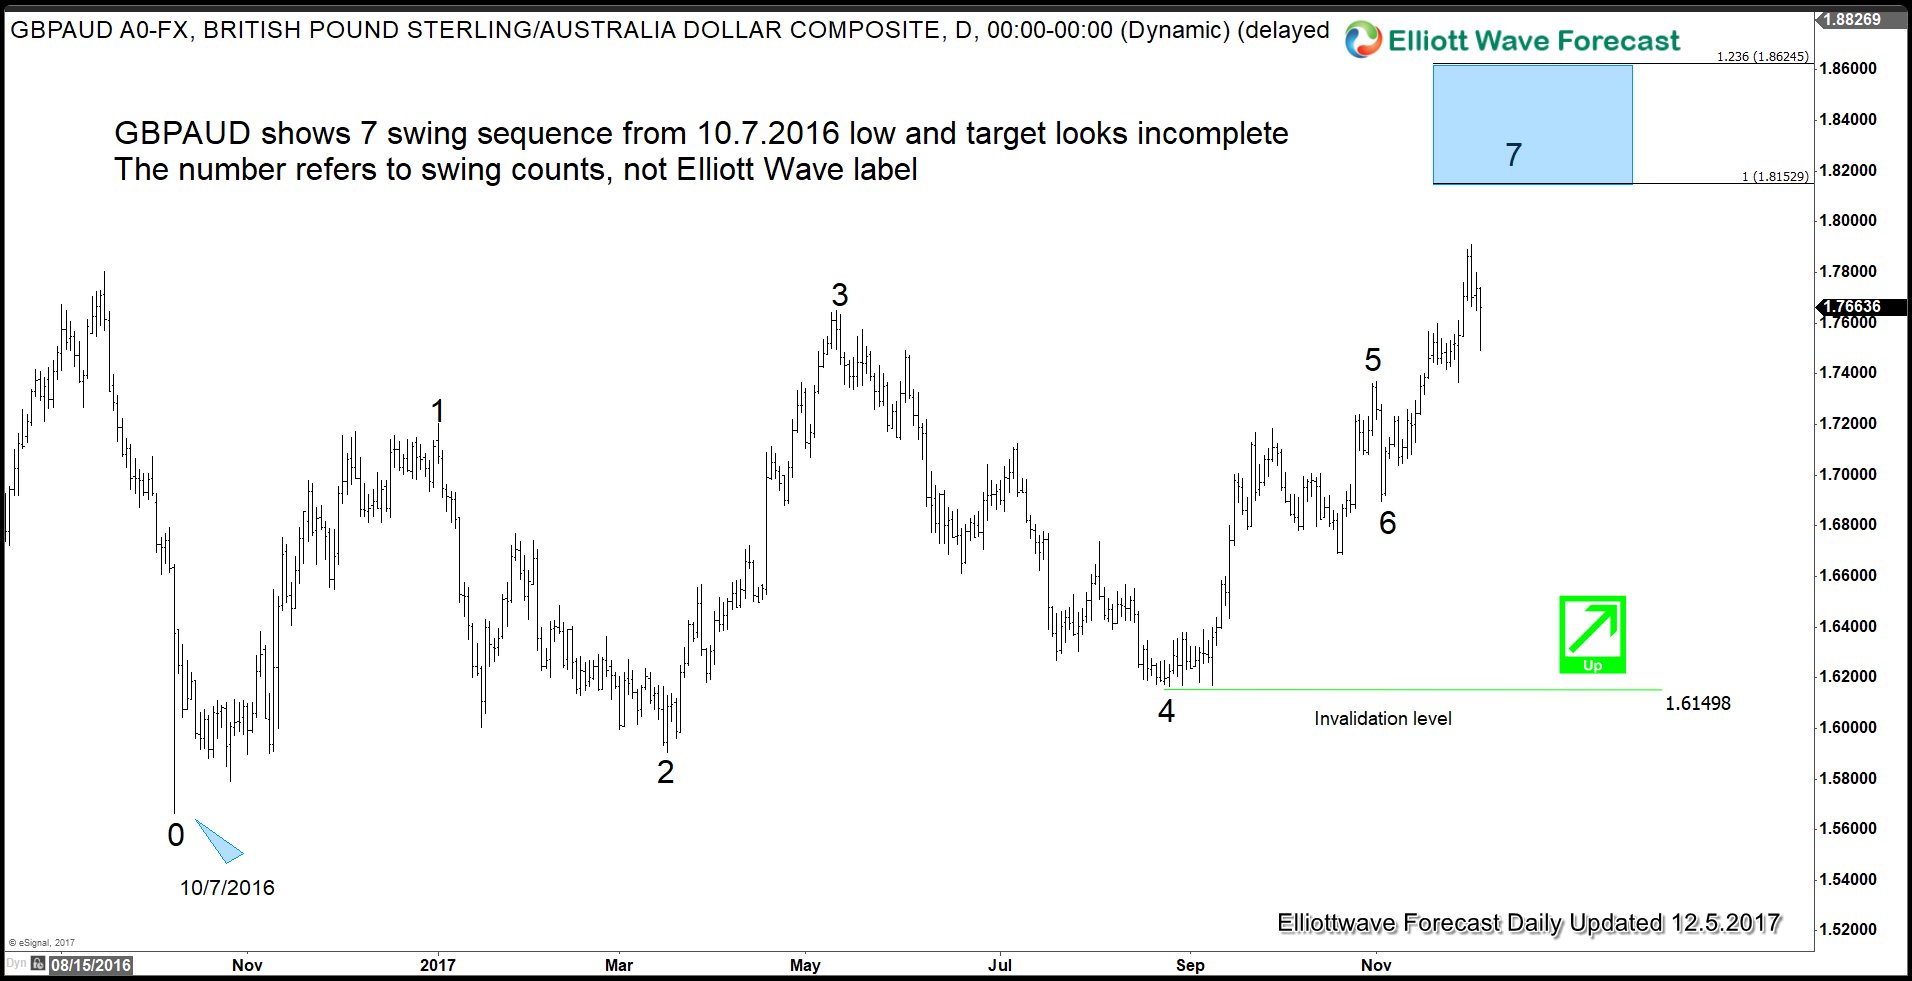
Sterling Volatility In Crucial Week of Brexit Talk
Read MoreSterling fell versus the dollar earlier this week as Brexit talk between the UK and EU falter at the last minute. British Prime Minister Theresa May is on the race to break the deadlock on the issue of Irish border. Irish border is one of the three key issues required to be settled before the U.K can […]
-

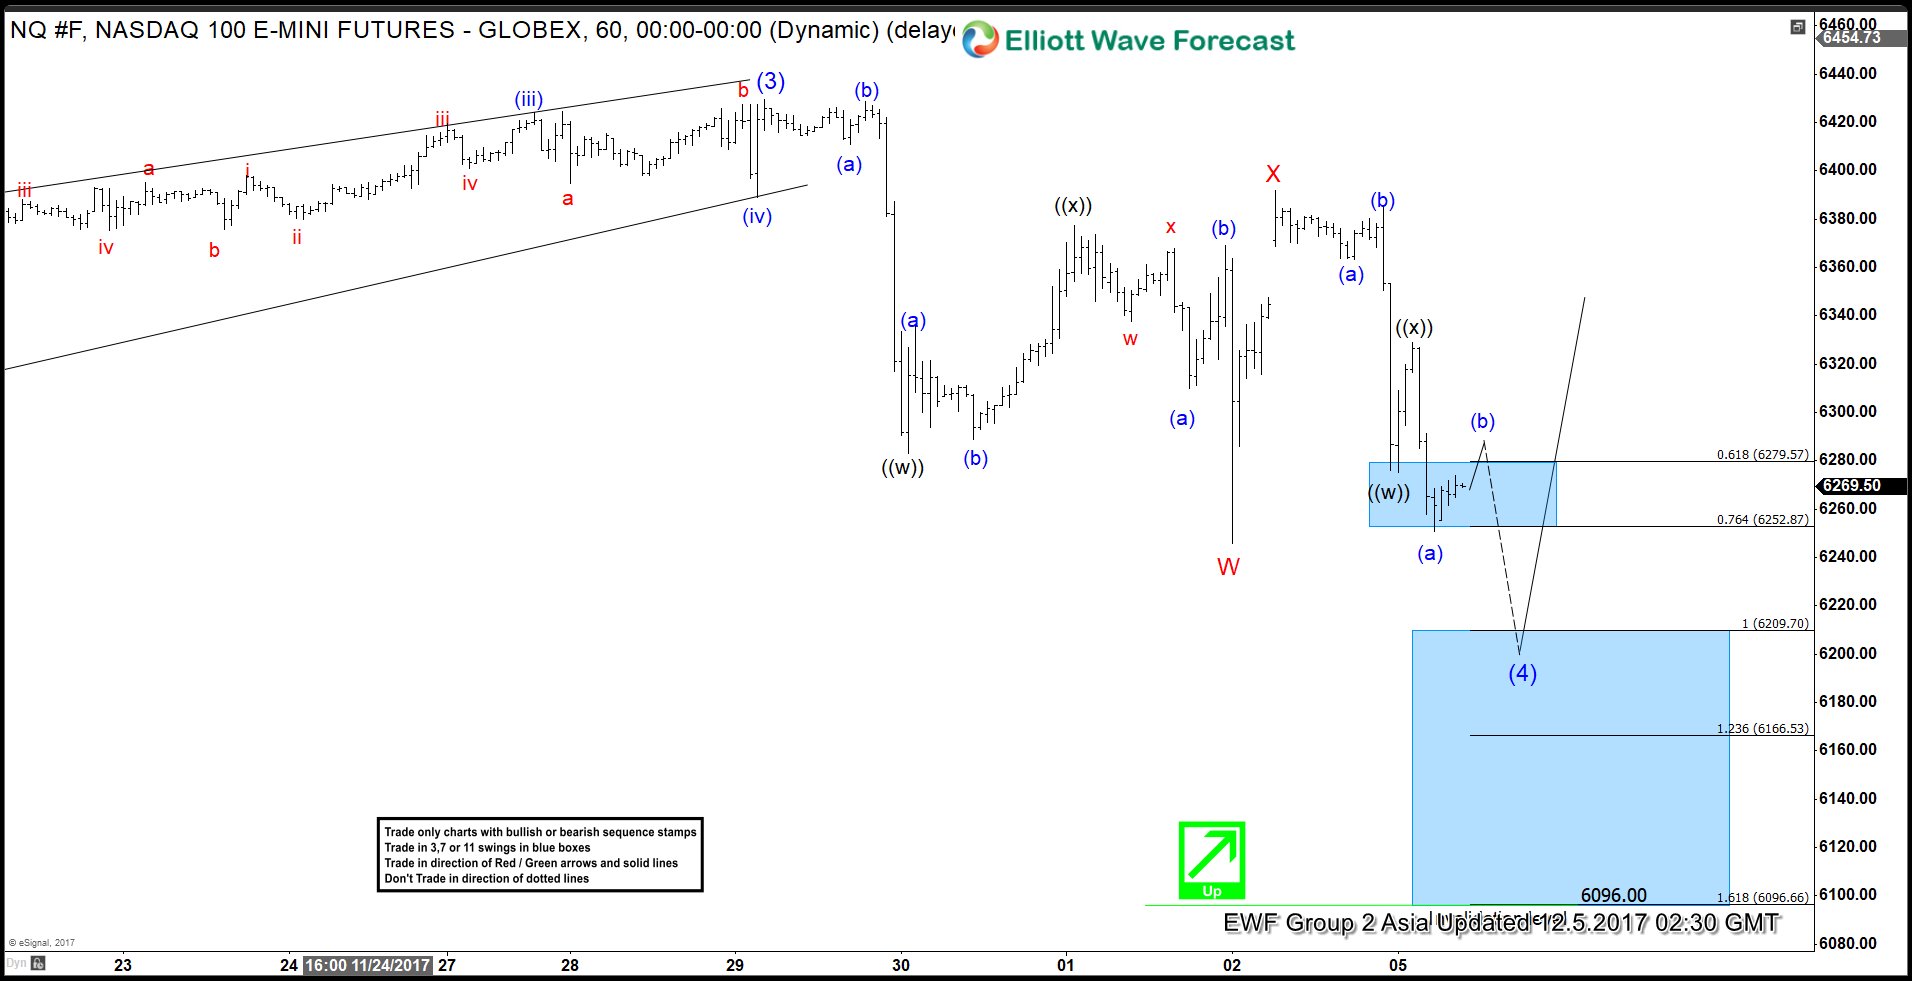
Nasdaq Short Term Elliott Wave Analysis
Read MoreNasdaq Short term Elliott Wave view suggests that the rally to 6429.5 ended Intermediate wave (3). Intermediate wave (4) pullback is currently in progress to correct cycle from 8/21 low (5753.6) in 3, 7, or 11 swing before Index resumes the rally. Subdivision of Intermediate wave (4) is unfolding as a double three Elliott wave structure where Minor wave W ended […]
-

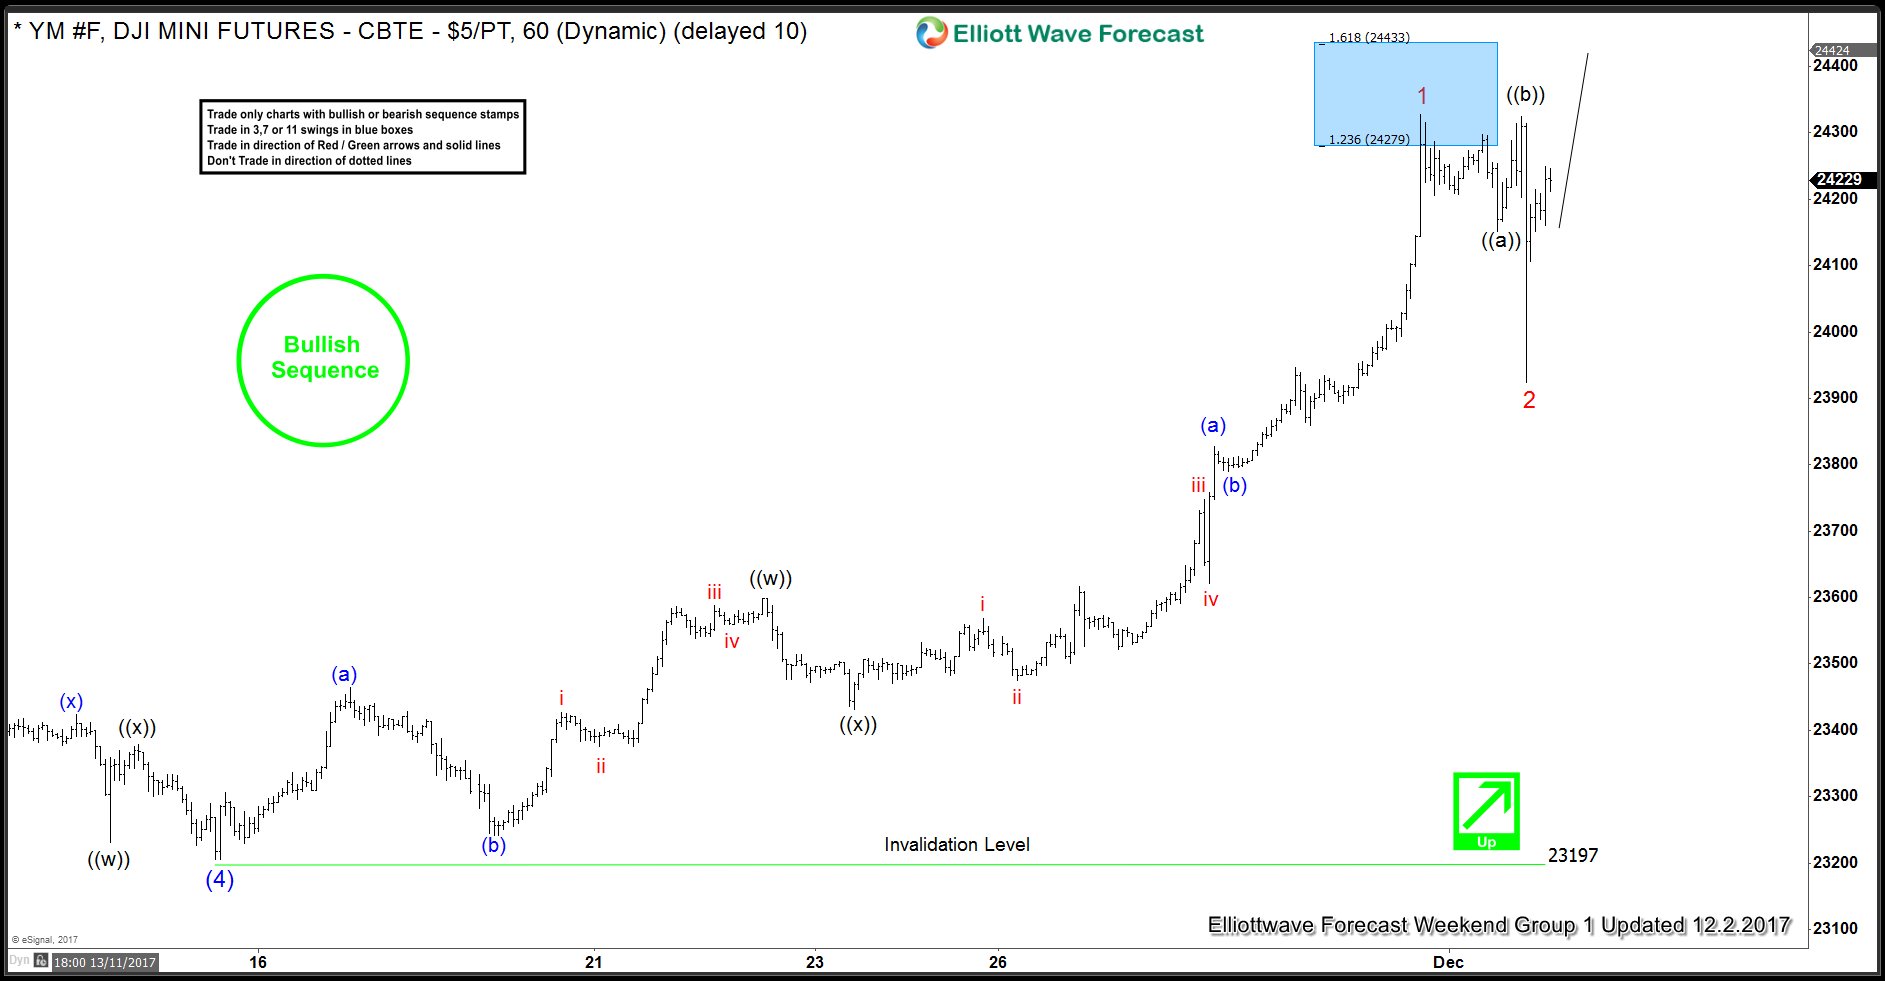
Dow Future Elliott Wave Analysis 12-3-2017
Read MoreDow Future Short term Elliott Wave view suggests that Intermediate wave (4) ended at 23205. Intermediate wave (5) rally is unfolding as a 5 waves diagonal Elliott wave structure. Minor wave 1 ended at 24328 and subdivided as a double three where Minute wave ((w)) ended at 23599, Minute wave ((x) ended at 23432, and Minute wave […]