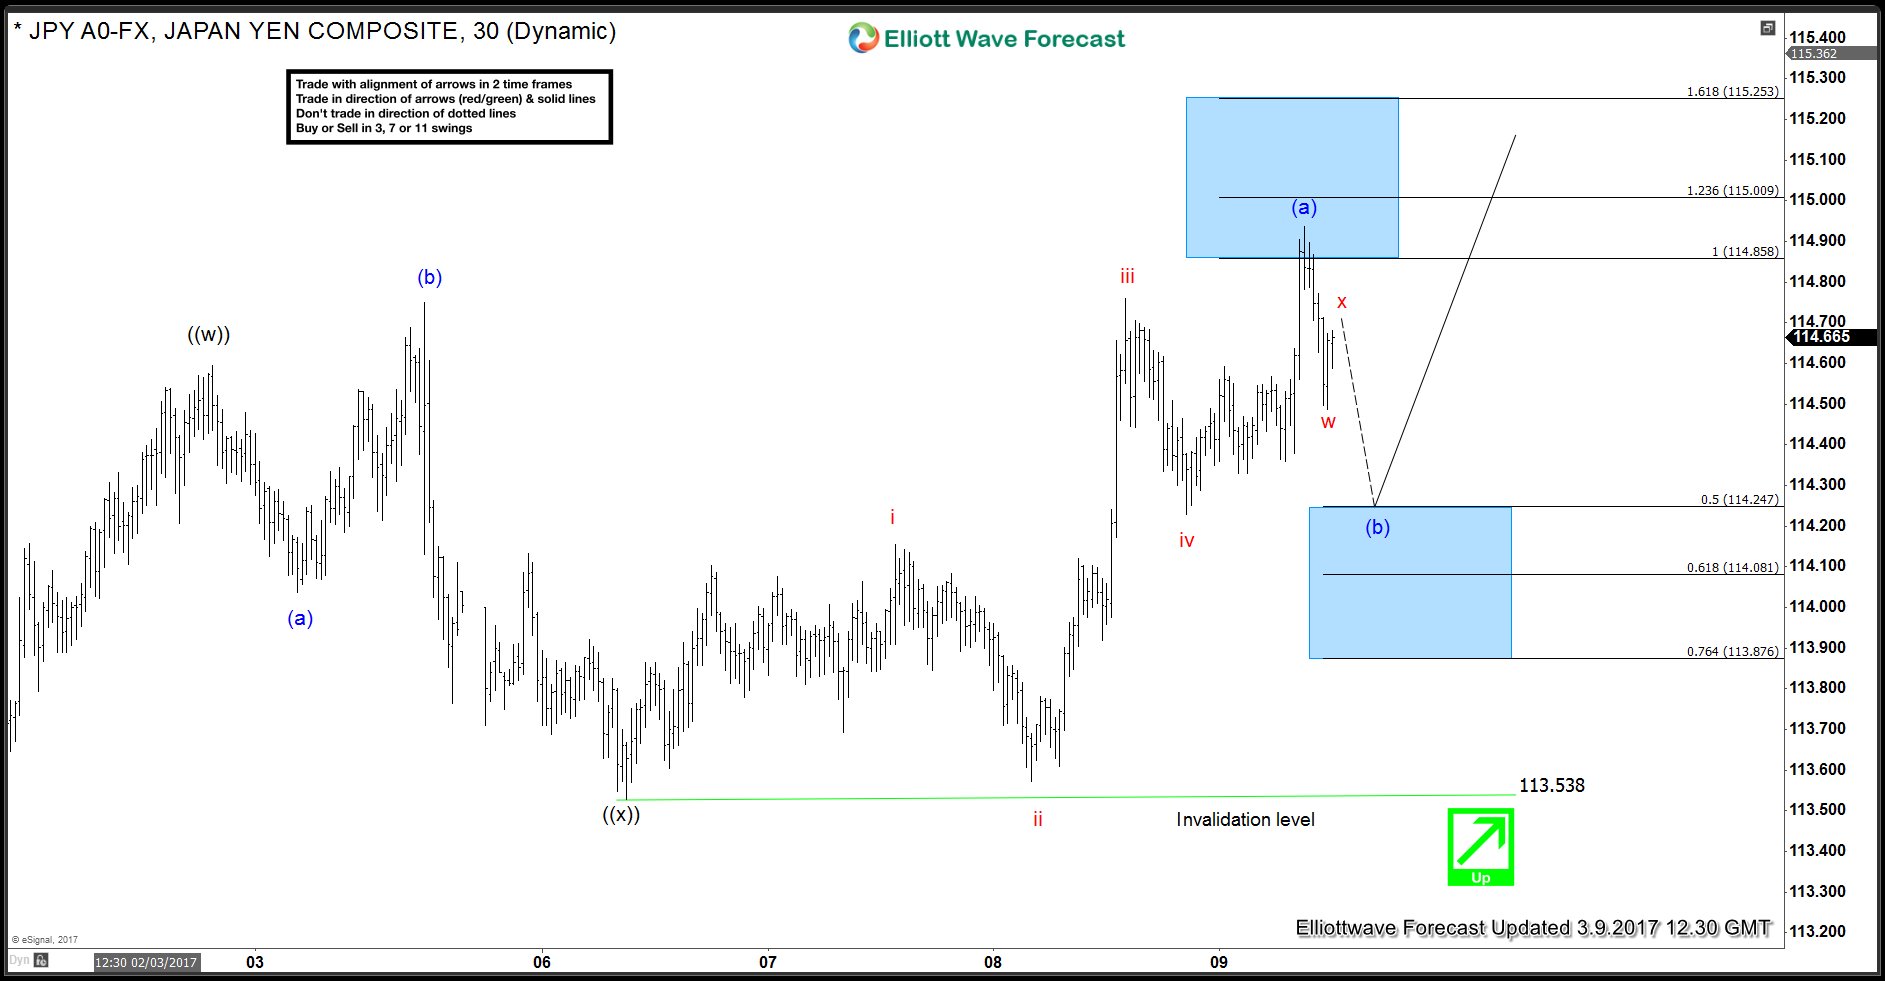
JPY (USDJPY) made a new high above last Friday’s peak and now seems to be pulling back. Move up from 113.53 ((x)) low could be viewed as a 5 swing Leading Diagonal Elliott Wave structure. There is RSI divergence (not showing) between red wave iii and blue (a) which further supports the idea of JPY move up from 113.53 low being a diagonal structure. As per Elliott Wave theory, after a 5 wave move up or diagonal structure higher completes, pair should make a corrective pull back before rallying again. Decline from 114.93 -114.48 could be viewed as just the first leg of proposed wave (b) pull back. As current bounce stays below 114.93, pair has scope to make another push lower to complete wave (b) pull back before it turns higher again in wave (c) towards 115.30 -116.11 area. As pair is showing 5 waves up from 113.53 low, we don’t like selling the pair in proposed wave (b) pull back and expect it to find intra-day buyers in the dip as far as price stays above 113.53 low and the pivot there remains intact. Break above 114.93 would suggest wave (b) completed already at 114.48 and pair has started the next leg higher in wave (c) toward the above mentioned area.
JPY (USDJPY) 1 Hour Chart