
The Power of 3-7-11 and the Grand Super Cycle: How We Saw the Bullish Turn in April 2025 Back on April 9, 2025, while World Indices were dropping sharply and global sentiment had turned overwhelmingly bearish, we published an article that challenged the fear-driven narrative. We explained why selling was not the right approach and […]
-

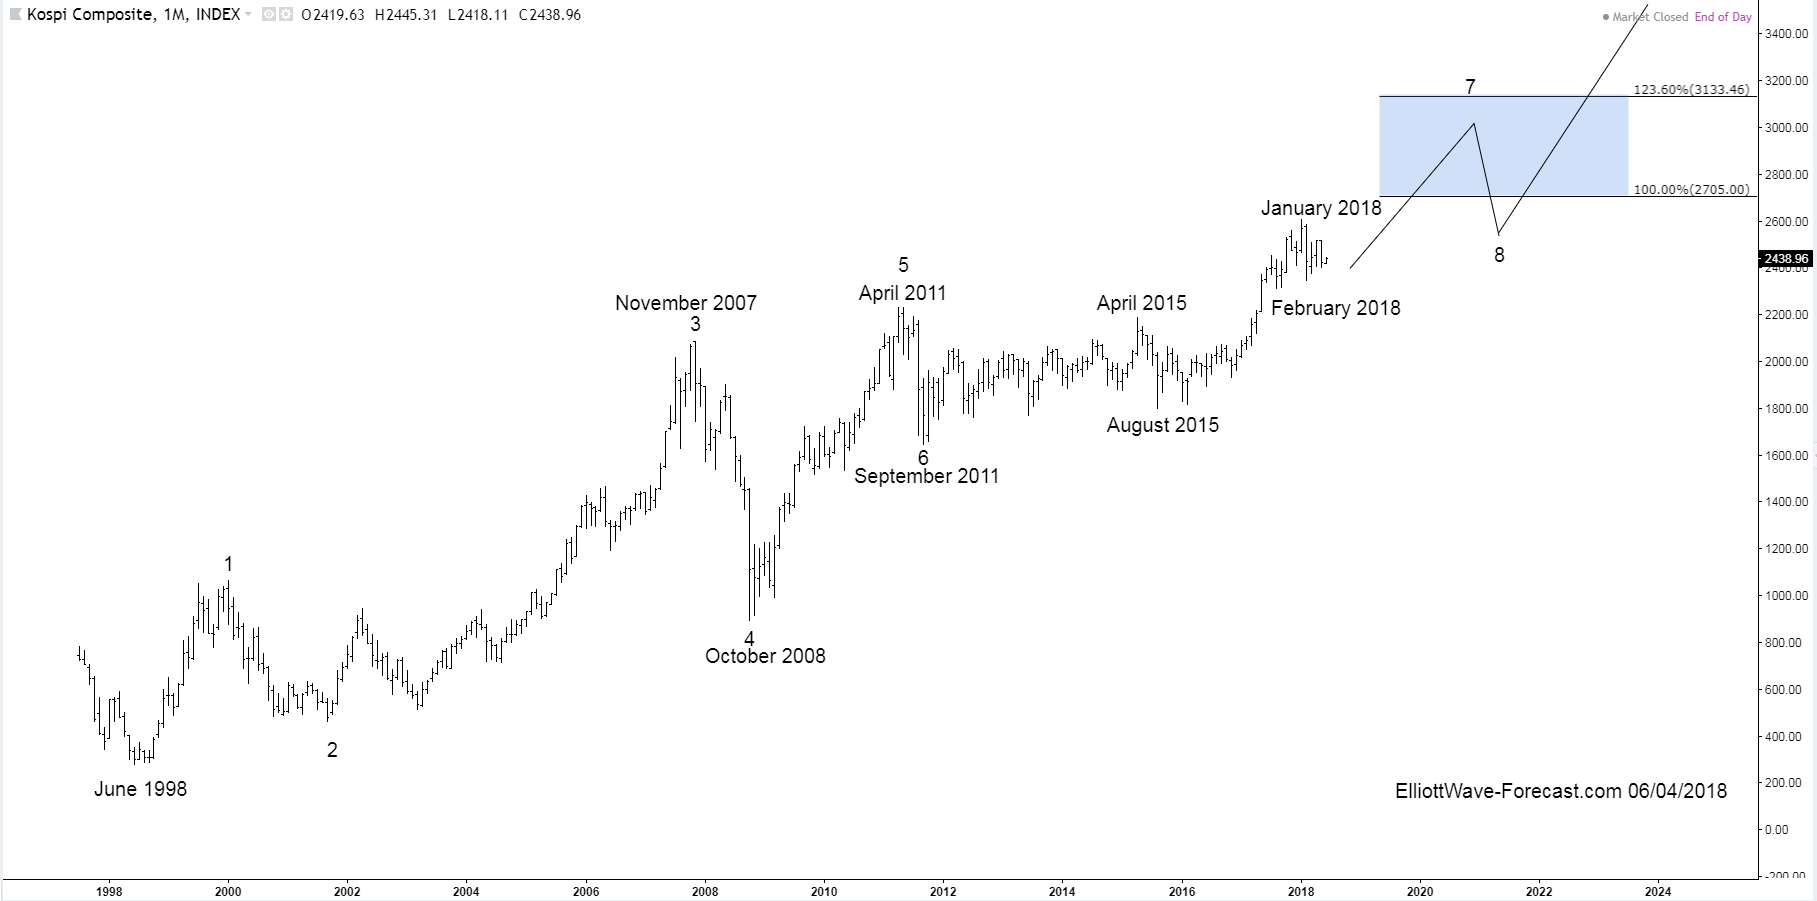
KOSPI Index Long Term Bullish Cycles
Read MoreFirstly the KOSPI Index in the long term has been trending higher with other world indices since inception in 1983. The index began with a base value set at 100 and trended higher until it ended that cycle in 1994. The index then corrected that cycle with the dip into 1998 lows during the Asian Financial […]
-

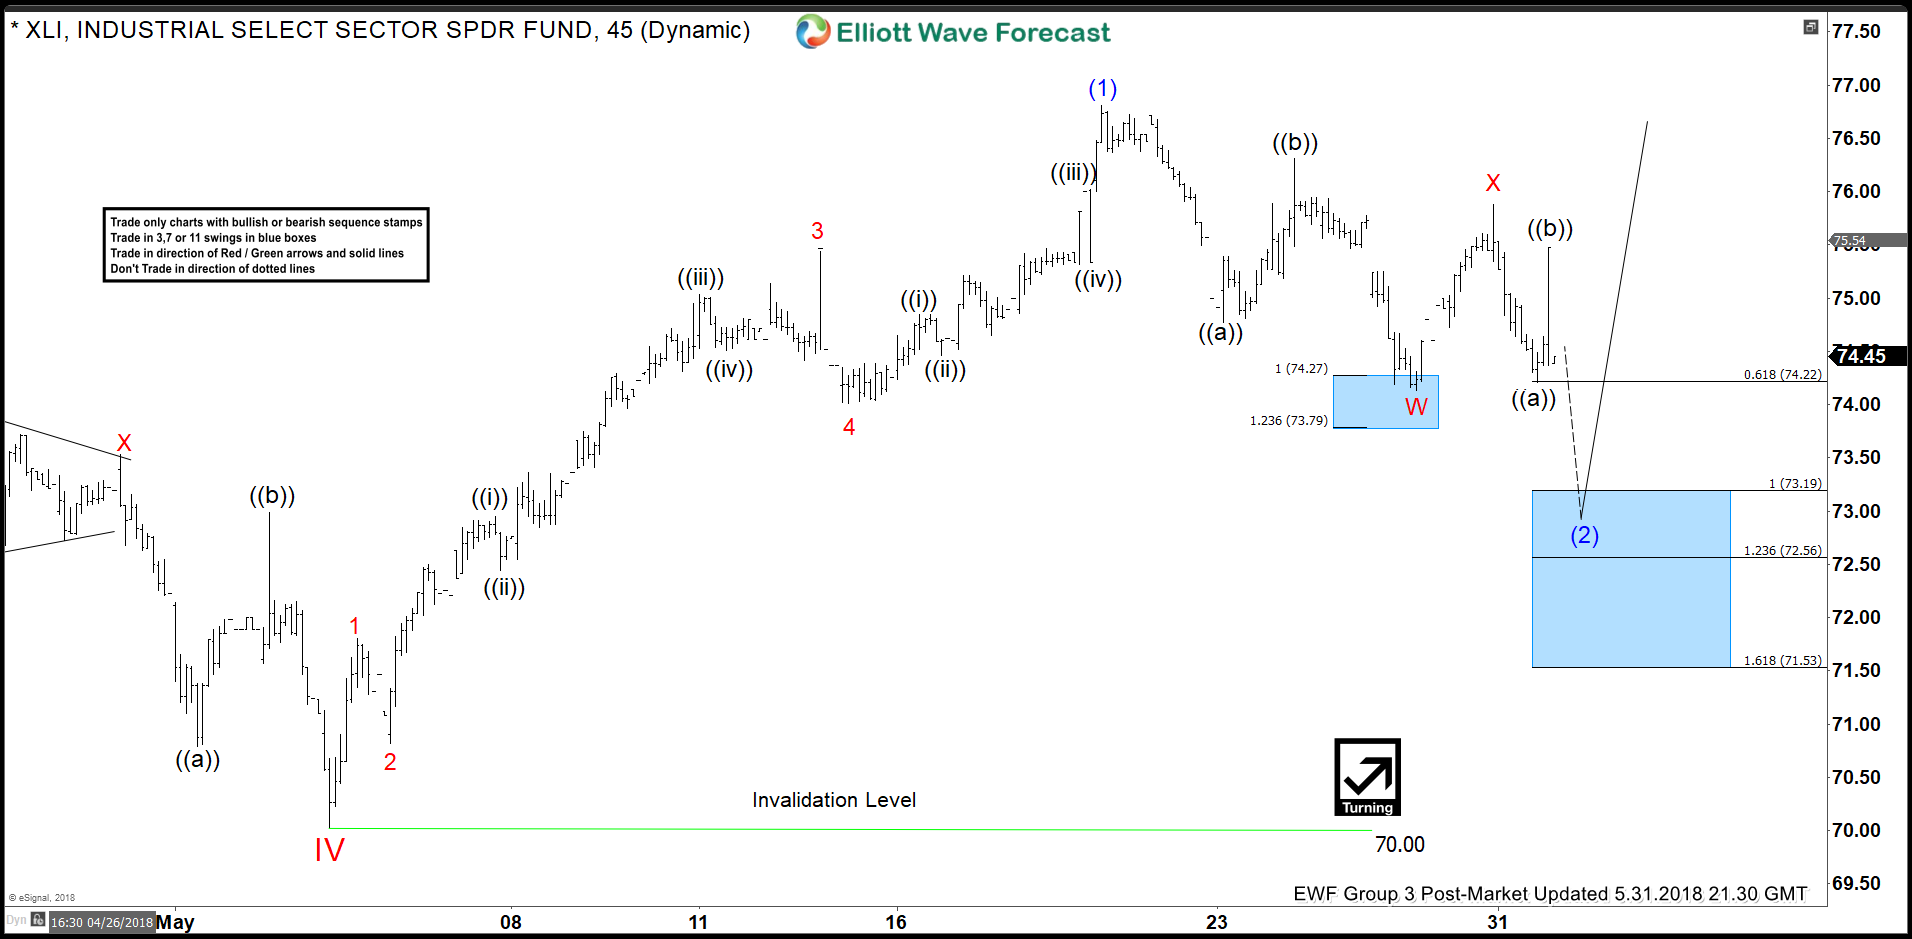
XLI Elliott Wave View: Dips Can Remain Supported
Read MoreXLI: Industrial sector ETF short-term Elliott wave view suggests that the decline to 70$ on May 03 low ended cycle degree wave IV pullback. Above from there, the instrument rallied higher as an impulse and has scope to resume the cycle degree wave V higher. In an impulse structure, the subdivision of wave 1, 3, and 5 […]
-

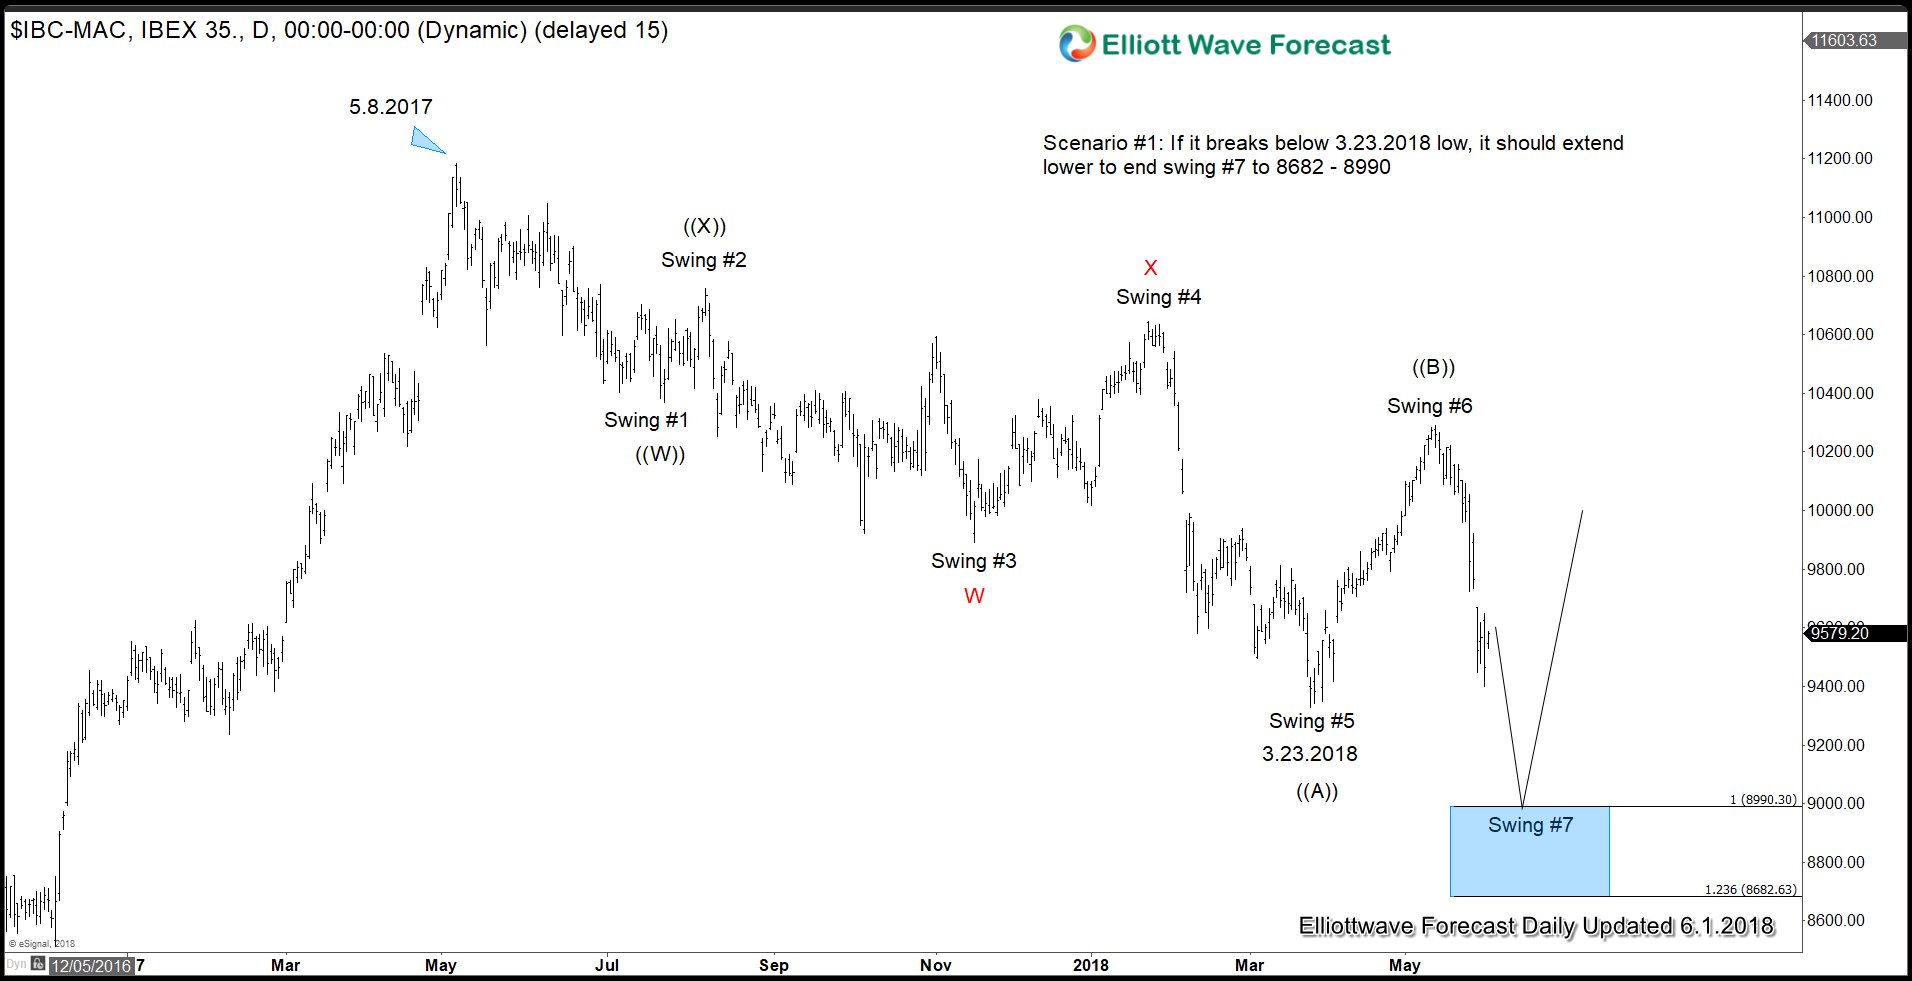
European Political Turmoil Headwind to Stock Market
Read MoreMost World Indices spend time trading sideways in 2018. There are some exceptions such as FTSE from the U.K. and Russel from the U.S. which have been able to make a new high. Several factors however could slow down the move higher in Stock Market and even make the weakest among the group to turn […]
-

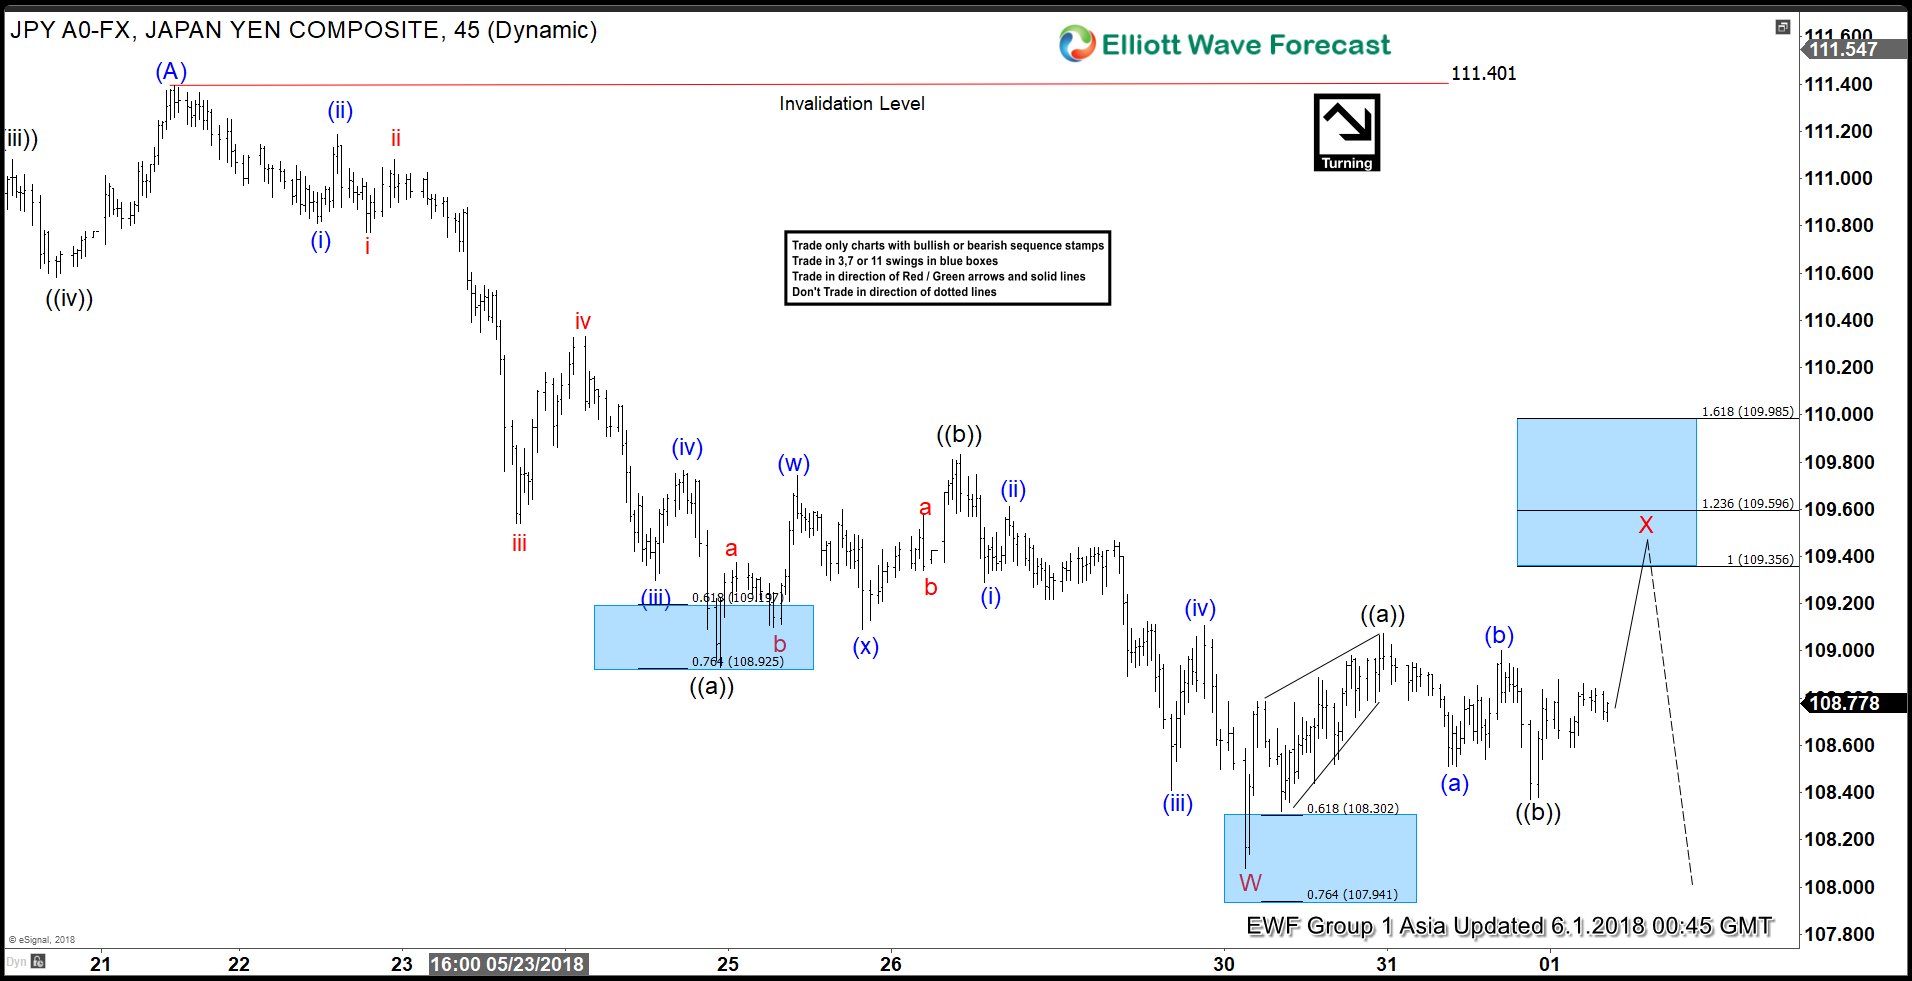
USDJPY Elliott Wave view: Calling For Bounces To Fail Ahead of NFP?
Read MoreUSDJPY Short-term Elliott Wave view suggests that the rally to 111.40 on May 21 ended intermediate wave (A) as a Diagonal structure coming from March 26 low (104.52) cycle. Pair is currently correcting cycle from 3/26 low within Intermediate wave (B). The pullback shows overlapping price structure suggesting that it is taking the form of a […]