
The Power of 3-7-11 and the Grand Super Cycle: How We Saw the Bullish Turn in April 2025 Back on April 9, 2025, while World Indices were dropping sharply and global sentiment had turned overwhelmingly bearish, we published an article that challenged the fear-driven narrative. We explained why selling was not the right approach and […]
-

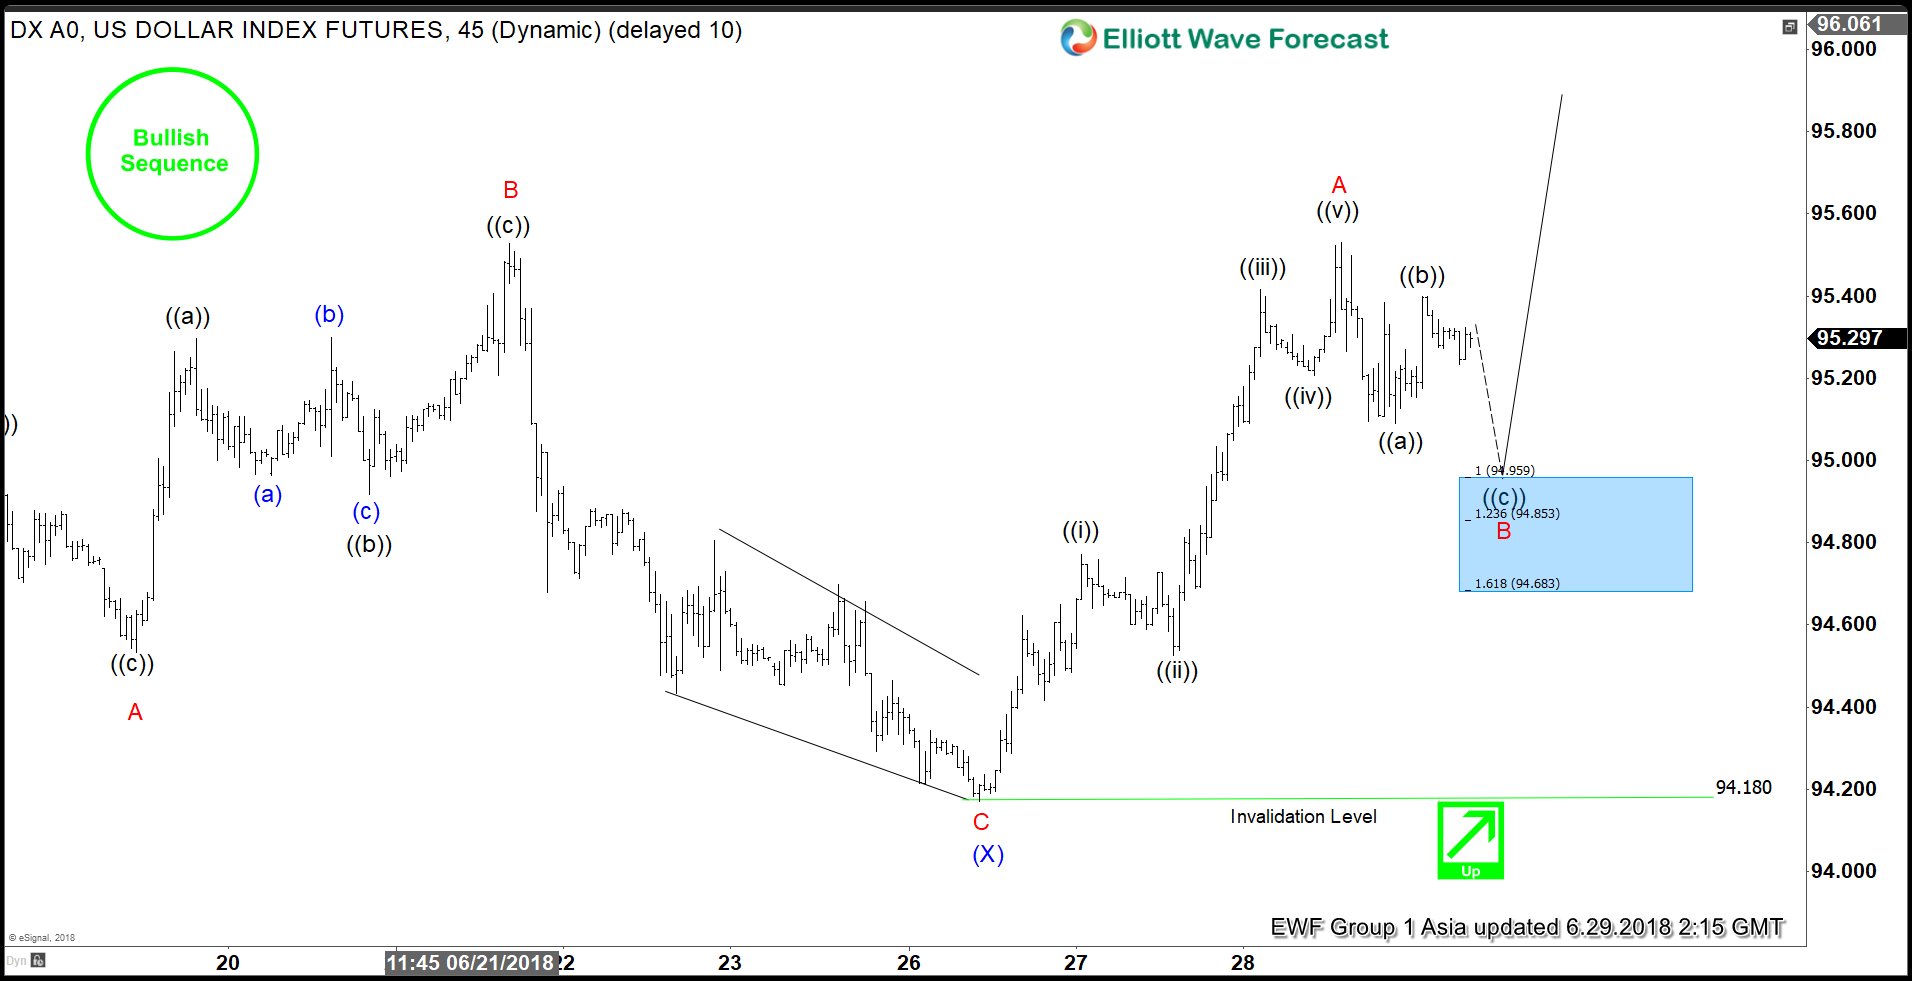
USDX Elliott Wave Analysis: Bullish Sequence Calling Higher
Read MoreUSDX short-term Elliott Wave view suggests that the decline to 94.18 on 6/25 low has ended correction to the cycle from 6/7/2018 low as Intermediate wave (X). The internals of that pullback unfolded as a Flat correction where Minor wave A ended in 3 swings at 94.53, Minor wave B ended in 3 swings at […]
-

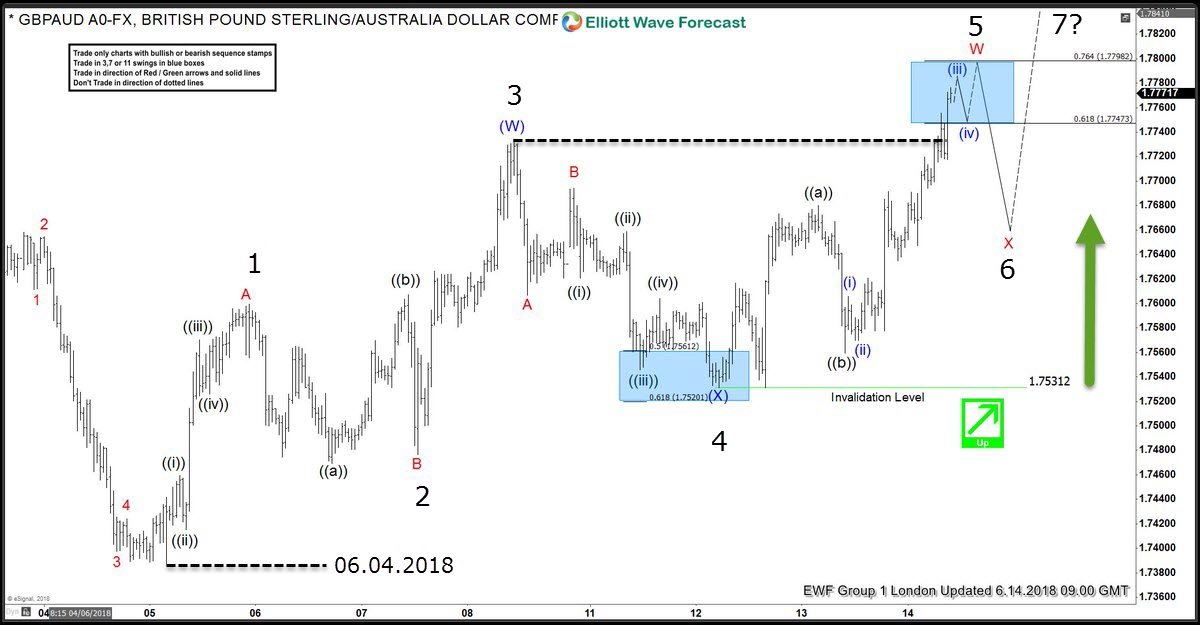
GBPAUD Incomplete Sequences Calling The Rally
Read MoreHello fellow traders. In this technical blog we’re going to take a quick look at the past Elliott Wave charts of GBPAUD published in members area of the website. As our members know GBPAUD has been showing incomplete bullish sequence: 5 swing in the short term cycle from the June 4th low. These types of […]
-

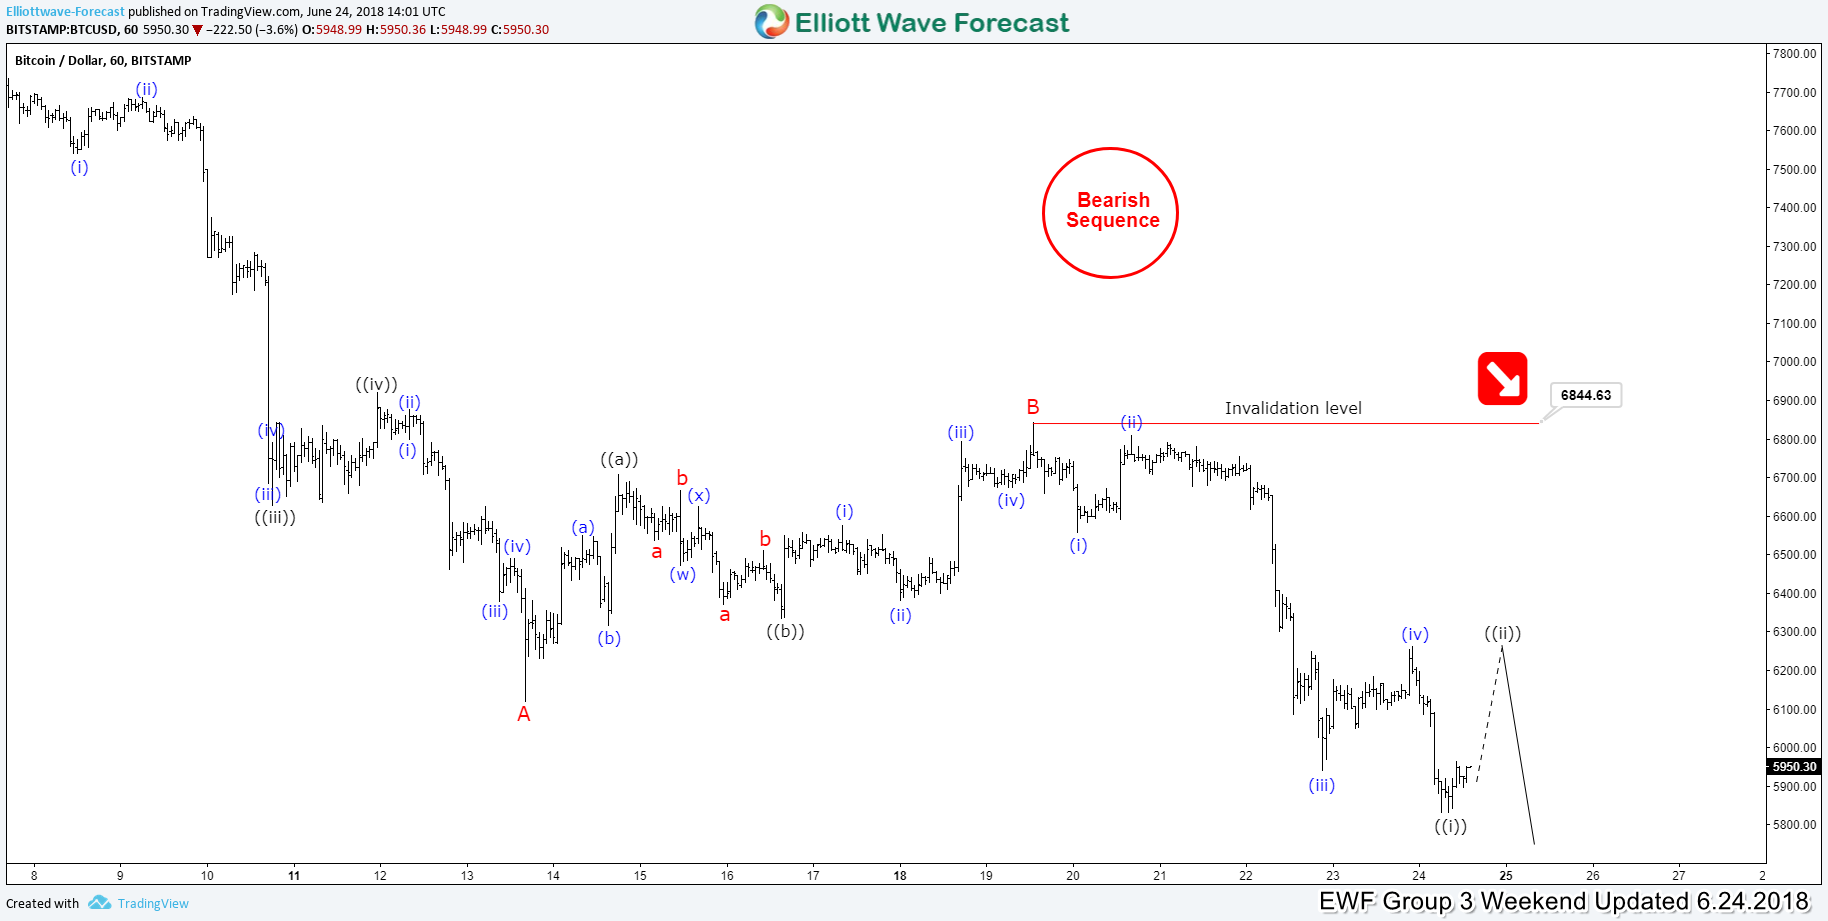
Bitcoin Elliott Wave Analysis
Read MoreIn this blog, we will have a look at some Elliott Wave charts of Bitcoin which we presented to our members in the past. Below, you can find the 4-hour updated chart presented to our members on the 06/17/18. Bitcoin ended the cycle from 02/20/18 peak (11751.36) at the low of 04/01/18 (6419.51) in black wave ((W)). Up […]
-

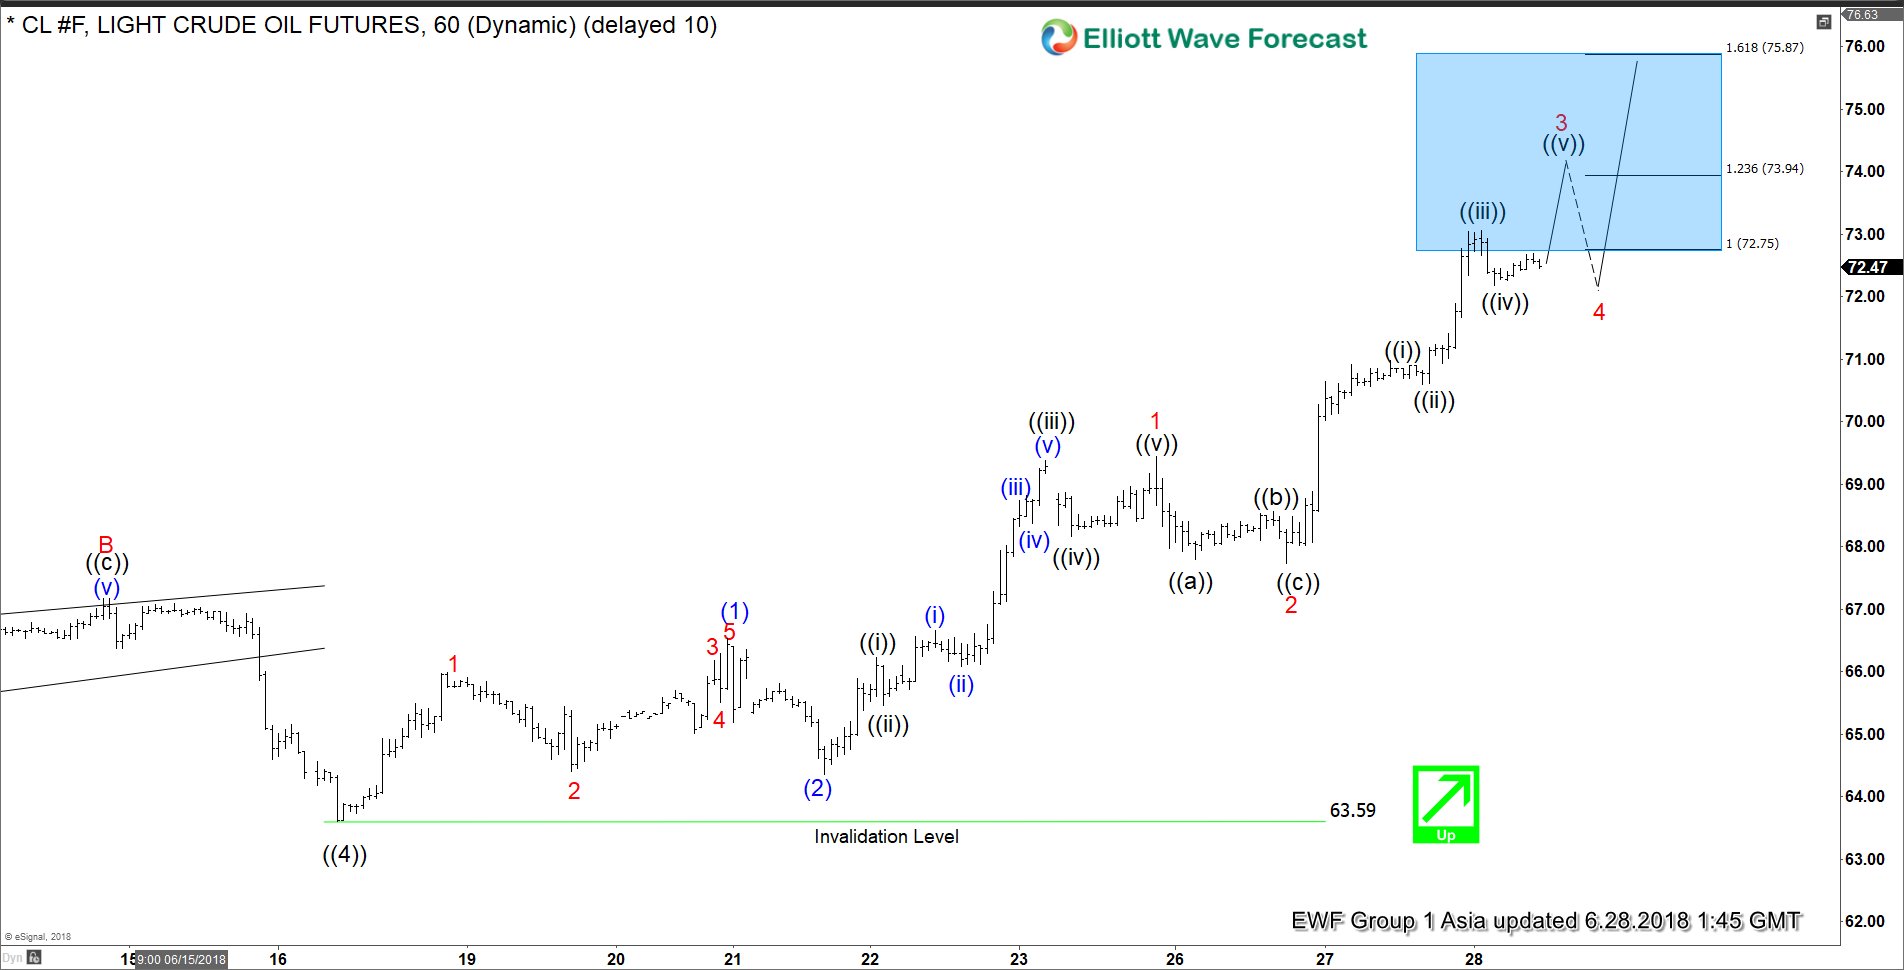
OIL Elliott Wave Impulse Structure Calling For More Upside
Read MoreOIL short-term Elliott Wave view suggests that the decline to $63.59 on 6/18/2018 low ended primary wave ((4)) pullback. Above from there, the instrument has rallied to new highs already. And confirming the next extension higher taking place in primary wave ((5)). The rally higher from $63.59 low is taking the form of Elliott wave […]