

The Power of 3-7-11 and the Grand Super Cycle: How We Saw the Bullish Turn in April 2025 Back on April 9, 2025, while World Indices were dropping sharply and global sentiment had turned overwhelmingly bearish, we published an article that challenged the fear-driven narrative. We explained why selling was not the right approach and […]
-
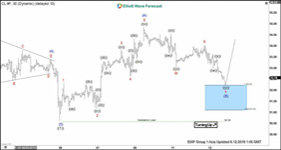
Elliott Wave View Calling for Extension Higher in Oil
Read MoreOil shows a 5 waves up from June 5 low suggesting further upside is likely. This article and video shows the short term Elliott Wave path.
-
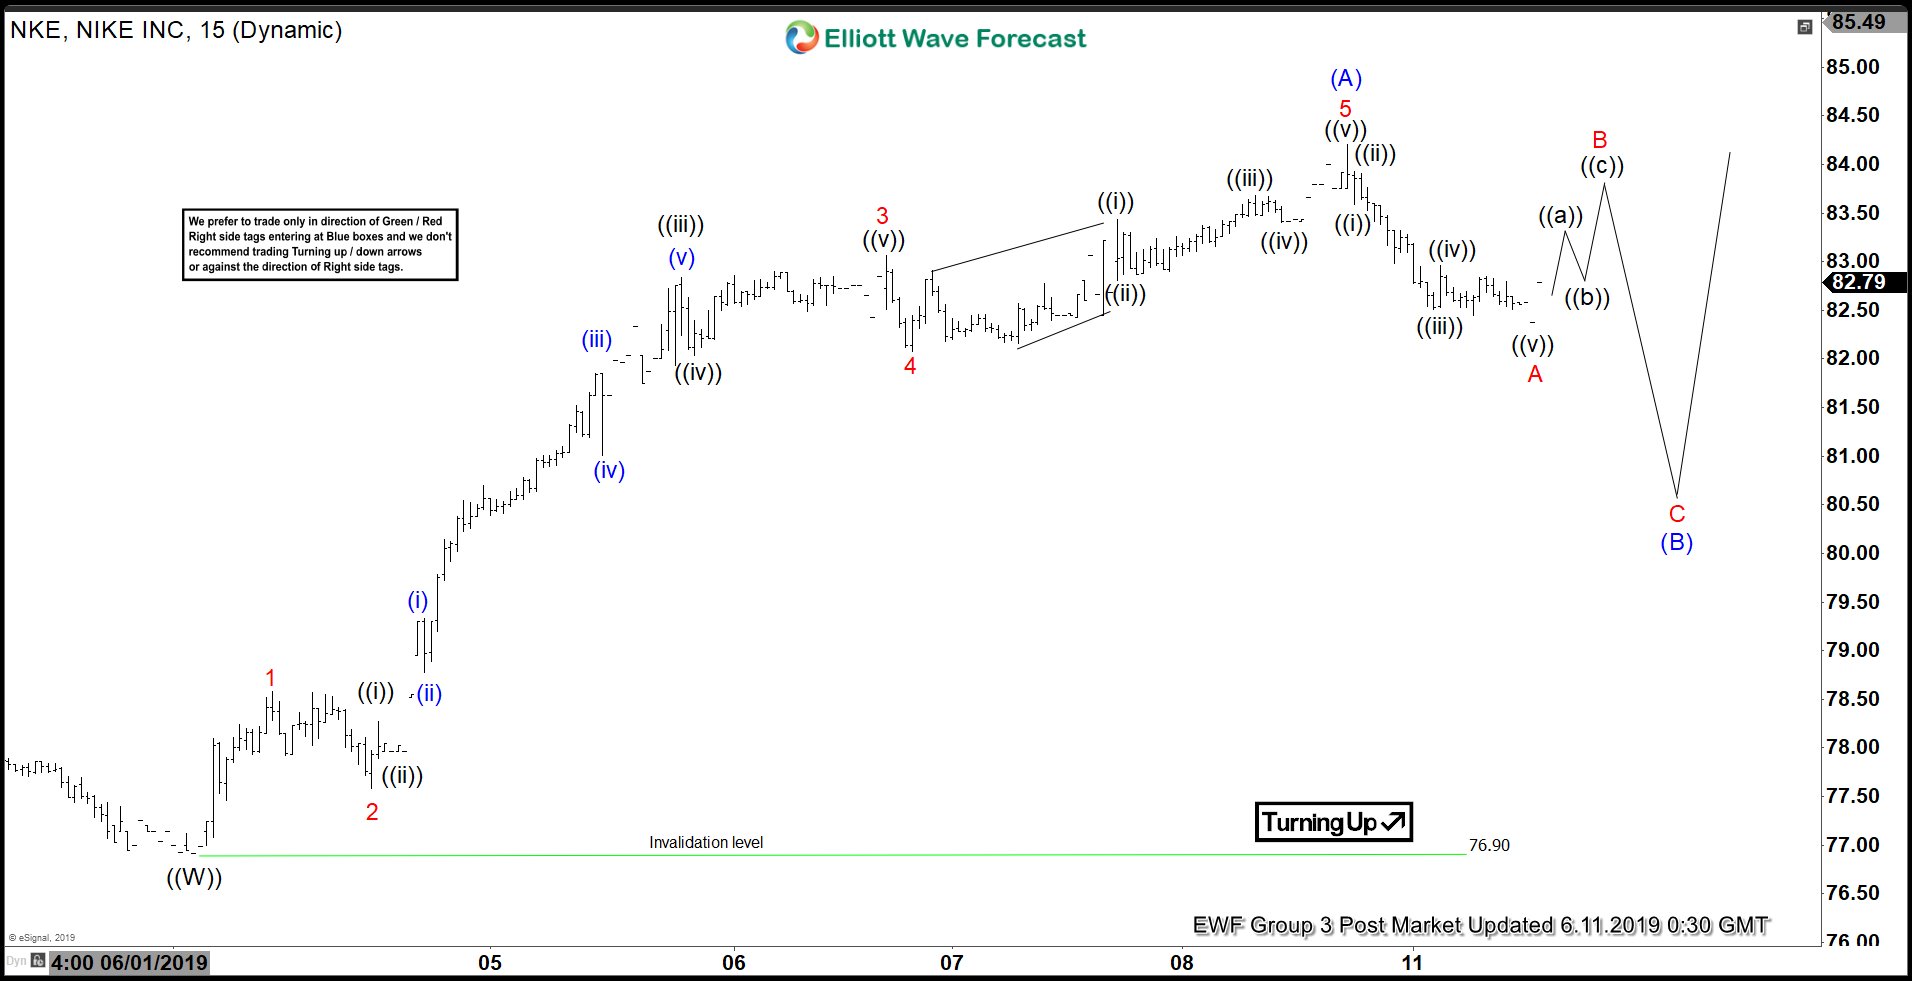
Elliott Wave View Favors More Upside in Nike (NKE)
Read MoreNike (NKE) shows a 5 waves impulse from June 3 low ($76.9). While pullback stays above there, expect the stock to extend higher.
-
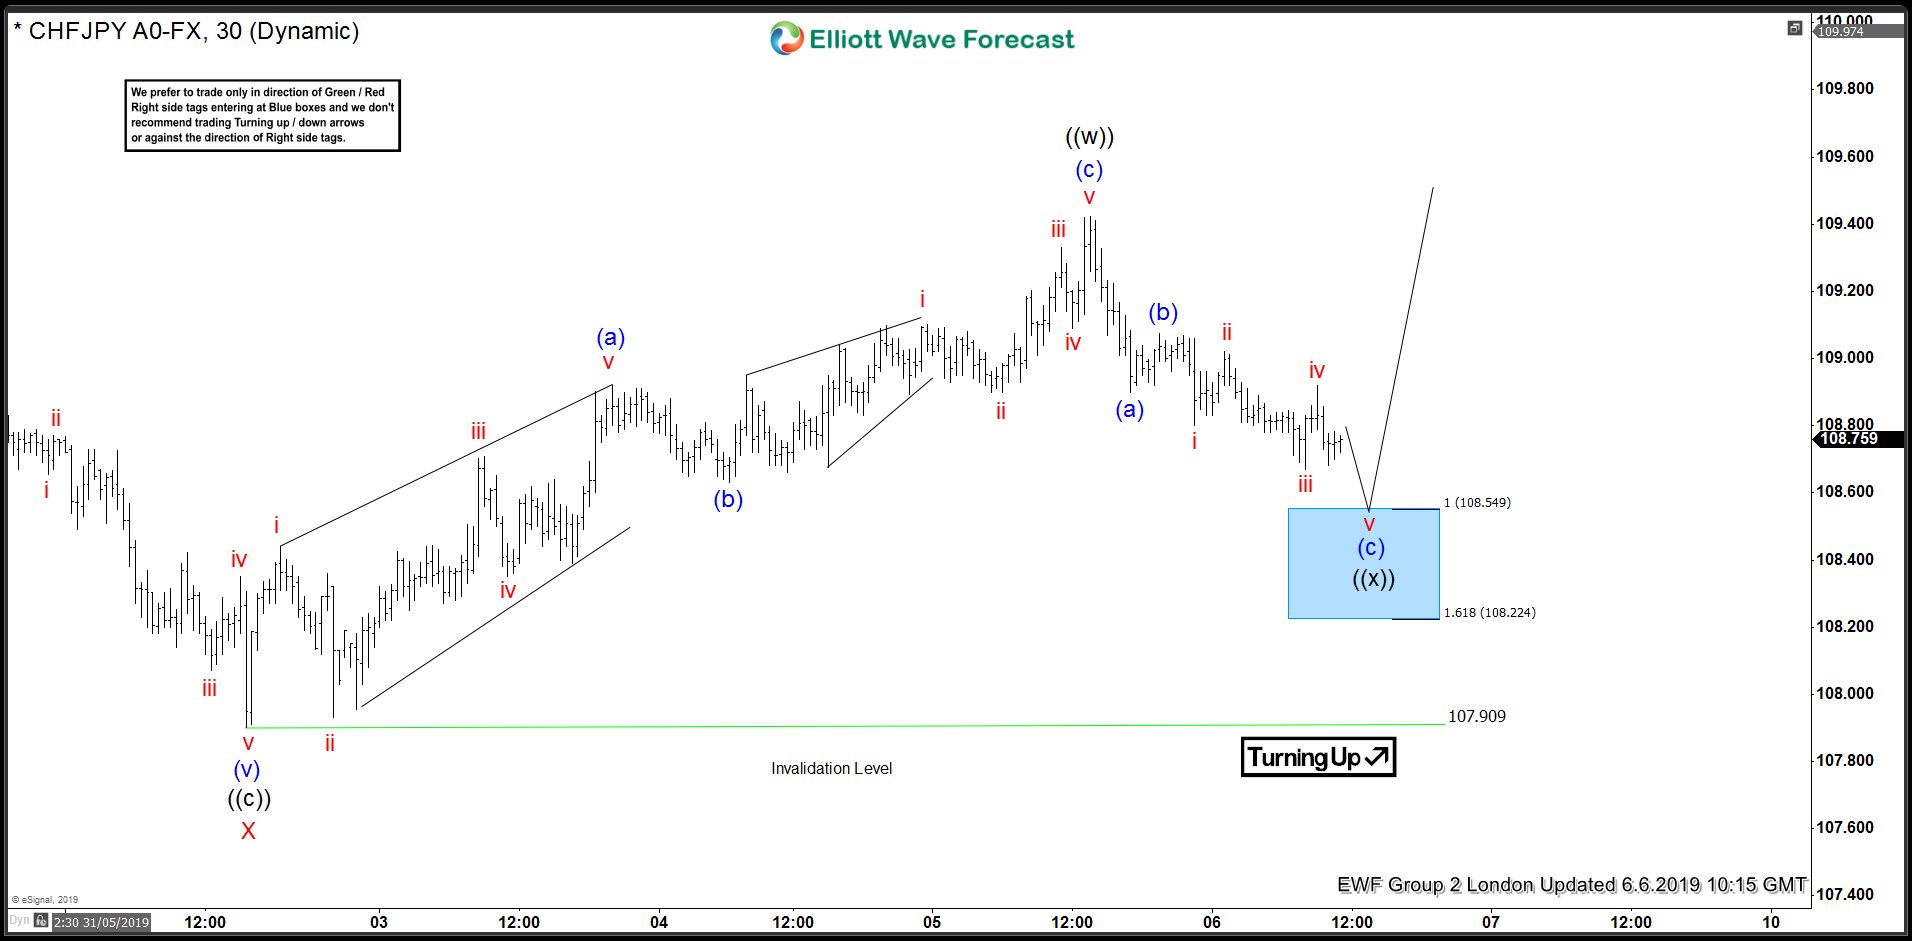
CHFJPY Elliott Wave Forecasting The Path
Read MoreHello fellow traders. In this technical blog we’re going to take a quick look at the charts of CHFJPY published in members area of the website. As our members know CHFJPY has ended 5 waves down from the 112.212 peak. Now, the pair is giving us recovery against the mentioned high and we can see […]
-
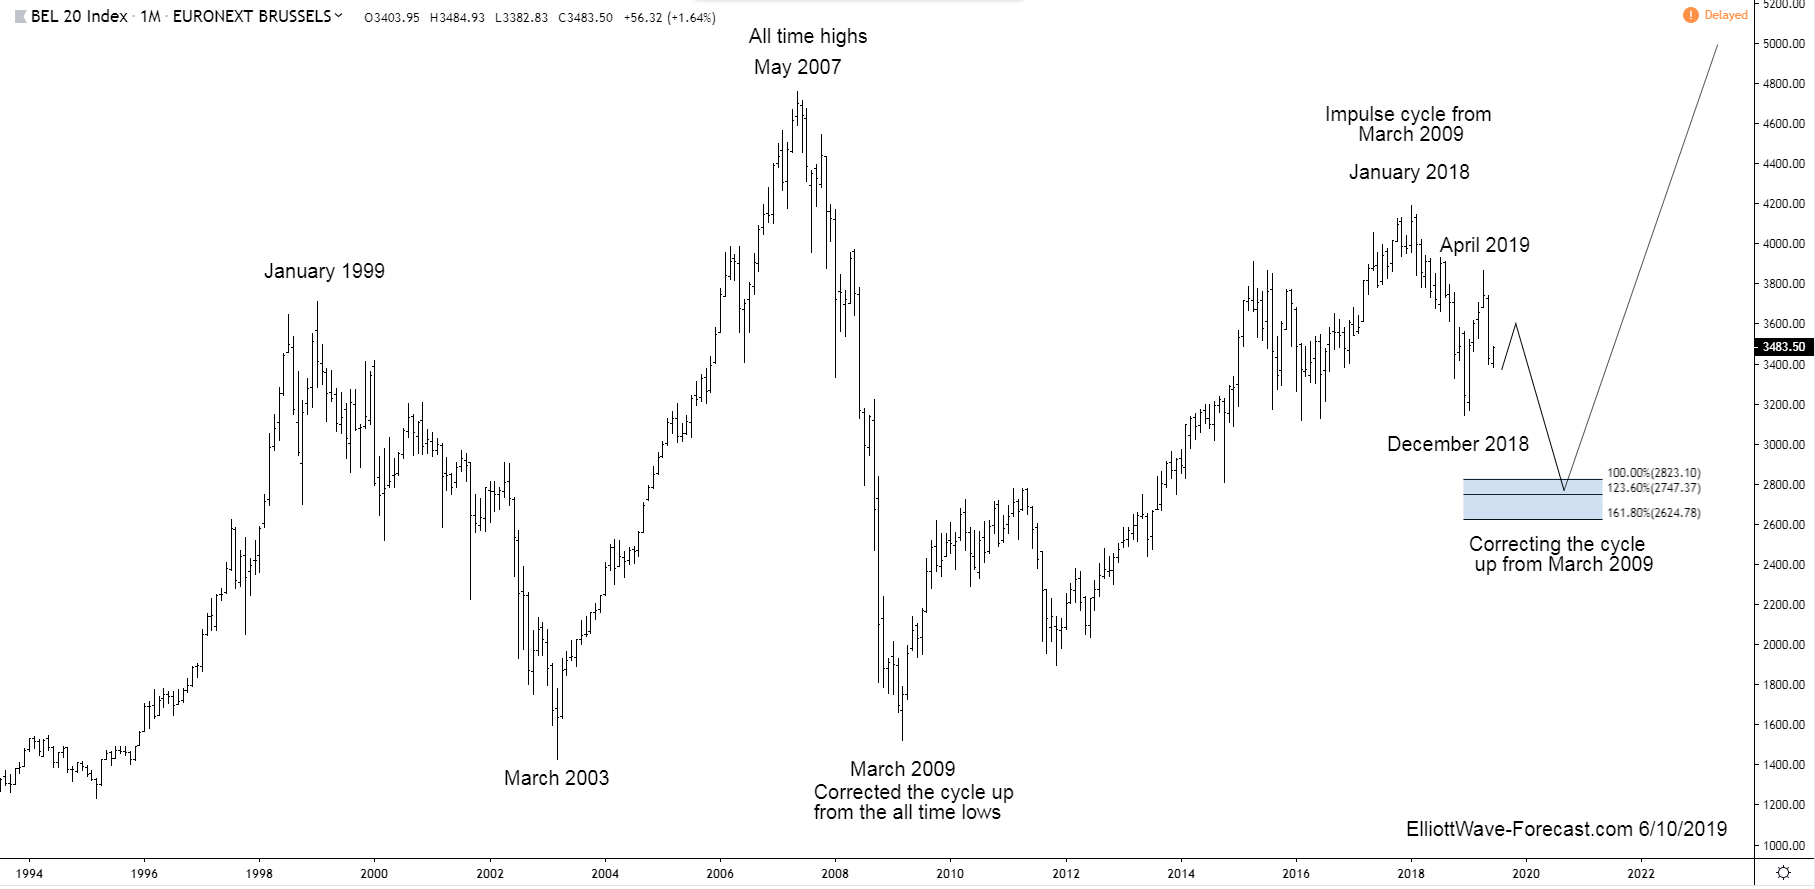
The BEL20 Index is Correcting the Cycle up from the 2009 Lows
Read MoreThe BEL20 Index is correcting the cycle up from the 2009 lows. Firstly the BEL20 Index has trended higher with other world indices since the benchmark was established. The index remained in a long term bullish trend cycle into the May 2007 highs. From there it made a sharp correction lower that lasted until March 2009 […]