

The Power of 3-7-11 and the Grand Super Cycle: How We Saw the Bullish Turn in April 2025 Back on April 9, 2025, while World Indices were dropping sharply and global sentiment had turned overwhelmingly bearish, we published an article that challenged the fear-driven narrative. We explained why selling was not the right approach and […]
-
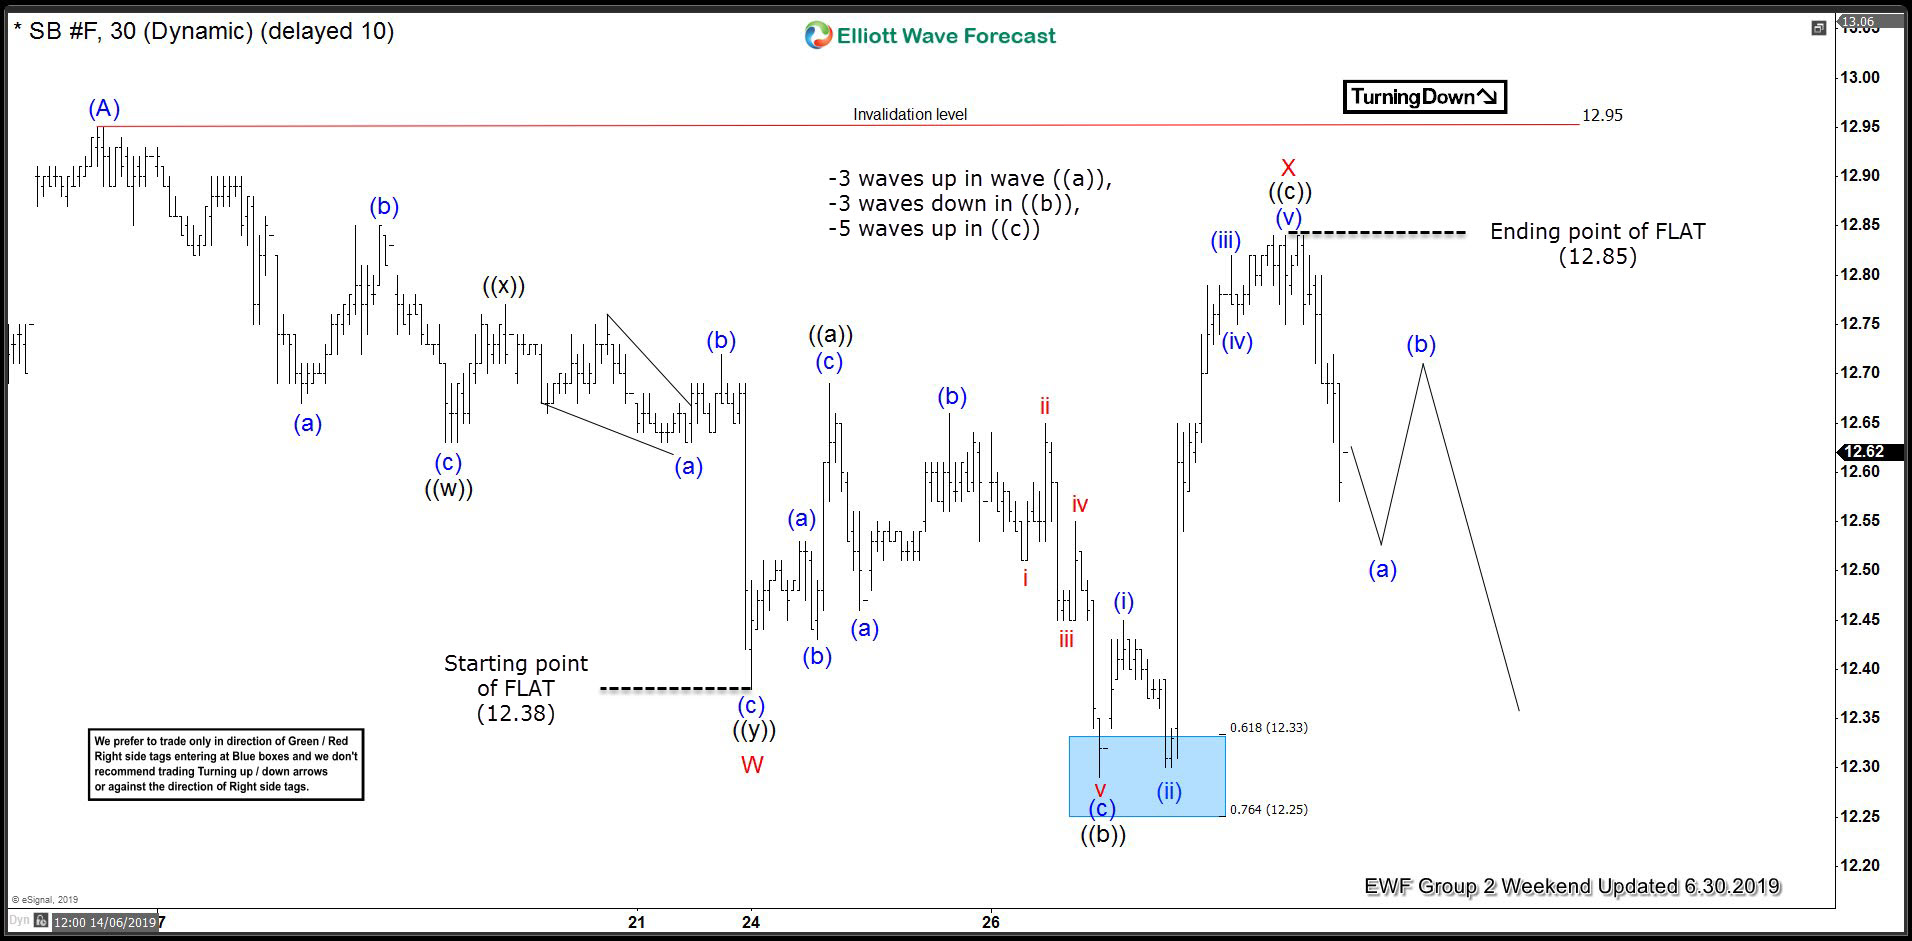
SUGAR ( $SB_F ) Forecasting The Decline After Elliott Wave Flat
Read MoreHello fellow traders. In this technical blog we’re going to take a quick look at the Elliott Wave charts of SUGAR ( $SB_F ) published in members area of the website. As our members know, the commodity made Elliott Wave Flat structure against the 12.95 high and gave us forecasted decline. In further text we’re […]
-
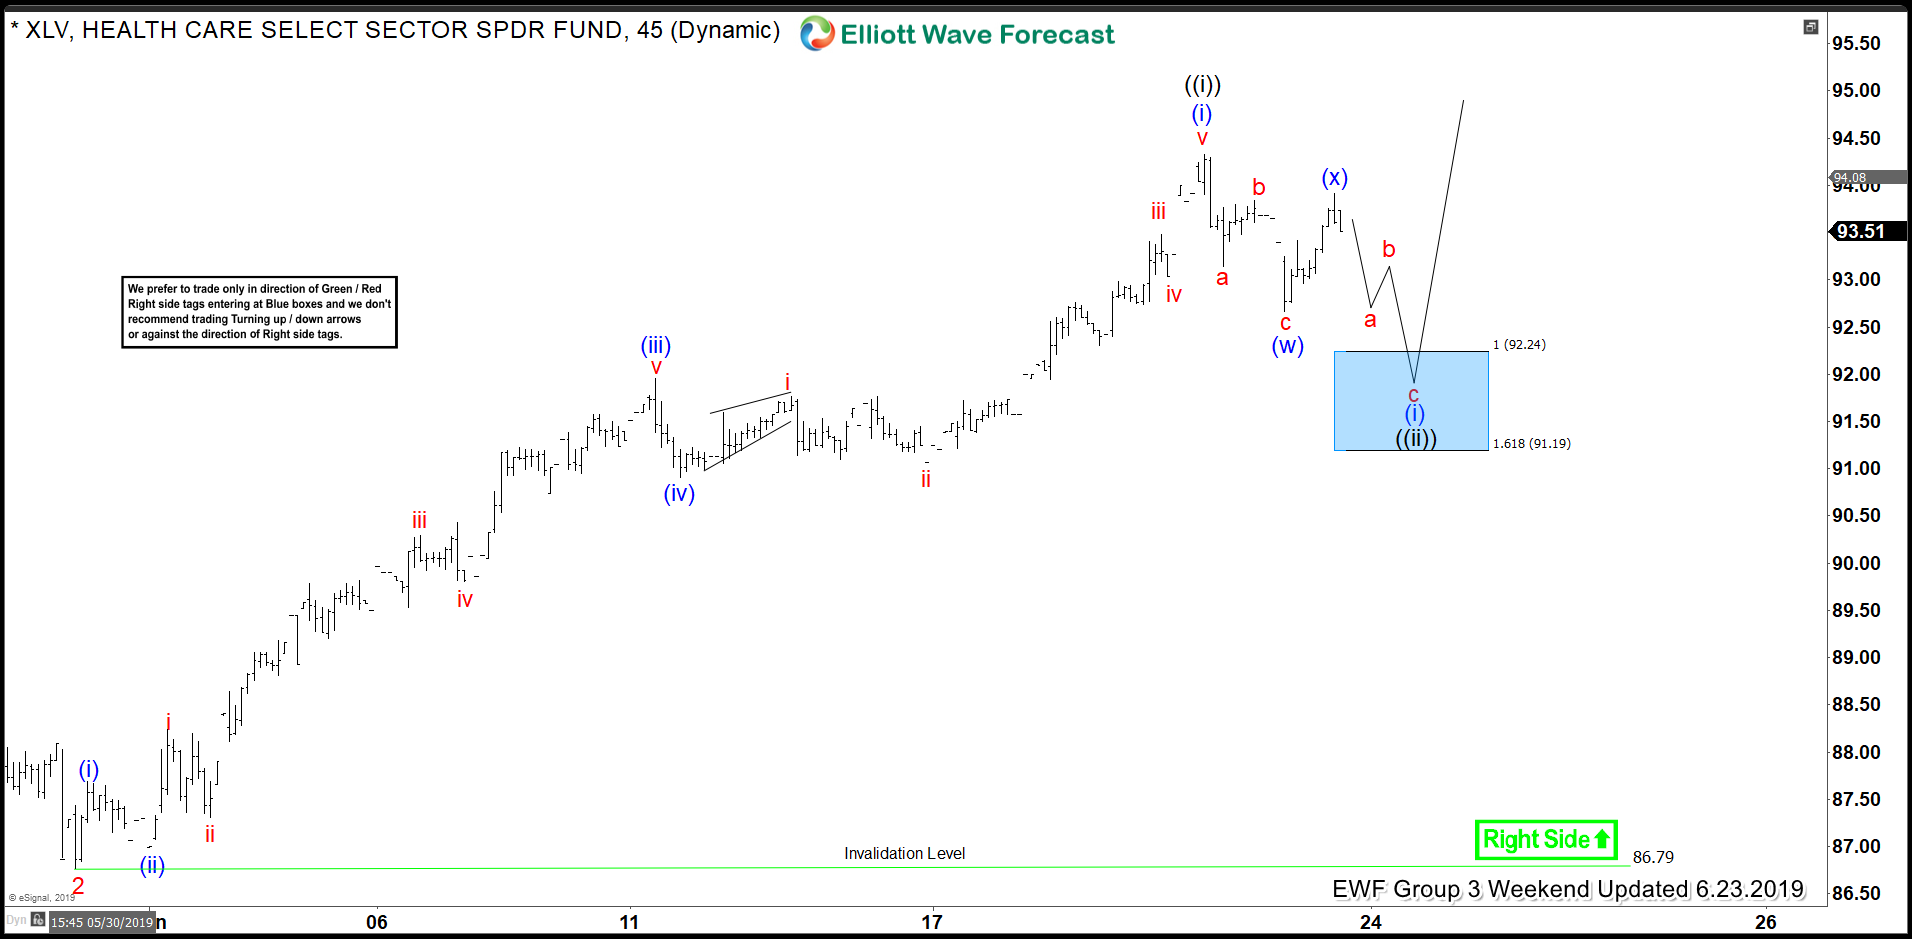
XLV Buying The Elliott Wave Dips Into The Direction Of Right Side Tags
Read MoreIn this blog, we take a look at the past performance of 1 hour Elliott Wave charts of XLV. In which our members took advantage of the blue box areas.
-

Elliott Wave View: An Impulsive Rally in Bausch Health (BHC)
Read MoreBausch Health (BHC) shows an impulsive rally from June 4 low and the stock can see more upside while dips stay above there.
-
Strong NFP Report Tempers Fed’s Rate Cut Expectation and Boosts US Dollar
Read MoreJobs report for the month of June came above the expectation, tempering the hope of a Fed’s rate cut. June NFP (Nonfarm Payroll) rebounded to 224,000 after a disappointing 72,000 May figure. Unemployment rate increased to 3.7% while average wage gains increased less than expected at 3.1%. The gain however might not be enough to […]