
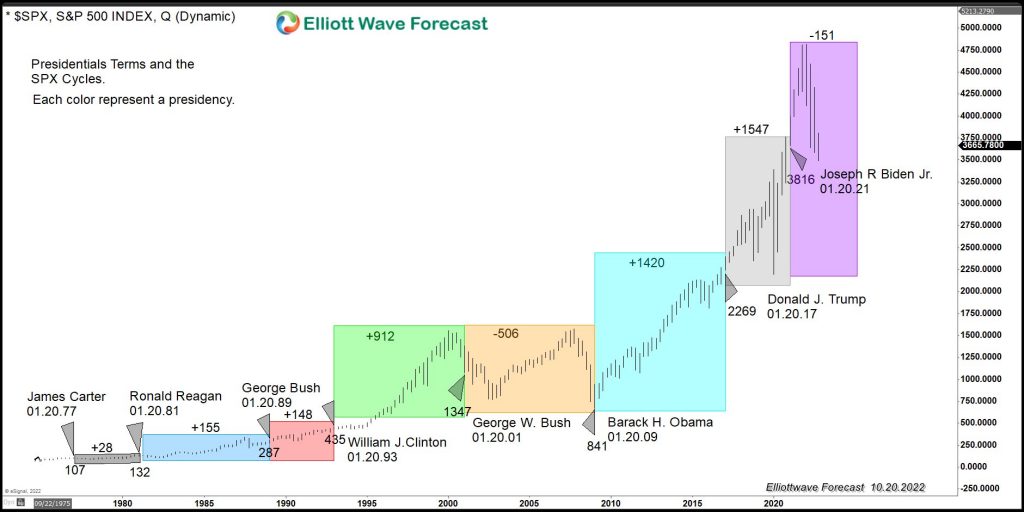
A lot has been said and written about both the Democrat and Republican economic plans for a better economy. We believe in free enterprise and limited regulation, allowing humans to create and expand at their own will for the better but there is a vast difference between the two parties regarding the economic agenda. Most […]
-
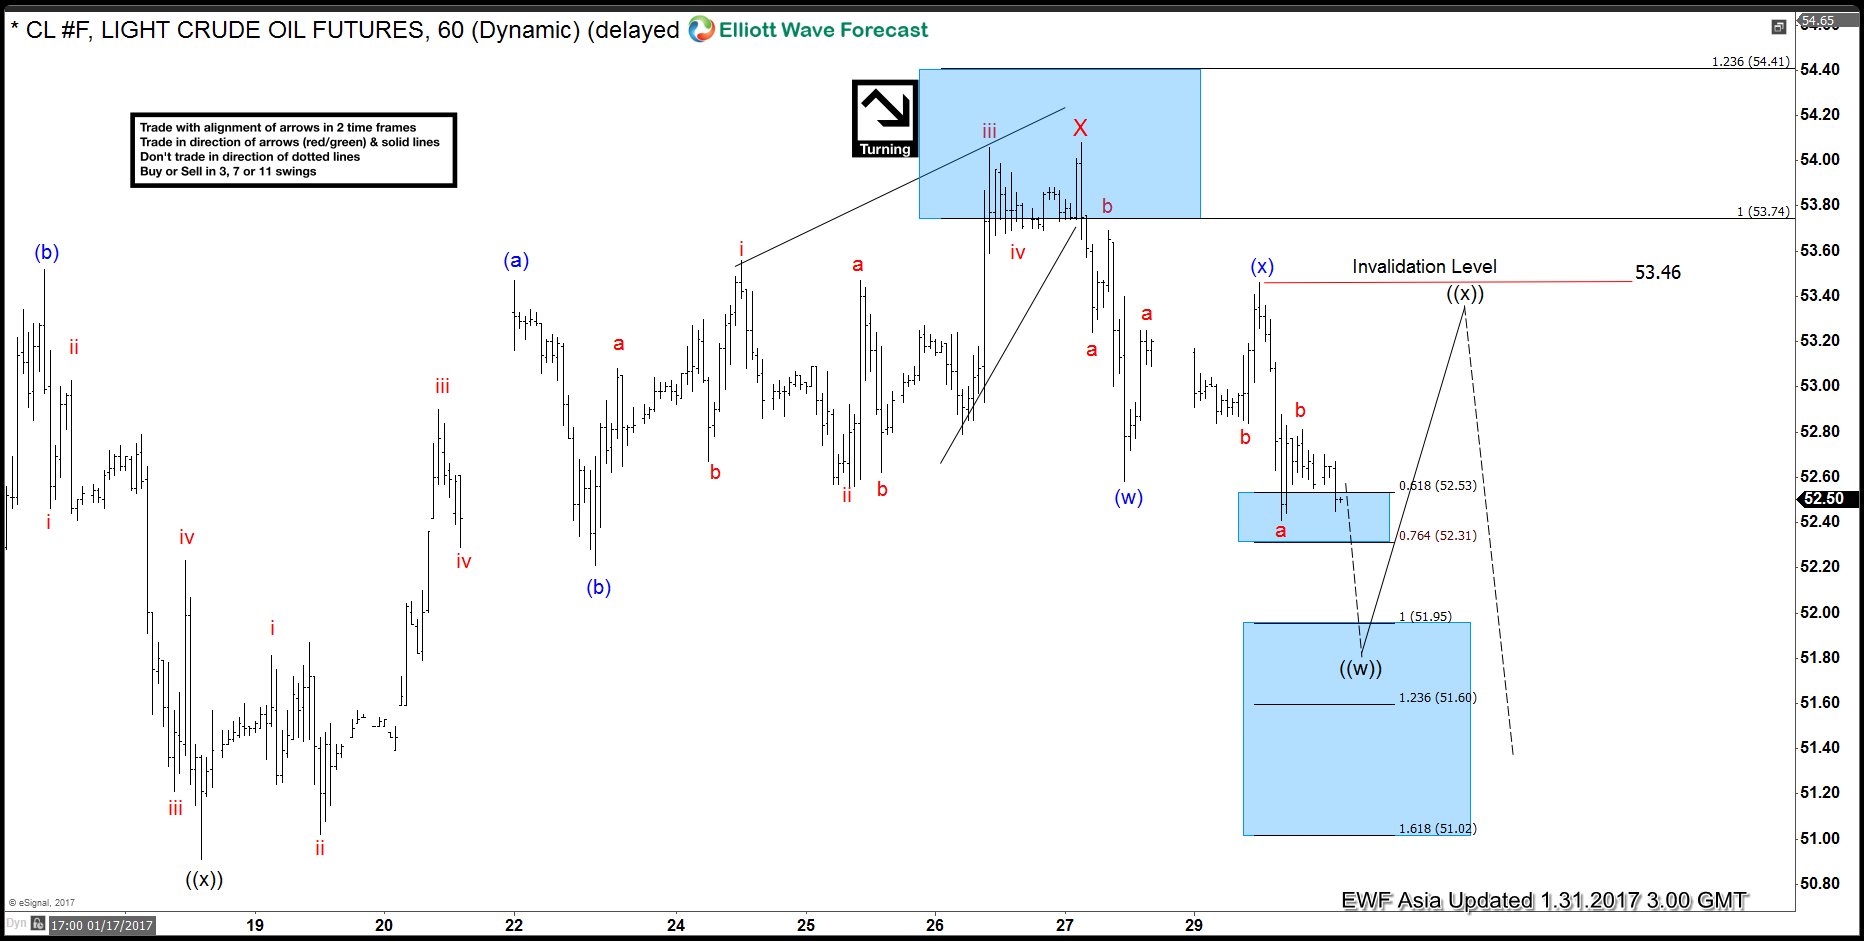

Oil CL_F: Buying Opportunity should come soon
Read MoreRally to 55.24 completed Intermediate wave (W) and ended the cycle from 8/3/2016 low. From 55.24 high, oil turned lower to correct the cycle from 8/3 low as a double three structure where Minor wave W ended at 50.71 and Minor wave X ended at 54.08. Decline from 54.08 high is showing a 5 swing […]
-
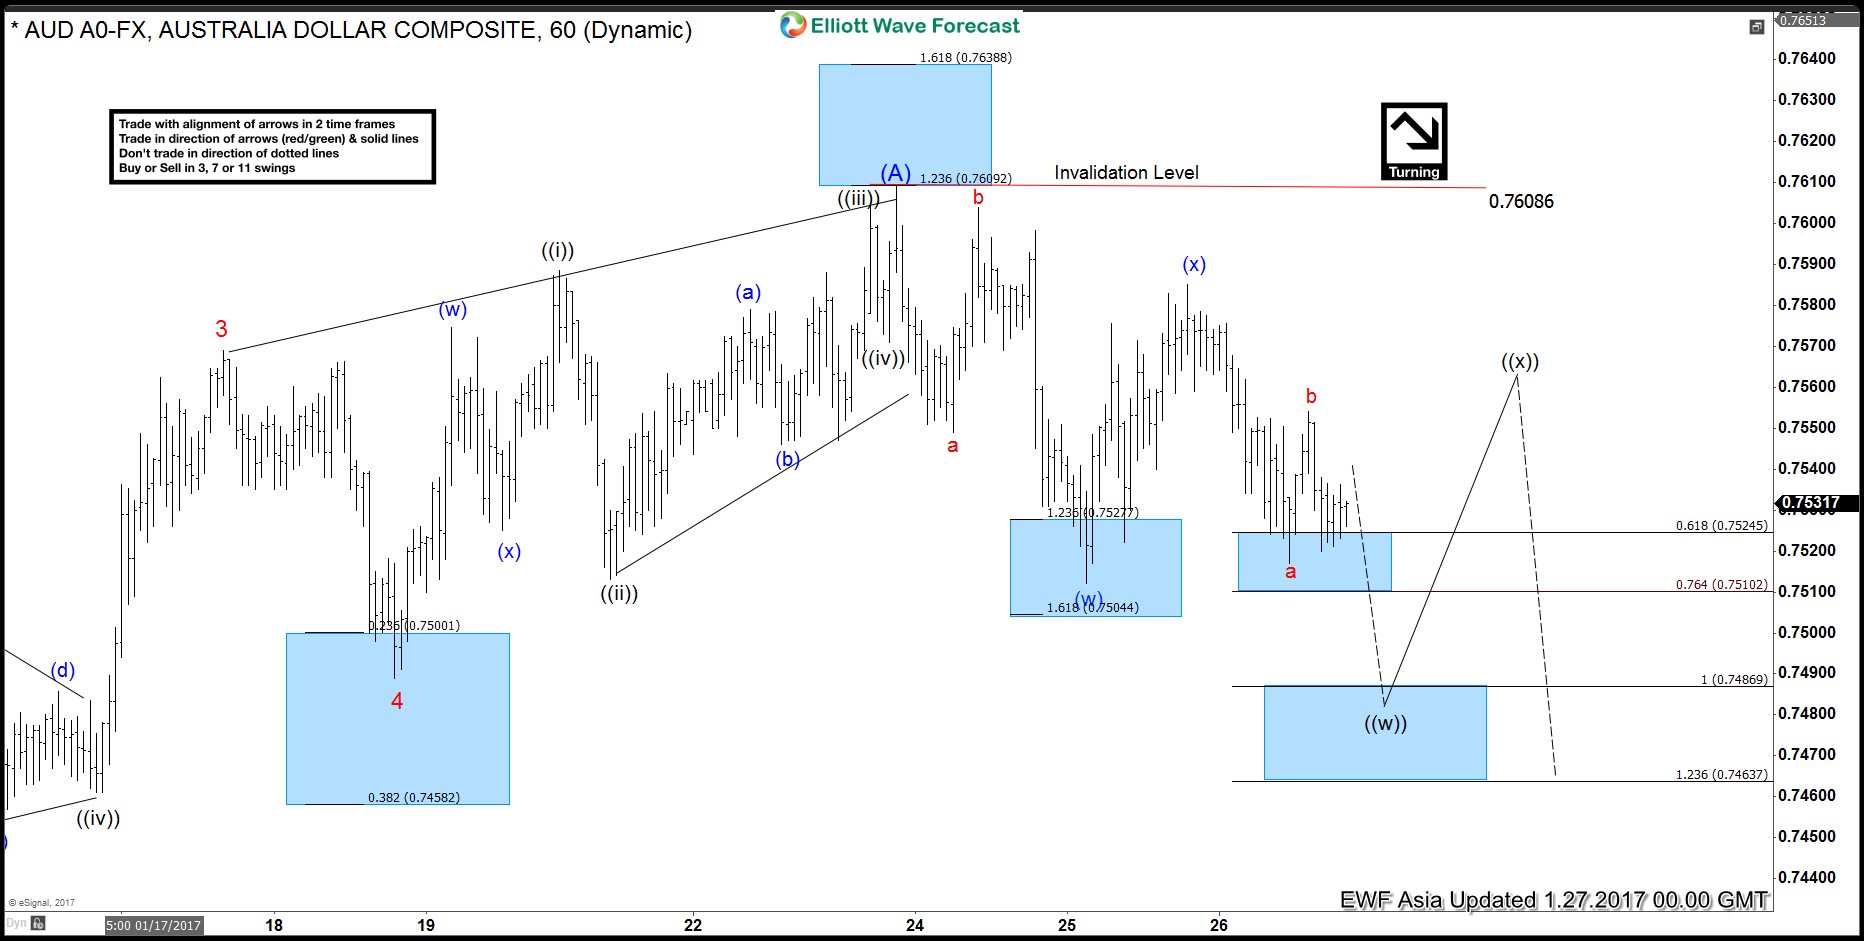
AUDUSD 5 wave cycle completed: Now turning lower
Read MoreAUDUSD 5 wave cycle from 12/23 low is proposed to be over at 0.7608 and pair is now turning lower. Yesterday, we mentioned that a break below 0.7511 would negate another high to complete wave (A) and suggest that 5 wave cycle from 12/23 low ended already at 0.7608. Today, pair failed to make a new […]
-
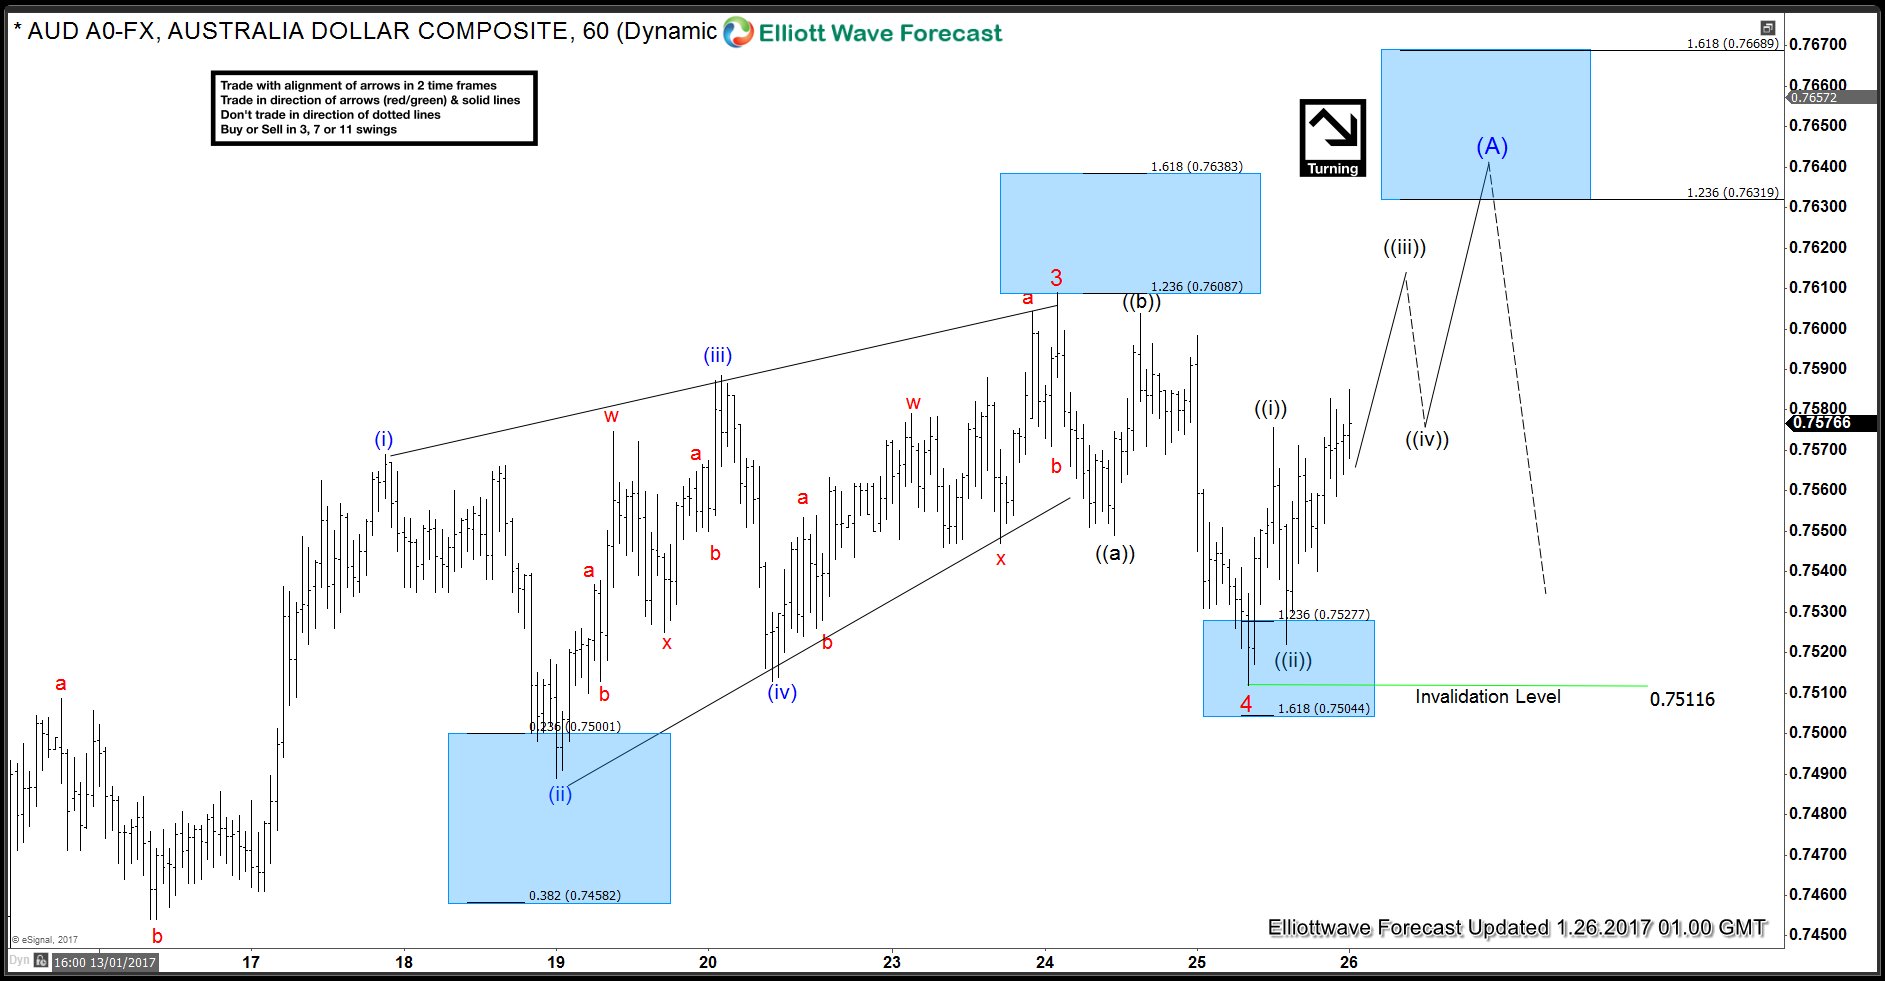
AUDUSD: 5 Wave move nearing completion
Read MoreAUDUSD 5 wave move up from 12/13 low can already be counted completed at 0.7609. However, while above 0.7511 low, another high to 0.7631 – 0.7699 area can’t be ruled out within this 5 wave move up from 12/23 low. As per the updated wave count, wave 3 is at 0.7609 and dip to 0.7511 was […]
-
Elliott Wave forecast & market correlation example
Read MoreMarket Correlation Market correlation is one of the powerful techniques we use to forecast the market. Many traders, especially beginners, make mistake by trading and forecasting only one or a few instruments. E.g. the most popular are EURUSD, USDX, SPX, DAX, Gold. Although EURUSD is the most popular forex pair ever, it doesn’t always have […]