

The Power of 3-7-11 and the Grand Super Cycle: How We Saw the Bullish Turn in April 2025 Back on April 9, 2025, while World Indices were dropping sharply and global sentiment had turned overwhelmingly bearish, we published an article that challenged the fear-driven narrative. We explained why selling was not the right approach and […]
-
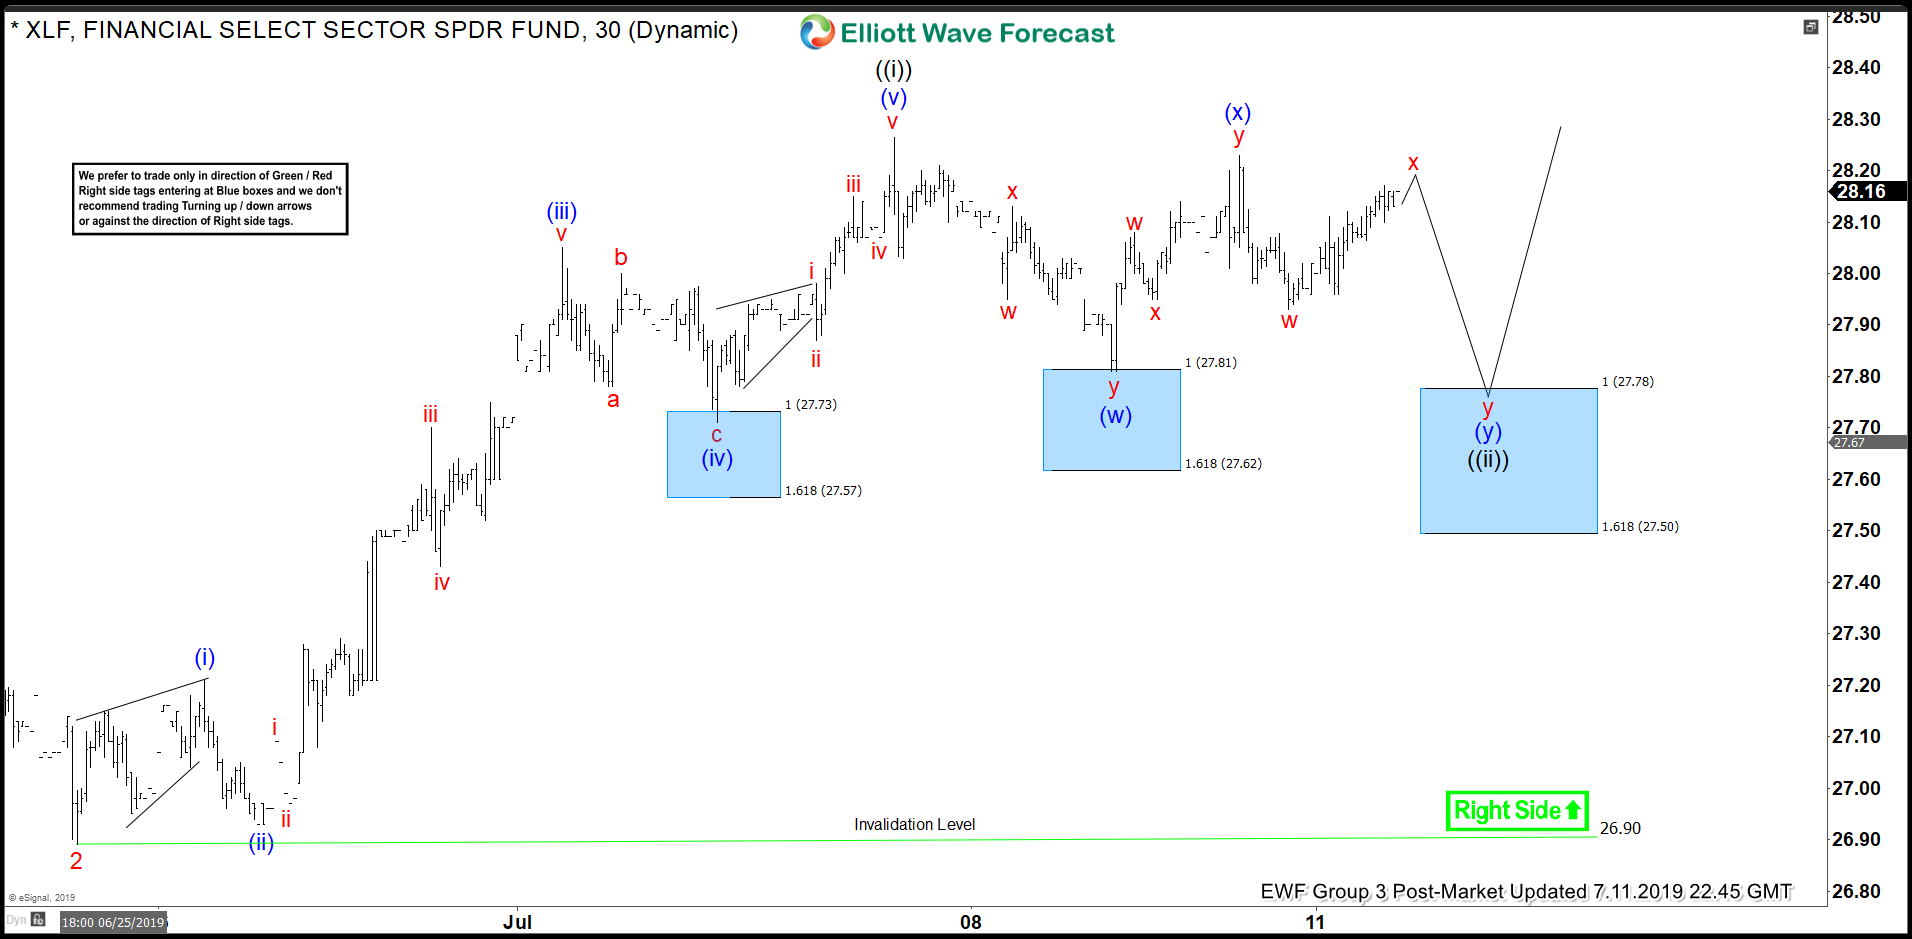
Elliott Wave View: Right Side in XLF Remains Higher
Read MoreXLF shows a bullish sequence from Dec 25, 2018 low favoring more upside.This article and video show the Elliott Wave path.
-
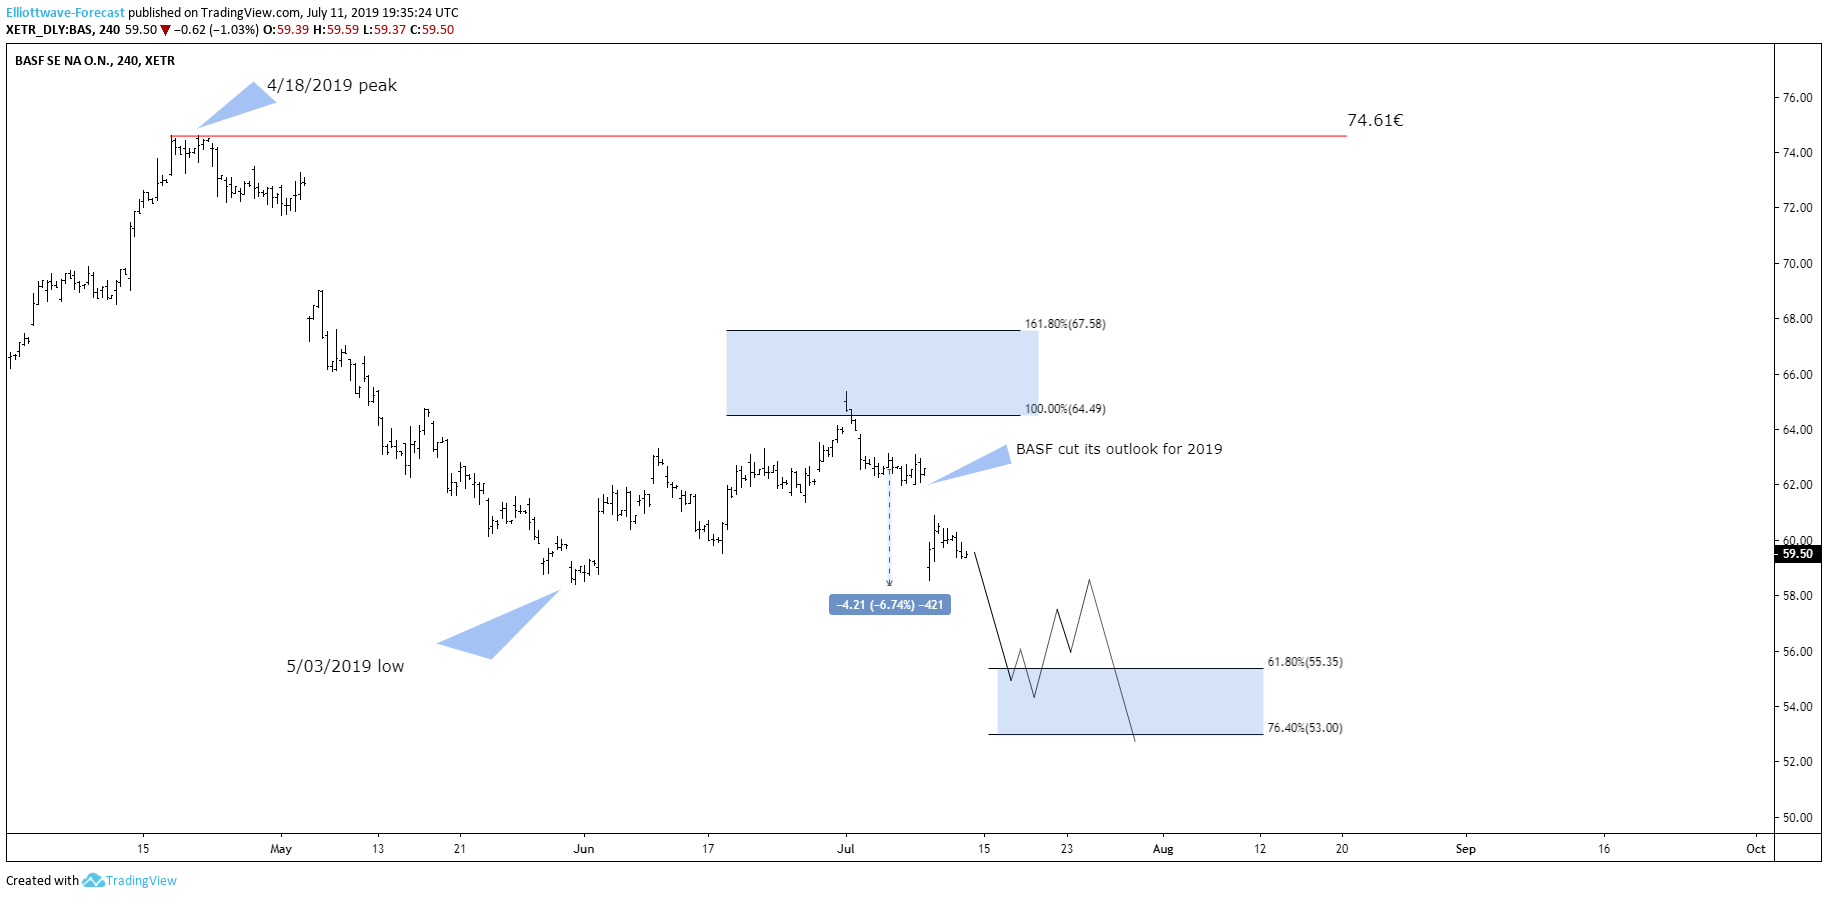
German Chemical Company BASF Cuts Business Outlook, Whats next?
Read MoreIn today’s blog, we will have a look at the latest price action of the BASF stock. The stock is listed in the DAX 30 Index from Germany. BASF is a German-based chemical company which as its headquarter in Ludwigshafen am Rhein in Germany. BASF is the largest chemical producer in the world. On the 8th […]
-
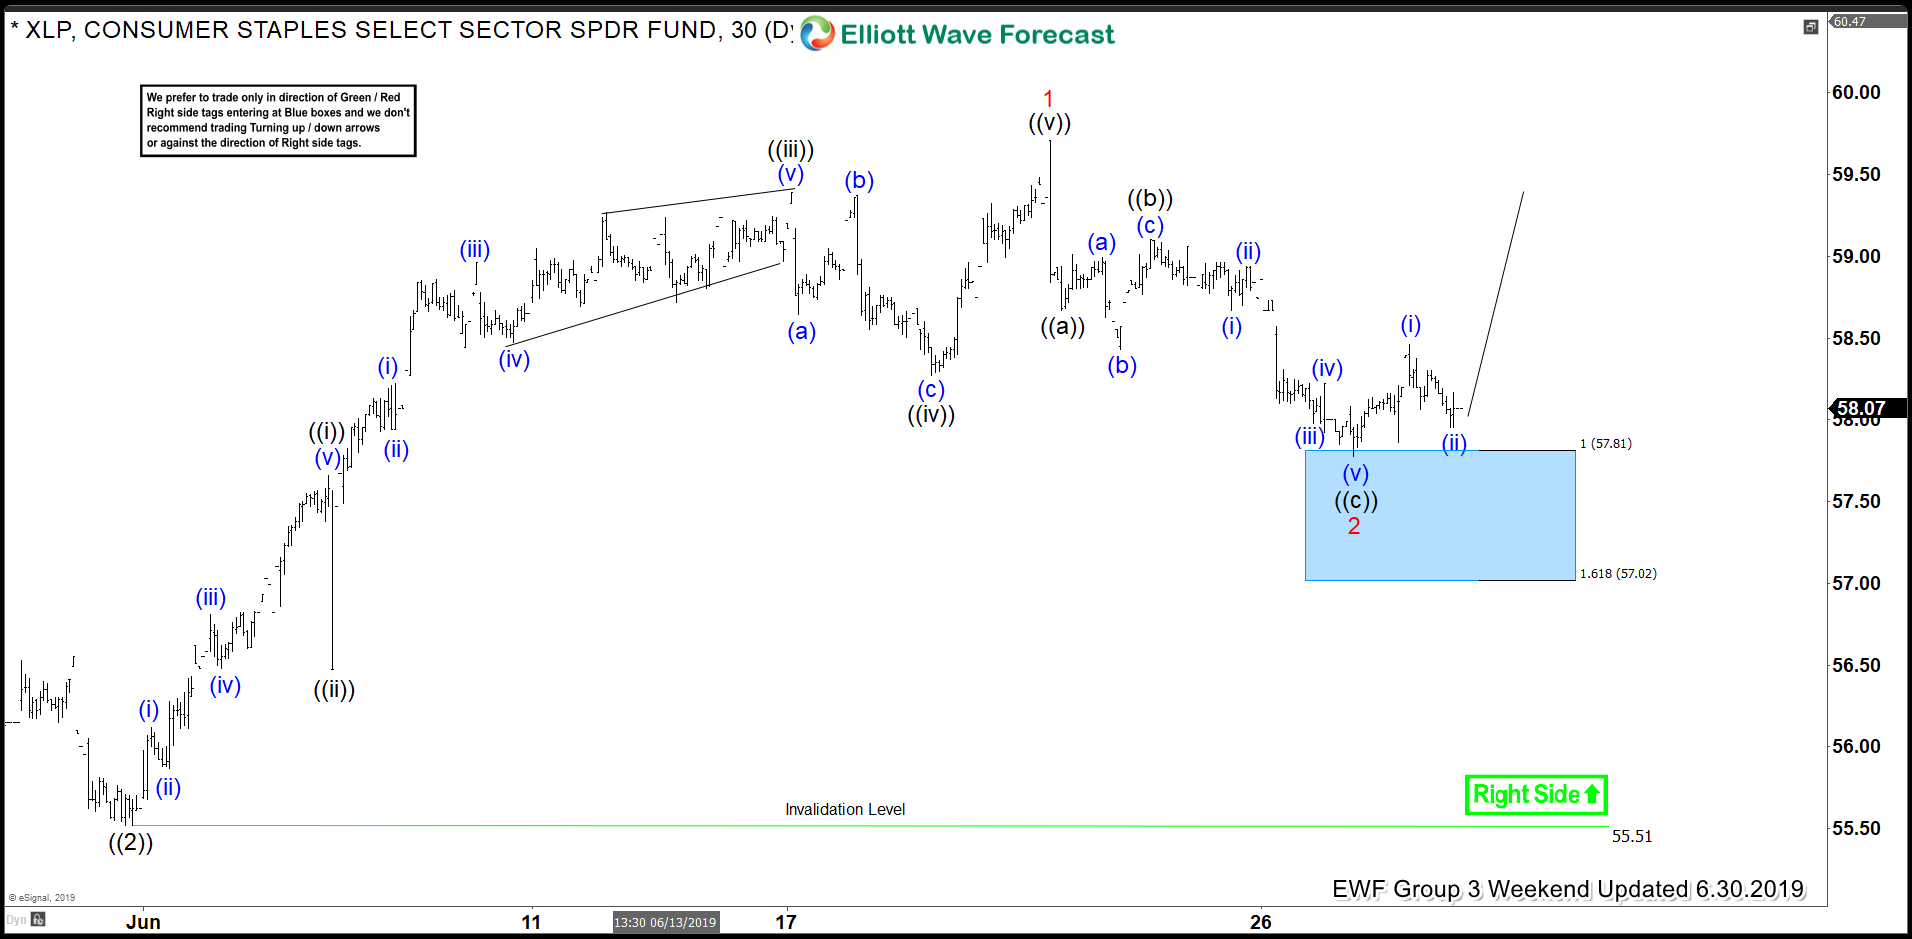
XLP Buying The Elliott Wave Dips At Blue Box Areas
Read MoreIn this blog, we take a look at the past performance of 1 hour Elliott Wave charts of XLP. In which our members took advantage of the blue box areas.
-
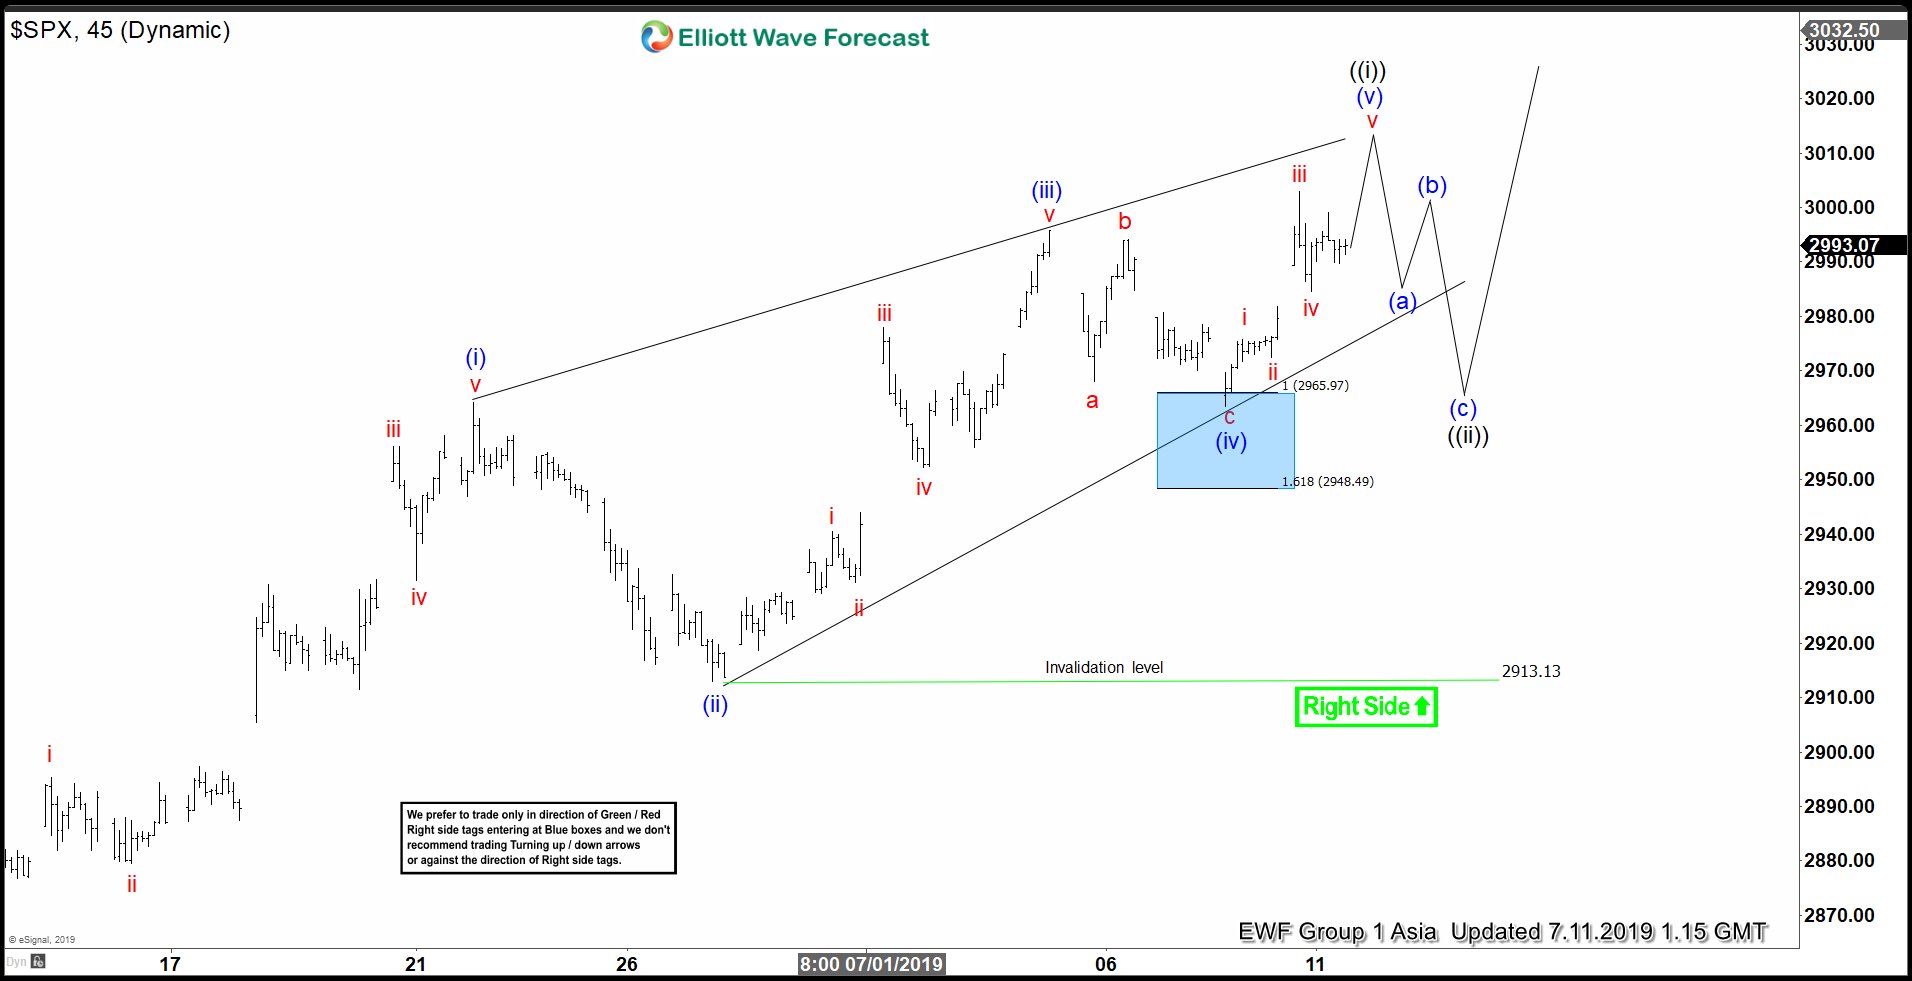
Elliott Wave View: S&P 500 (SPX) Remains Buy in the Dips
Read MoreS&P 500 shows incomplete sequence from Dec 26, 2018 low favoring more upside. This article & video show the Elliott Wave path.