
The Power of 3-7-11 and the Grand Super Cycle: How We Saw the Bullish Turn in April 2025 Back on April 9, 2025, while World Indices were dropping sharply and global sentiment had turned overwhelmingly bearish, we published an article that challenged the fear-driven narrative. We explained why selling was not the right approach and […]
-

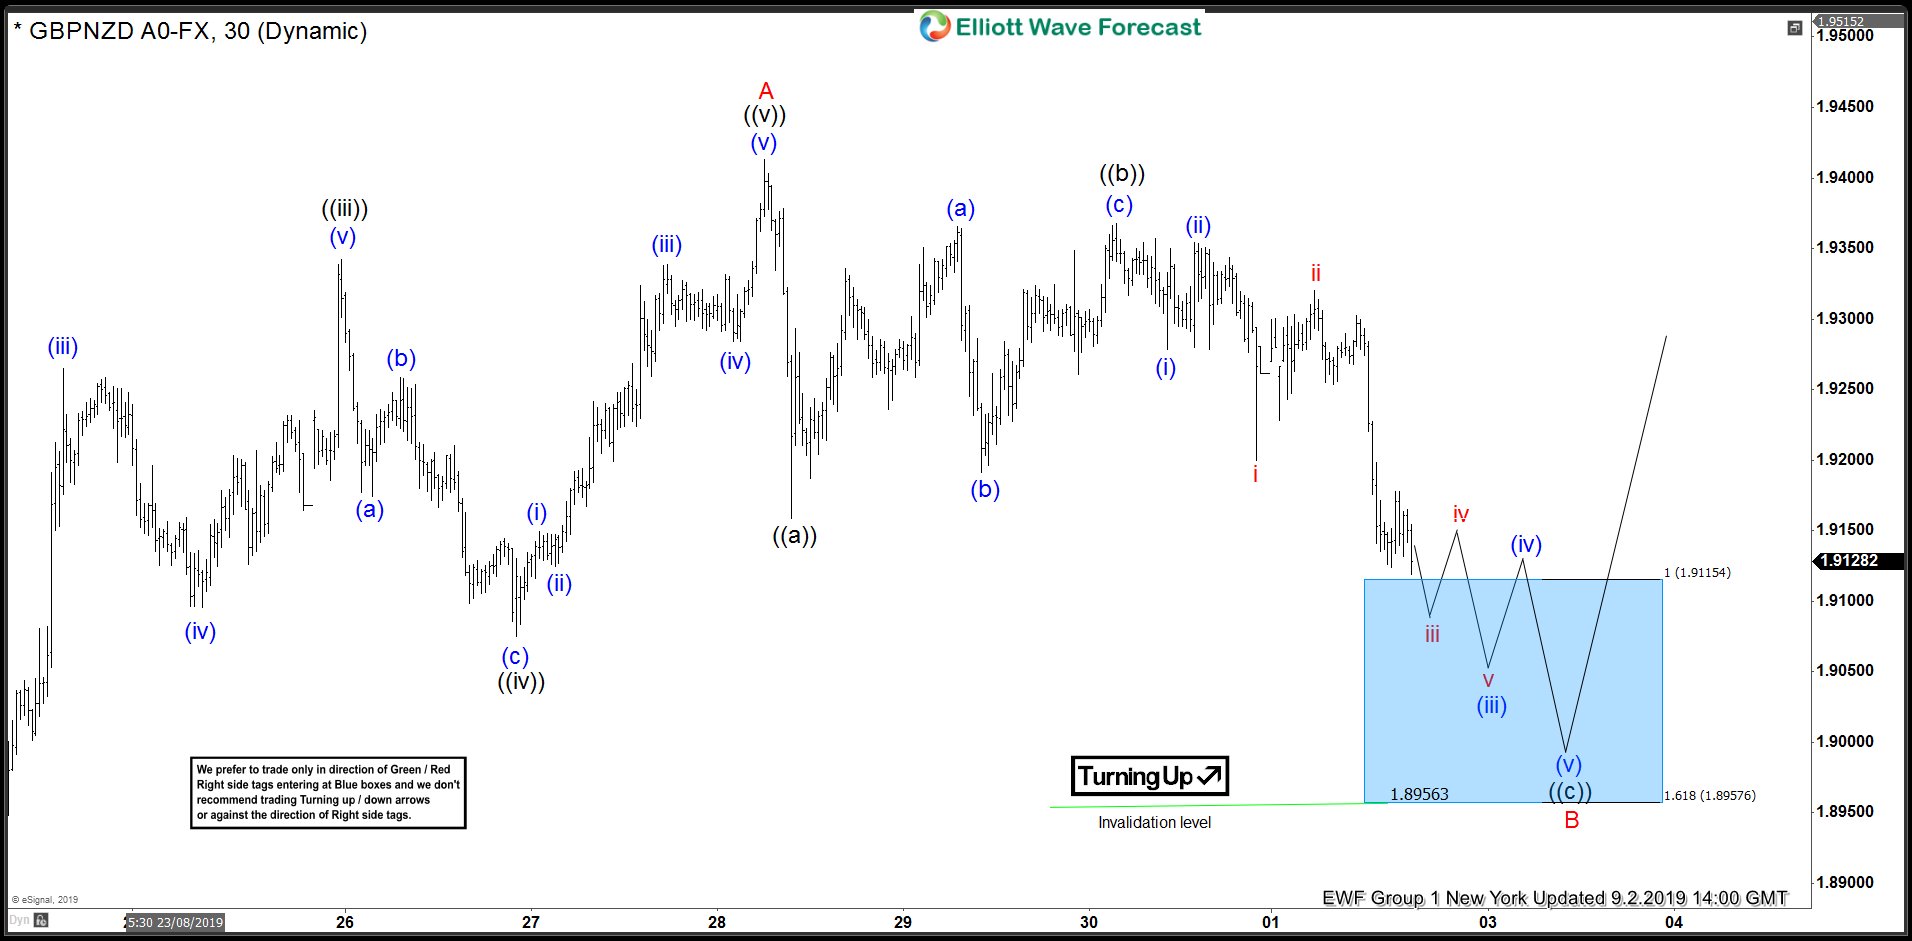
GBPNZD Forecasting The Rally After Elliott Wave Zig Zag Pattern
Read MoreHello fellow traders. In this technical blog we’re going to take a quick look at the Elliott Wave charts of GBPNZD, published in members. As our members know, GBPNZD recently corrected cycle from the 07/30 low. Pull back has unfolded as Elliott Wave ZIG ZAG pattern. After the pull back completed we got expected rally […]
-

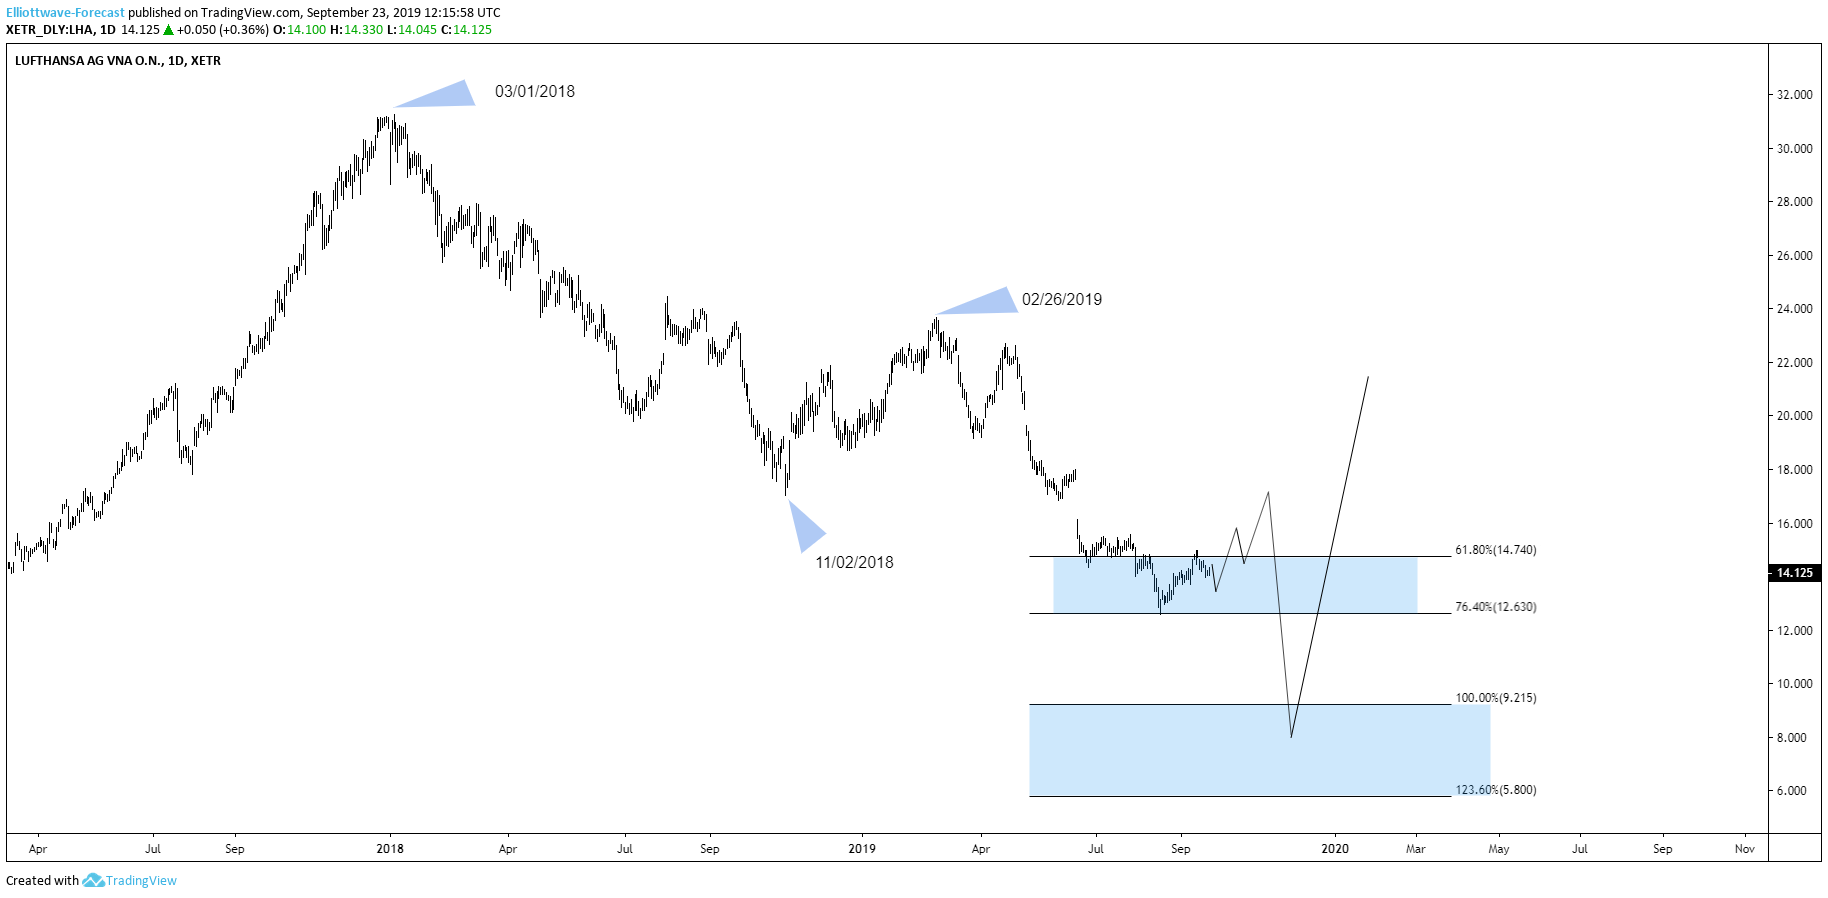
Lufthansa AG Stock Should Remain Weak In The Coming Weeks
Read MoreHello fellow traders. In today’s blog, we will have a look at the Lufthansa AG stock. The stock is listed in the DAX 30. Lufthansa AG is the biggest German airline and has a lot of subsidiaries. And when combining them together Lufthansa is the biggest airline in Europe in terms of a passenger airline. The company has […]
-

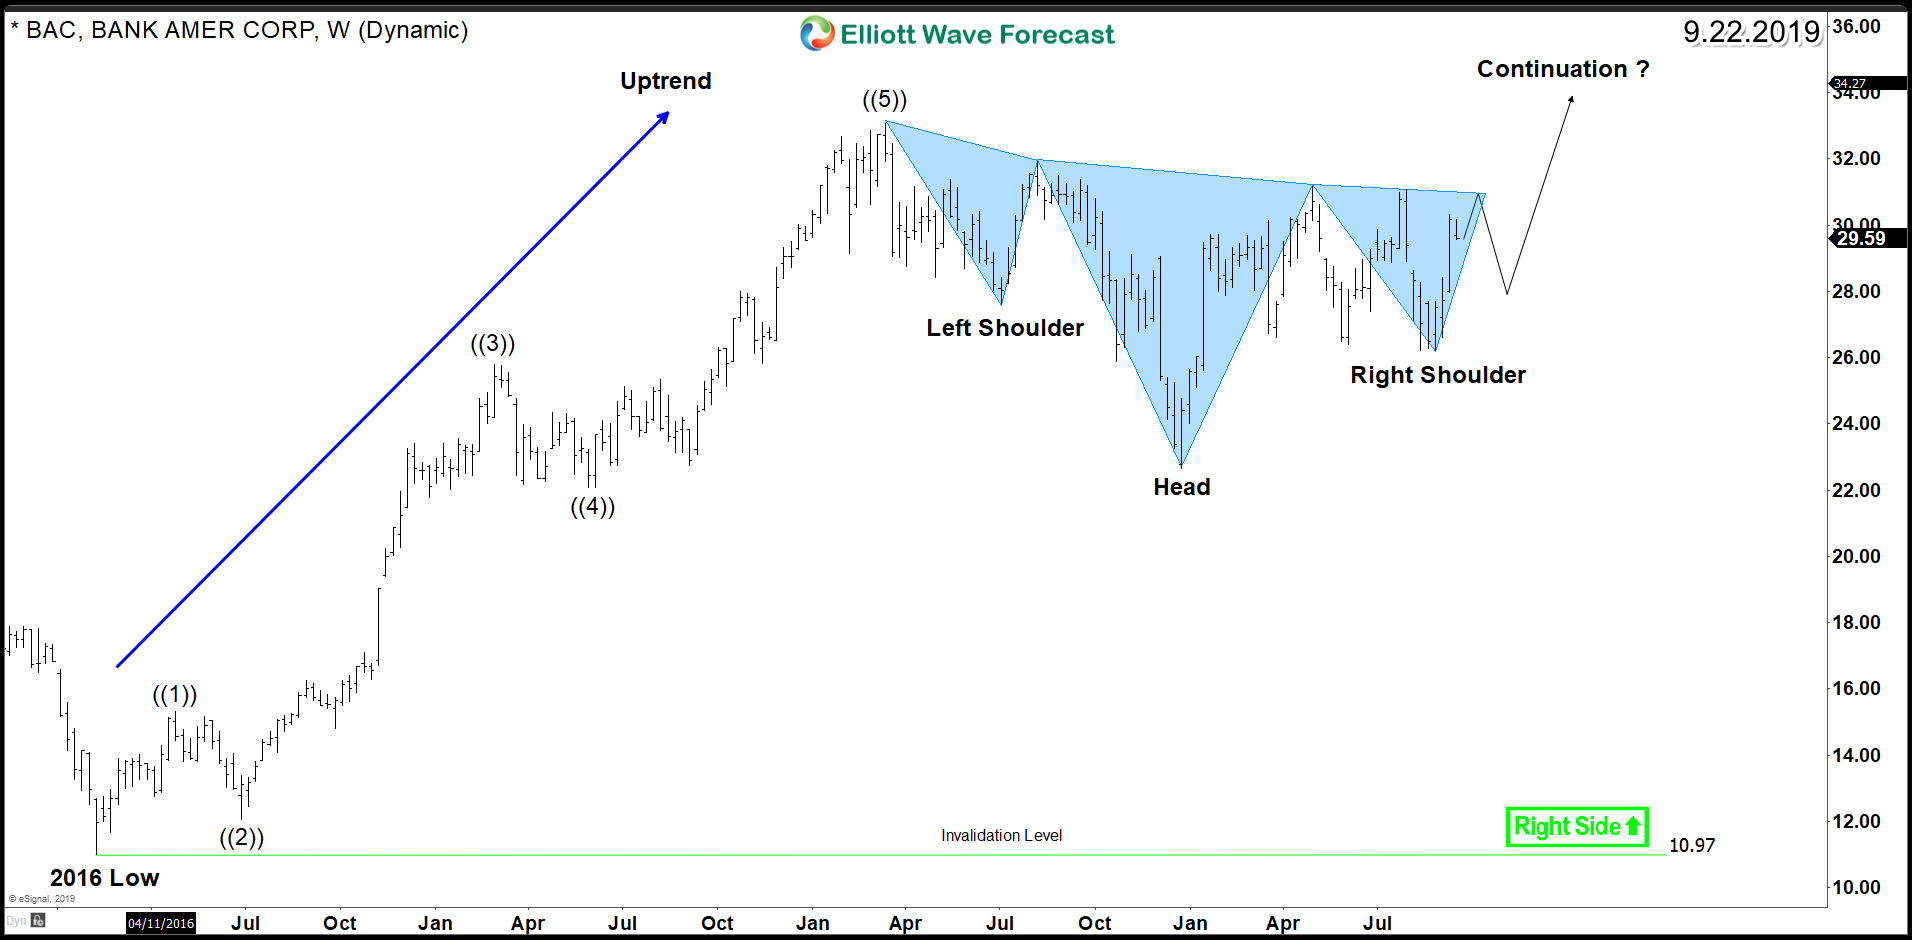
Bank Of America (NYSE: BAC) Inverted Head & Shoulder
Read MoreBank Of America (NYSE: BAC) recovered 50% of the 2008 financial crisis crash while majority of banks already rallied back to new all time highs. The stock is still showing positive signs as the rallies taking place since 2009 low are unfolding as an Elliott Wave impulsive structure. BAC recent daily rally from 2016 low […]
-

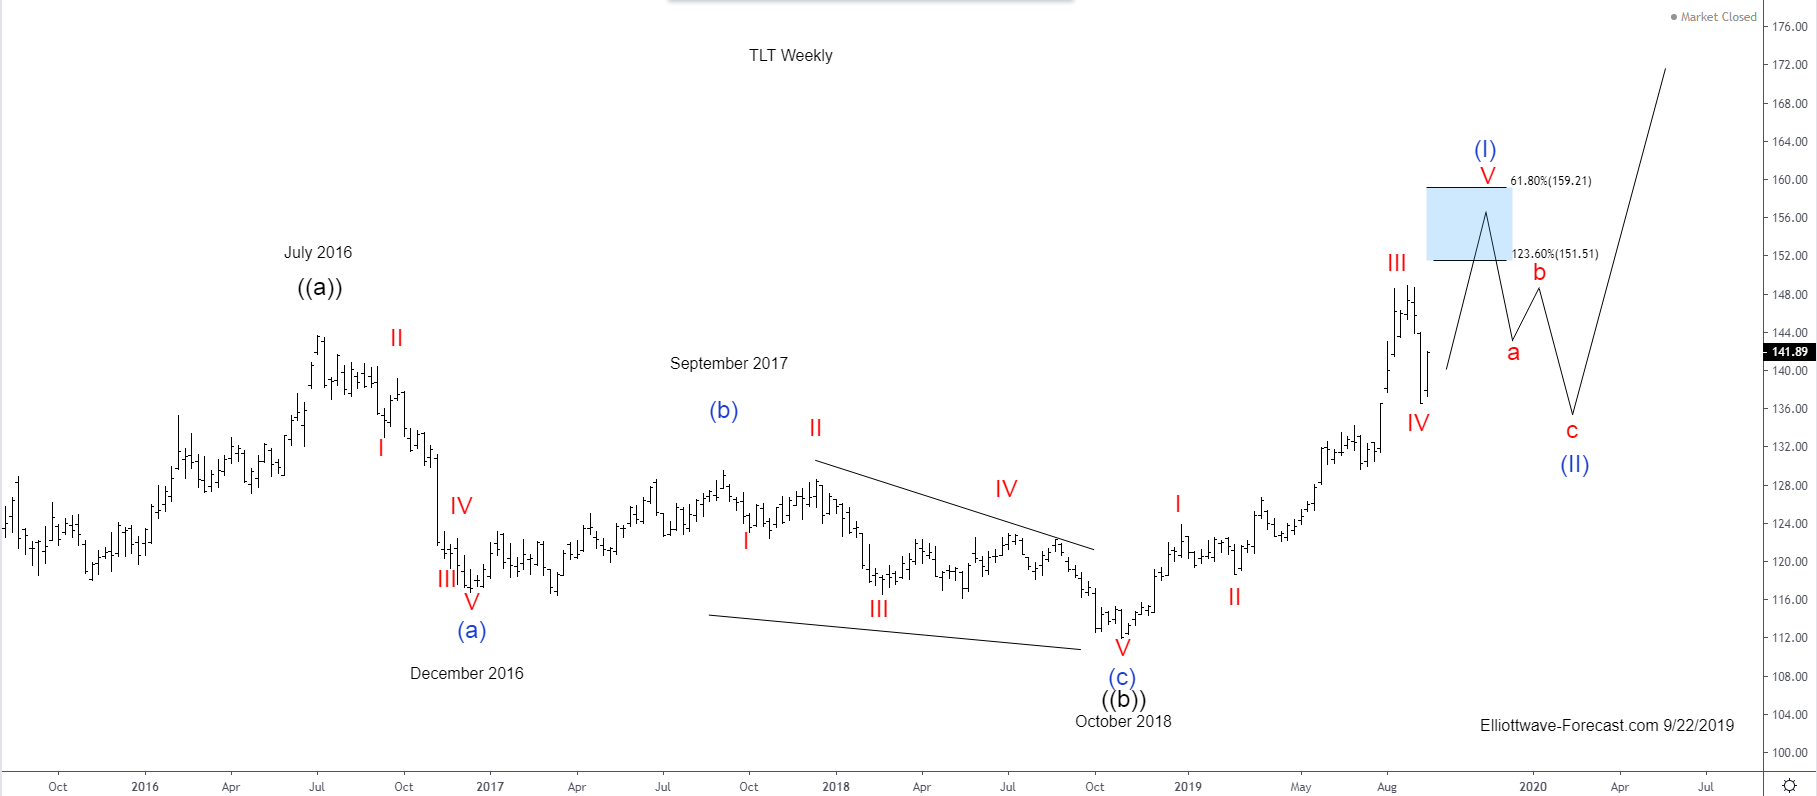
The TLT Longer Term Cycles and Elliott Wave Analysis
Read MoreThe TLT Longer Term Cycles and Elliott Wave Analysis Firstly the ETF fund TLT inception date was on July 22, 2002. This instrument seeks to track the investment results of an index composed of or in U.S. Treasury bonds with maturities twenty years or more remaining. There is a lack of data before July 22, 2002. This is […]