
The Power of 3-7-11 and the Grand Super Cycle: How We Saw the Bullish Turn in April 2025 Back on April 9, 2025, while World Indices were dropping sharply and global sentiment had turned overwhelmingly bearish, we published an article that challenged the fear-driven narrative. We explained why selling was not the right approach and […]
-

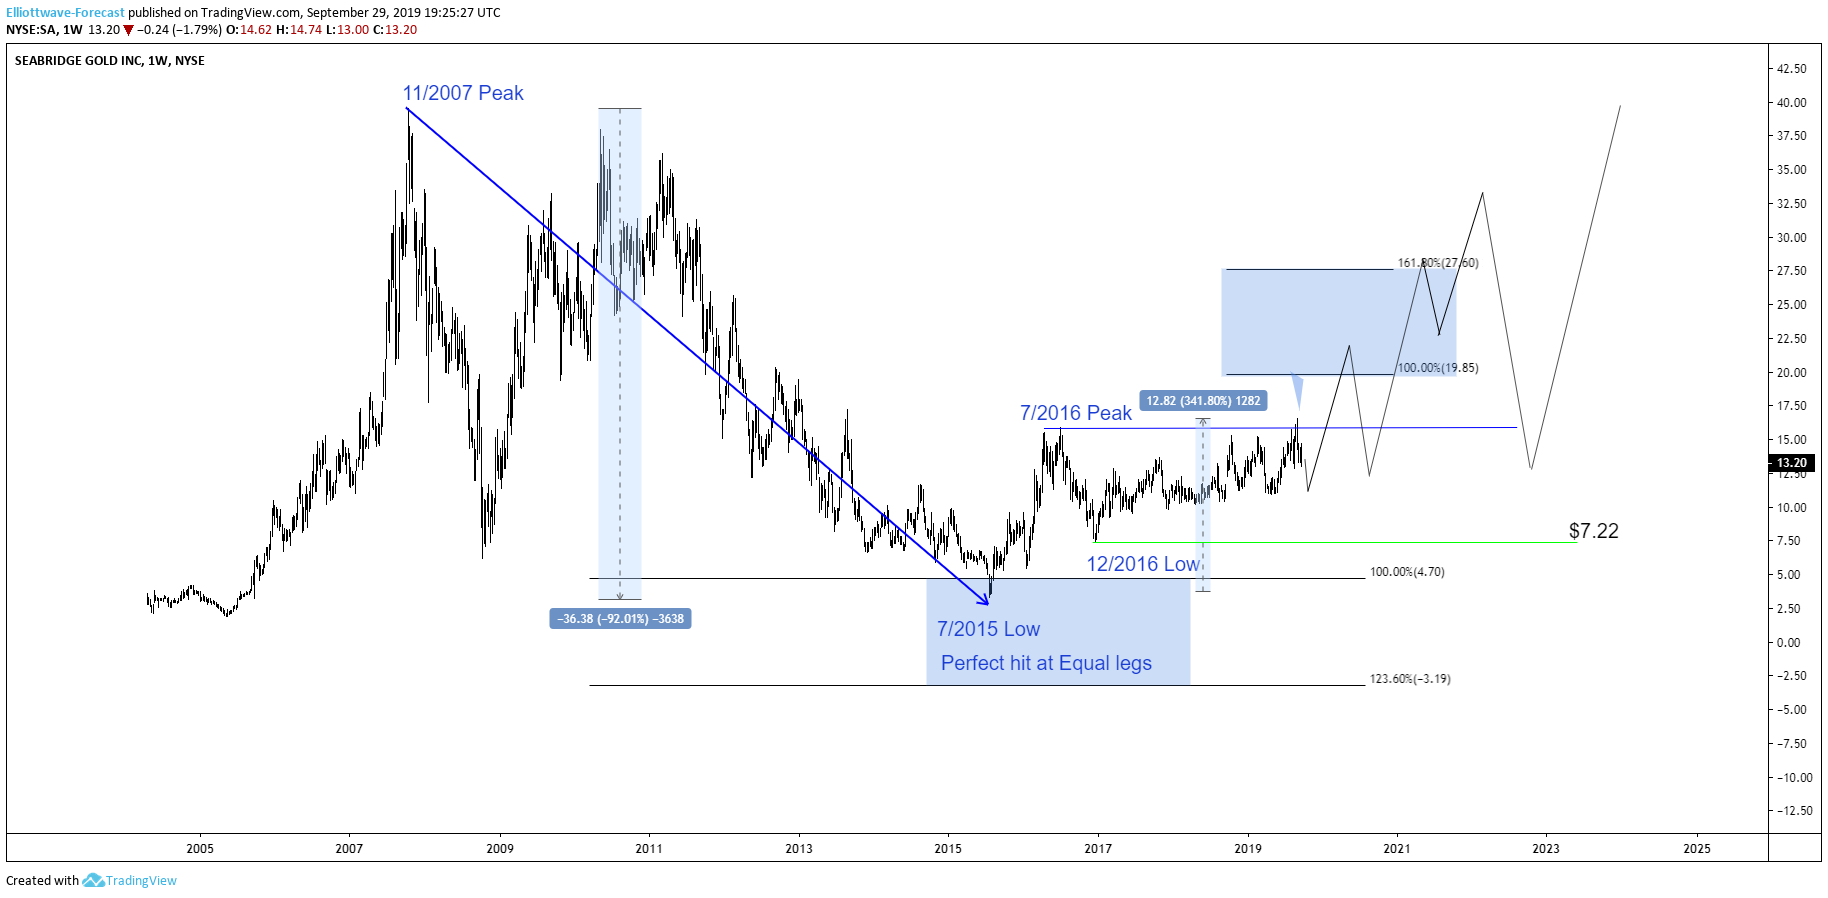
Seabridge Gold Analysis: Stock Should Remain Supported
Read MoreIn today’s blog, we will have a look at the Seabridge Gold stock. The stock is listed in the SP 500. Seabridge Gold is a Canadian resource gold mining company headquartered in Toronto Ontario Canada. It was founded in 1979 as Copper Mines Ltd. Over the last years, the stock lost 91% of its value. Starting from November […]
-

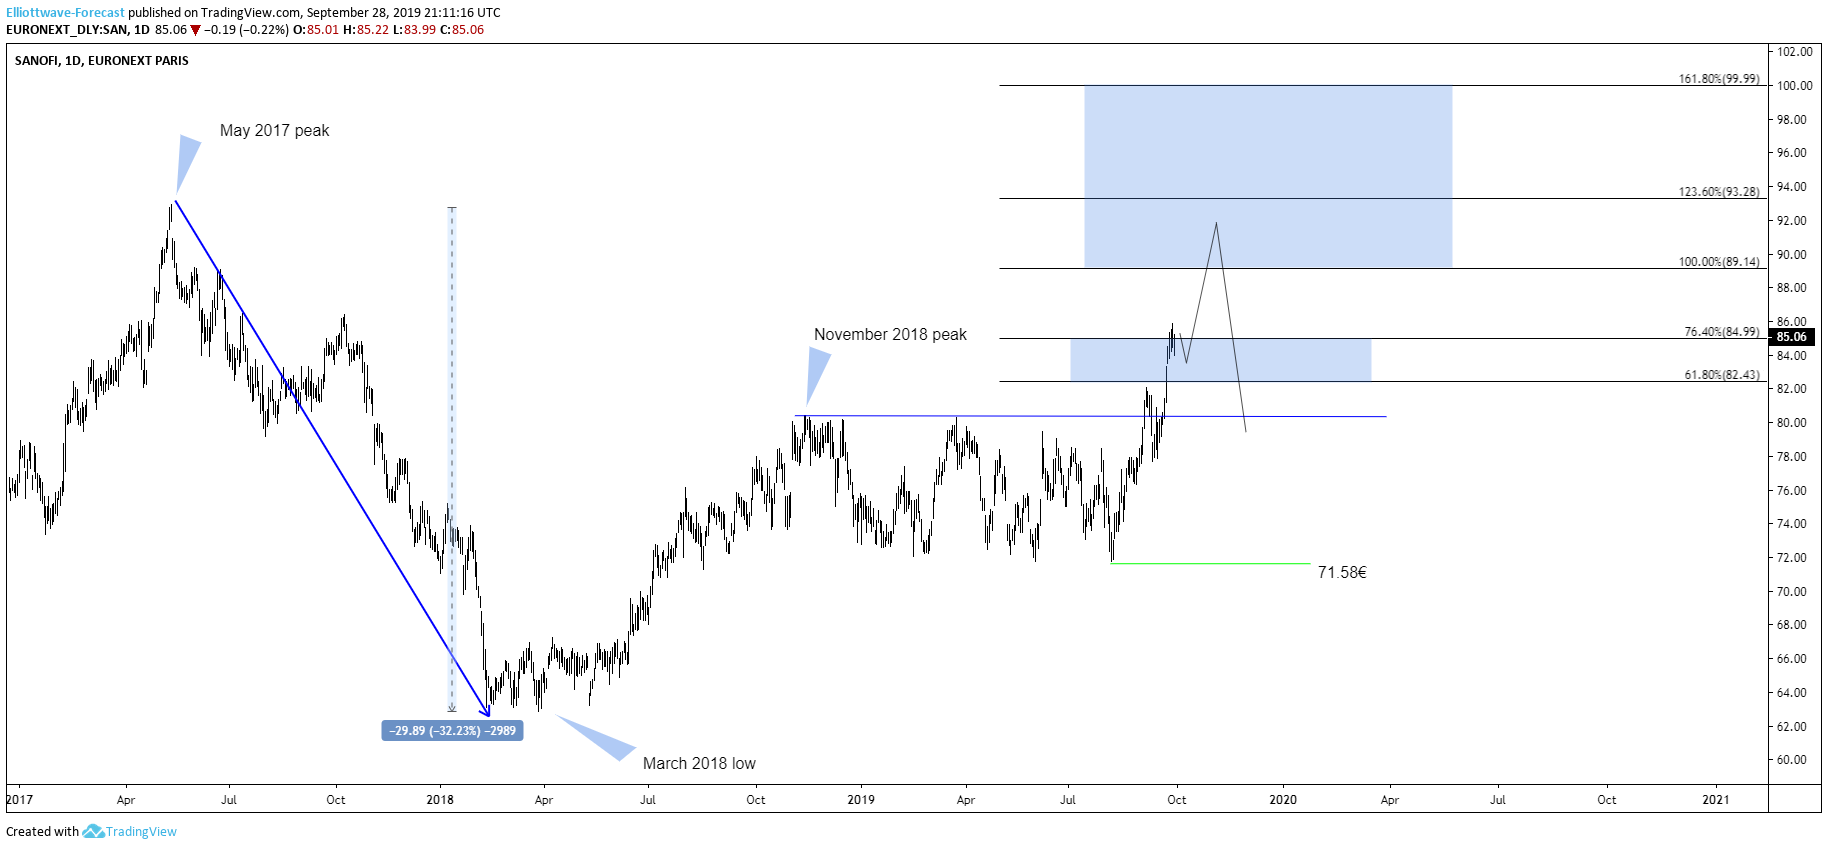
Sanofi S.A. Daily Analysis: More Upside To Come
Read MoreHello fellow traders. In today’s blog, we will have a look at the Sanofi stock. The stock is listed in the Eurostoxx 50. Sanofi S.A.is a French multinational pharmaceutical company headquartered in Paris, France. It is one of the biggest companies based on prescription sales in Europe. Over the last couple of years, the stock almost lost 33 of its value. […]
-

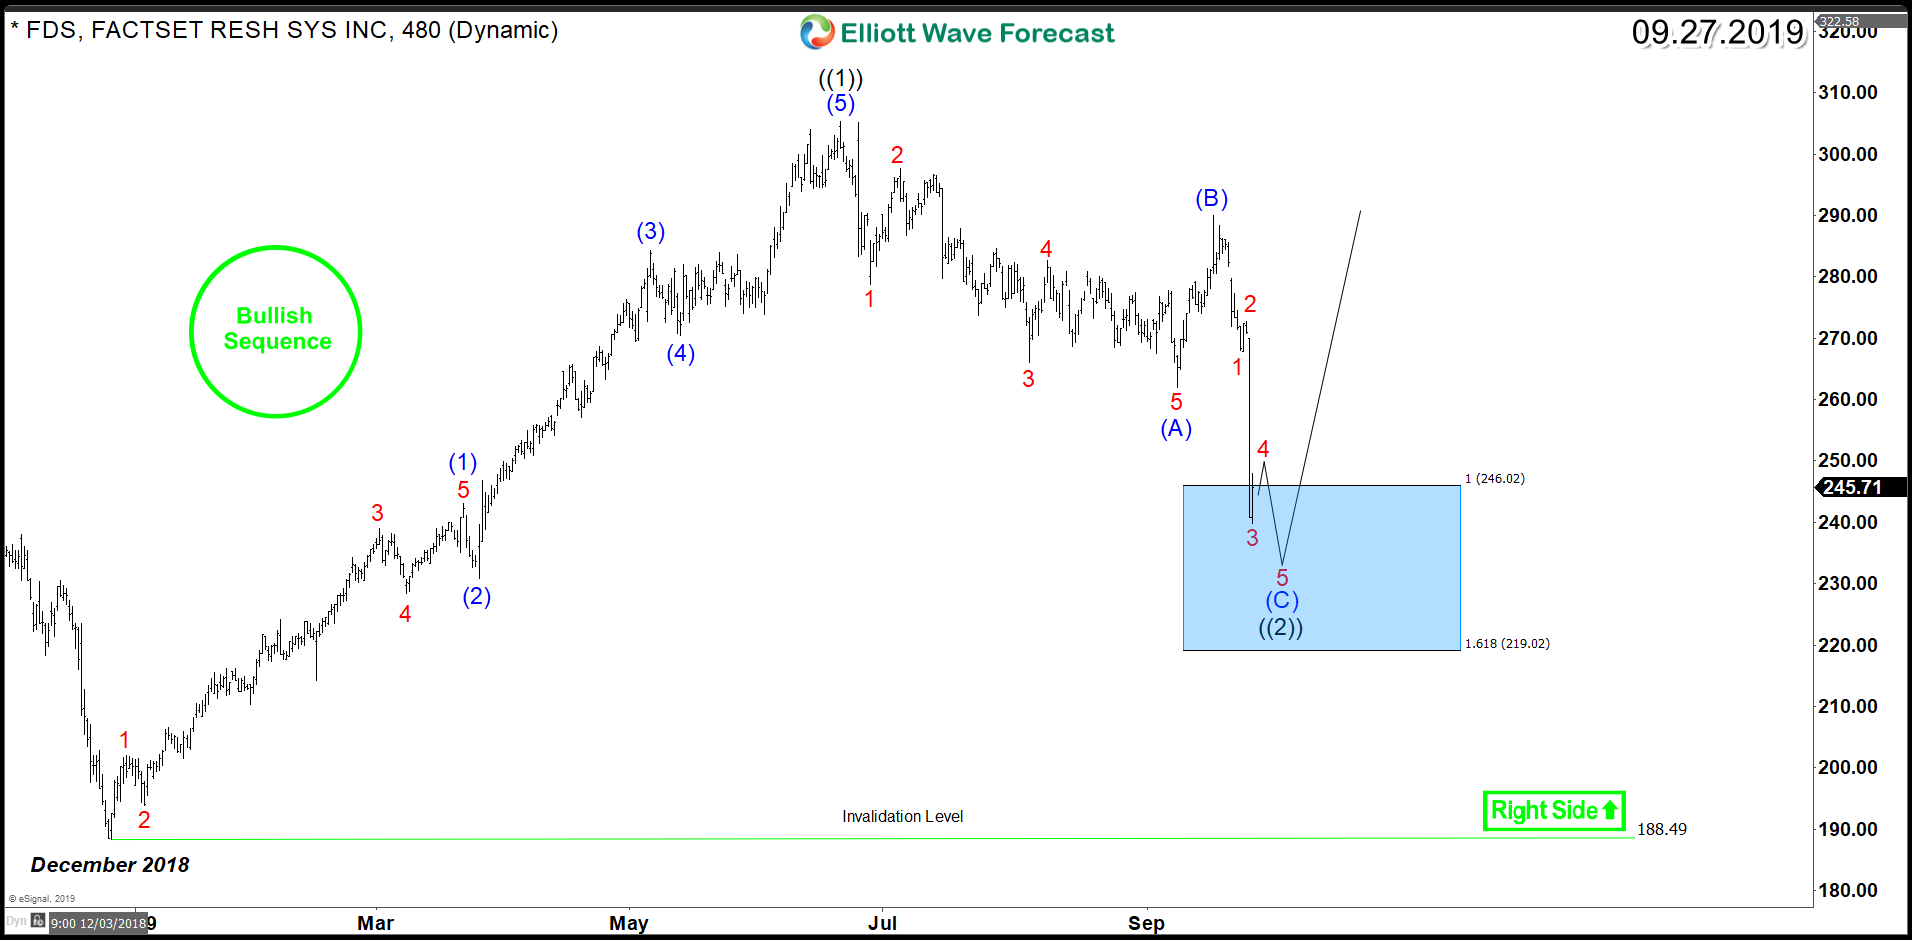
FactSet Research Systems (NYSE: FDS) Technical correction
Read MoreFactSet Research Systems (NYSE: FDS) is a financial data and software company providing financial information and analytic software for investment professionals in the United States, Europe, and the Asia Pacific. Shares of FactSet dropped 11% following the release of fiscal its fourth-quarter financial results despite beating analysts’ forecast. Revenue climbed 5%, lifting adjusted net income by 19% […]
-

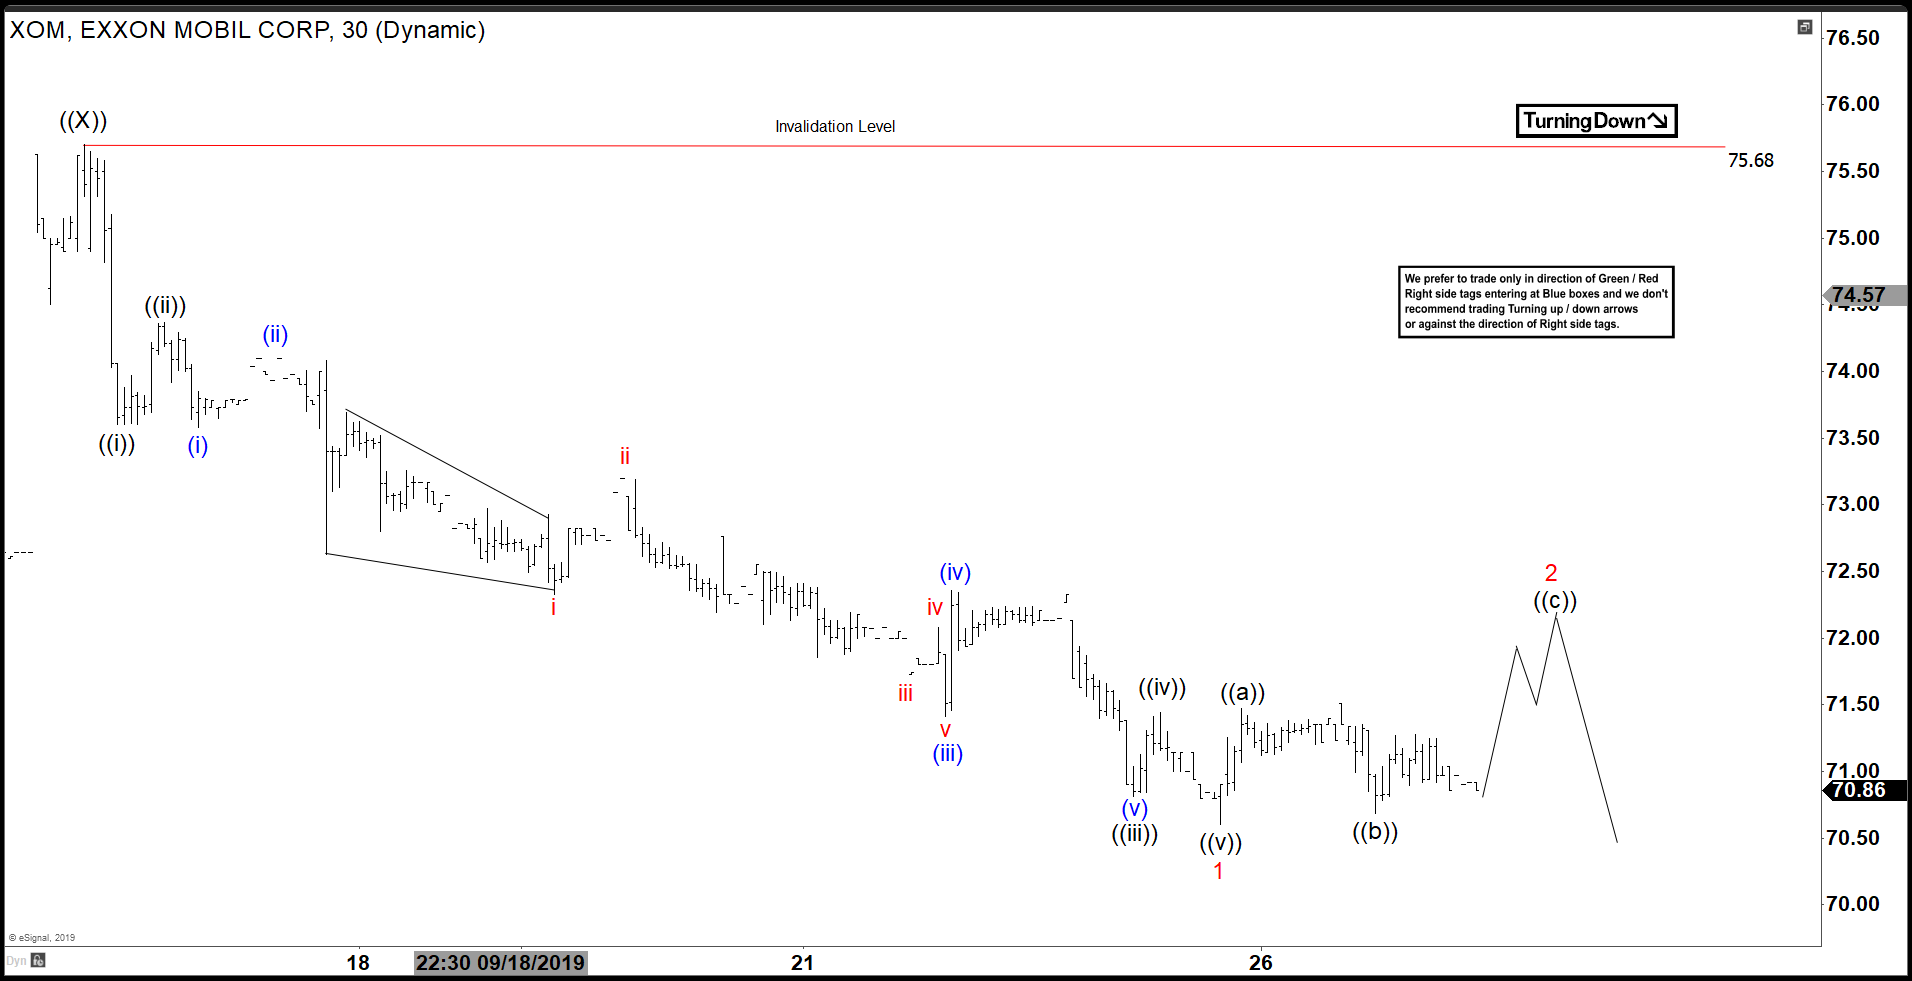
Elliott Wave View: Further Downside in Exxon Mobil (XOM)
Read MoreShort term Elliott Wave view on Exxon Mobil (ticker: XOM) suggests the rally to 75.68 on September 16, 2019 high ended wave ((X)). The stock has turned lower and the structure of the decline unfolded as a 5 waves impulse Elliott Wave structure. Down from 75.68, wave ((i)) ended at 73.6 and bounce to 74.37 ended […]