
-
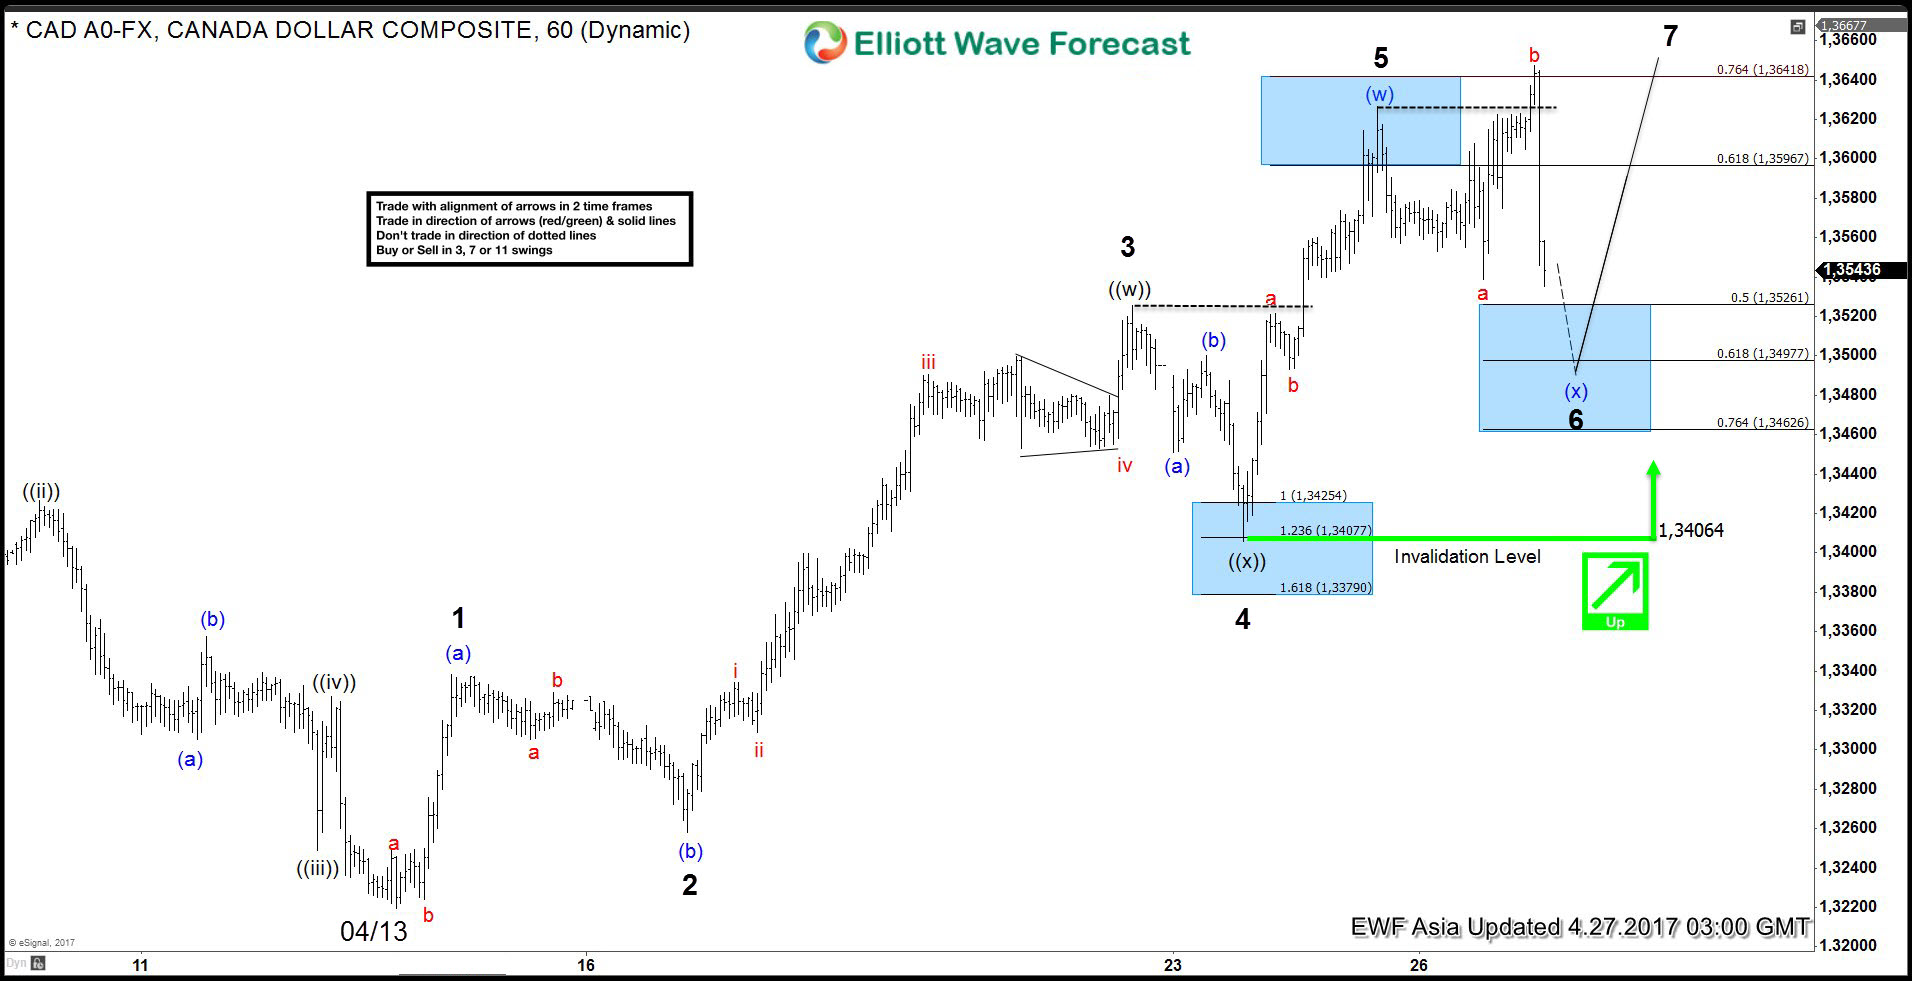
USDCAD swings sequence calling the rally
Read MoreHello fellow traders. In this technical blog we’re going to take a quick look at the past Elliott Wave chart of USDCAD published in members area of www.elliottwave-forecast.com. In further text we’re going to explain the structure,count the swings and see how we forecasted the path. USDCAD Elliott Wave 1 Hour Chart 04.27.2017 As our members […]
-

GBPNZD forecasting the rally & buying the dips
Read MoreThe video below is a capture from the London Live Session held on April 7th. Daud presented Elliott Wave count of GBPNZD ,explaining 2 pontential scenarios and trading strategy. GBPNZD Trading strategy As Daud mentioned in the video, we’re calling for further rally in the pair due to incomplete bullish sequences it’s having in 4 […]
-
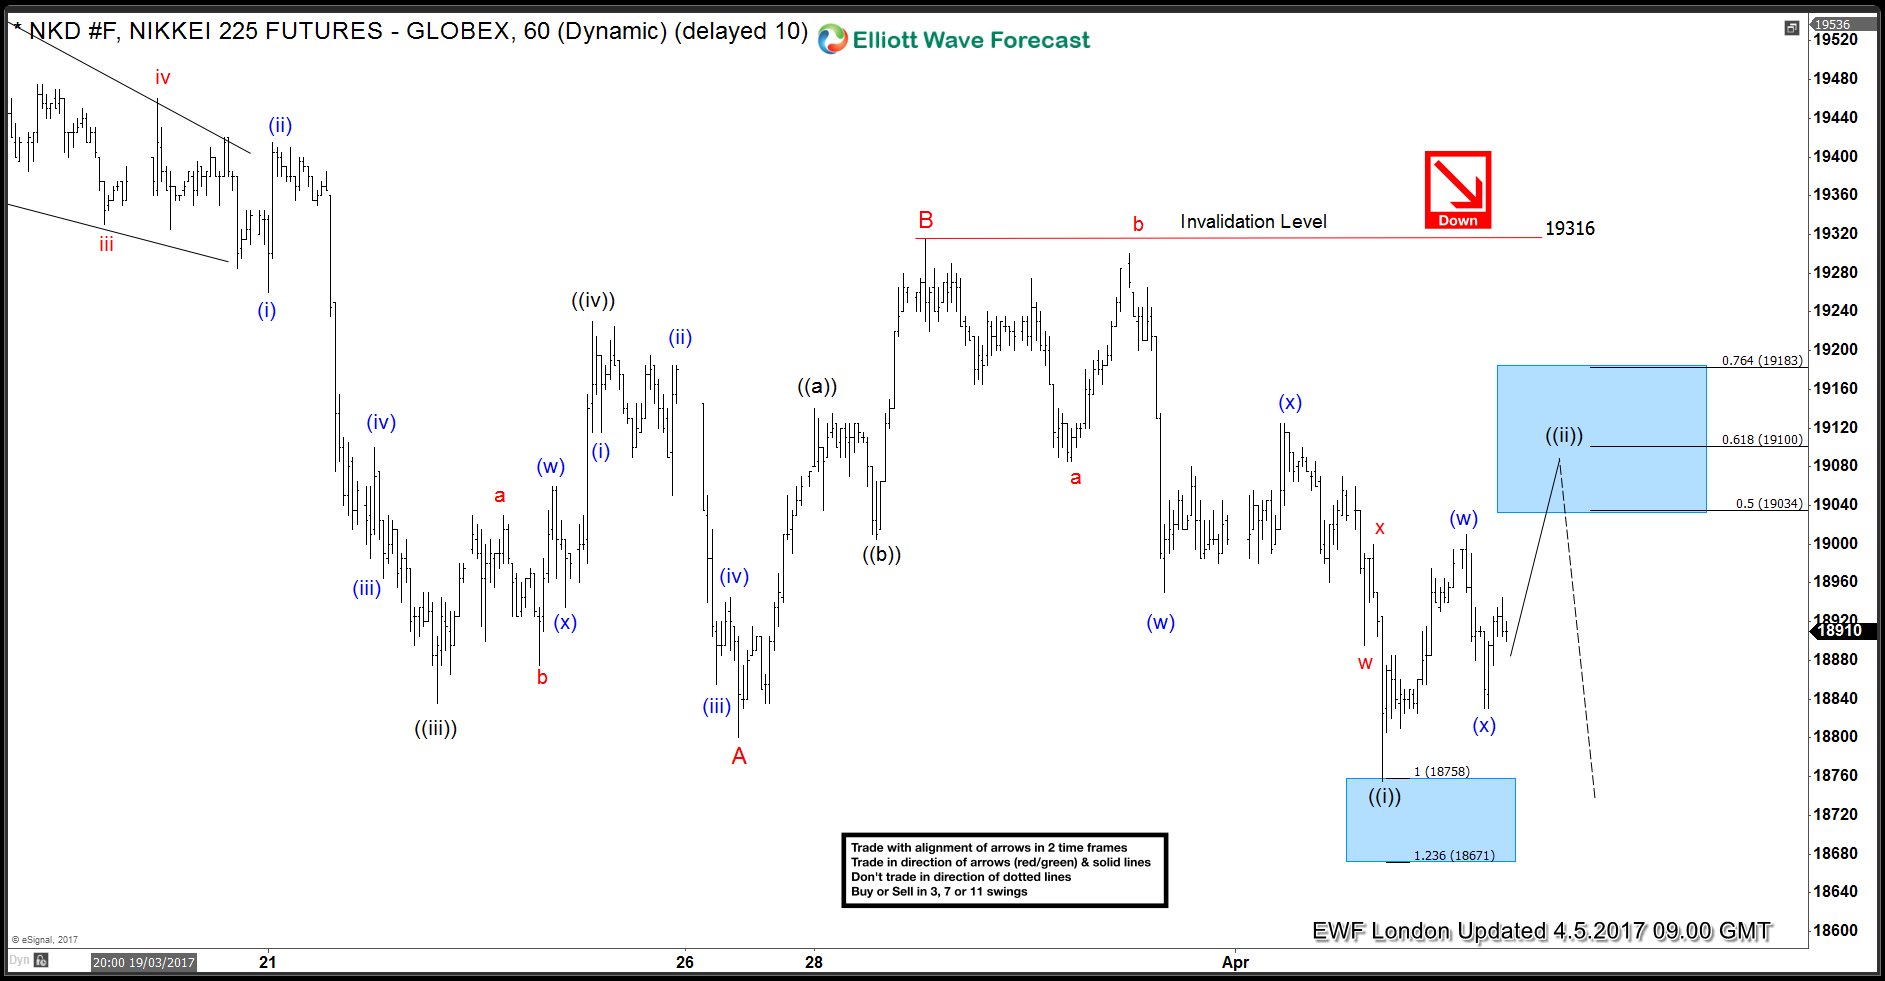
Nikkei Elliott Wave structure calling the decline
Read MoreHello fellow traders. In this technical blog we’re going to take a quick look at the past Elliott Wave charts of Nikkei published in members area of www.elliottwave-forecast.com. We’re going to explain the structure and see how we forecasted the path. Let’s start by taking a look at Nikkei 4 hour chart from 04.05.217. As we […]
-
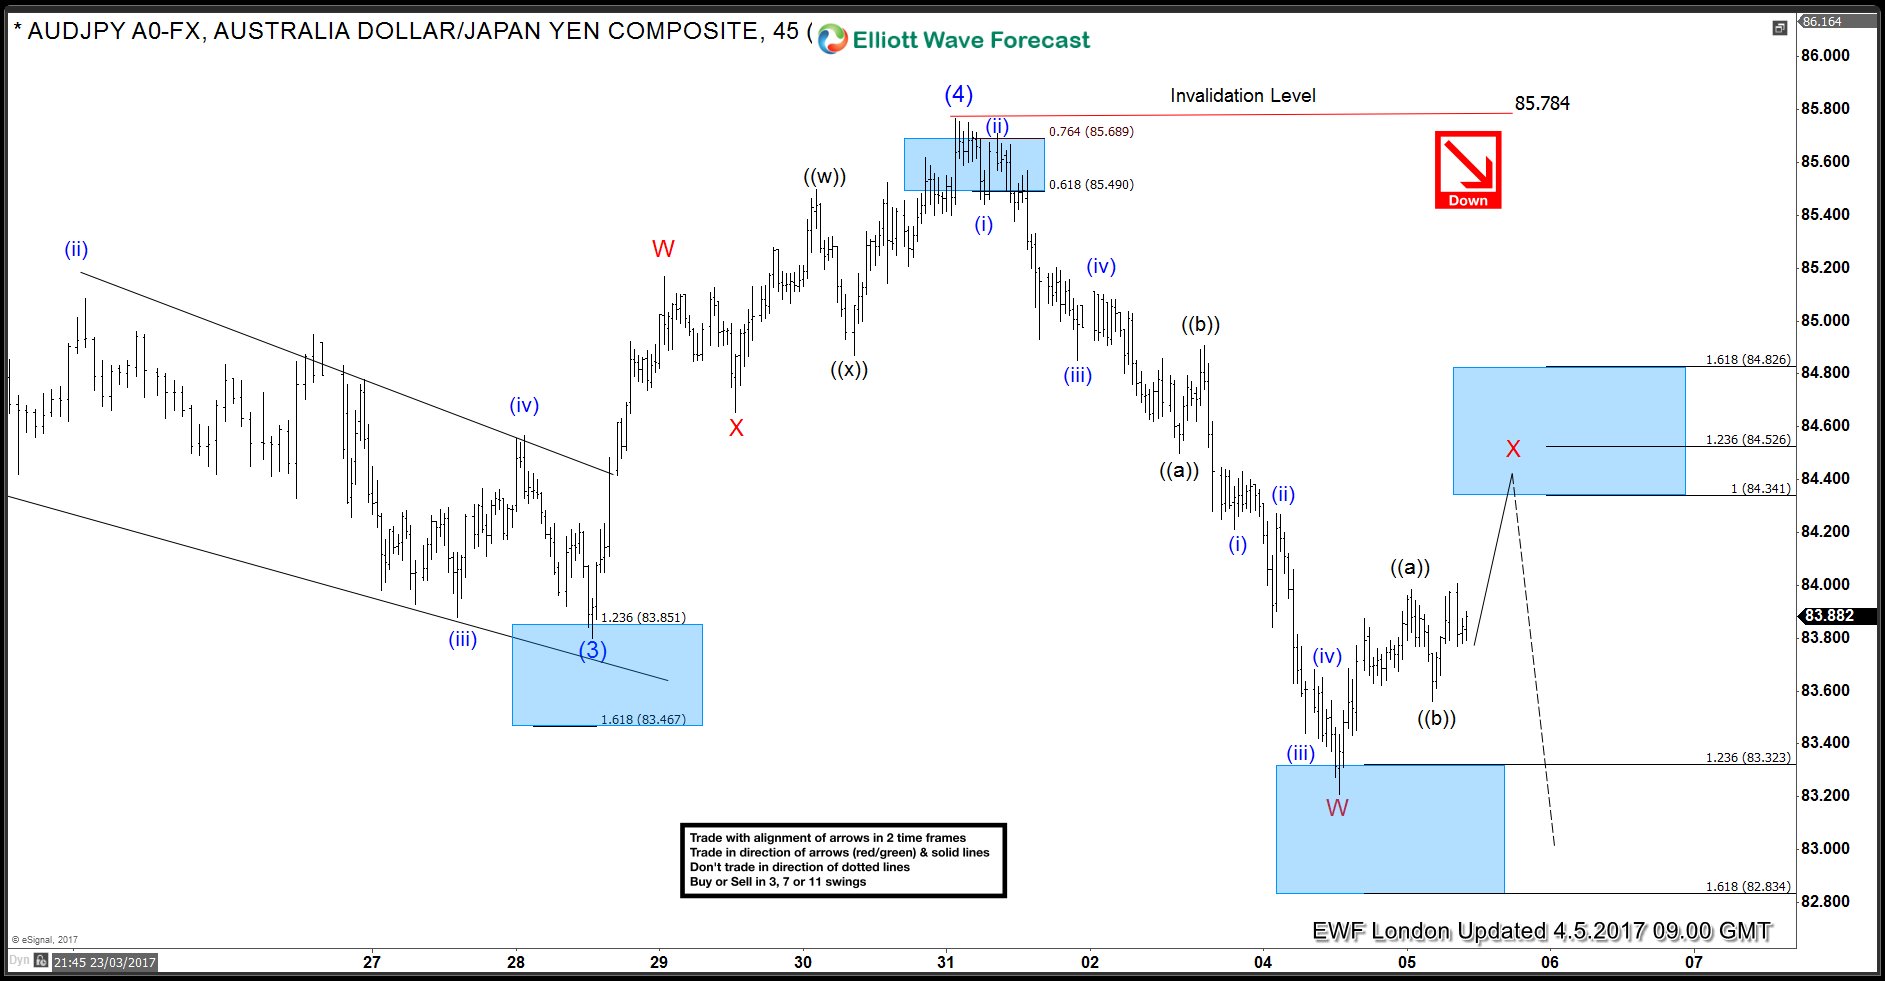
AUDJPY swings sequence calling the decline
Read MoreHello fellow traders. In this technical blog we’re going to take a quick look at the past Elliott Wave charts of AUDJPY published in members area of www.elliottwave-forecast.com. We’re going to explain the structure and see how we forecasted the path. The chart below is AUDJPY 4 hour chart from 04.04.217. Our analysis suggests that cycle […]
-
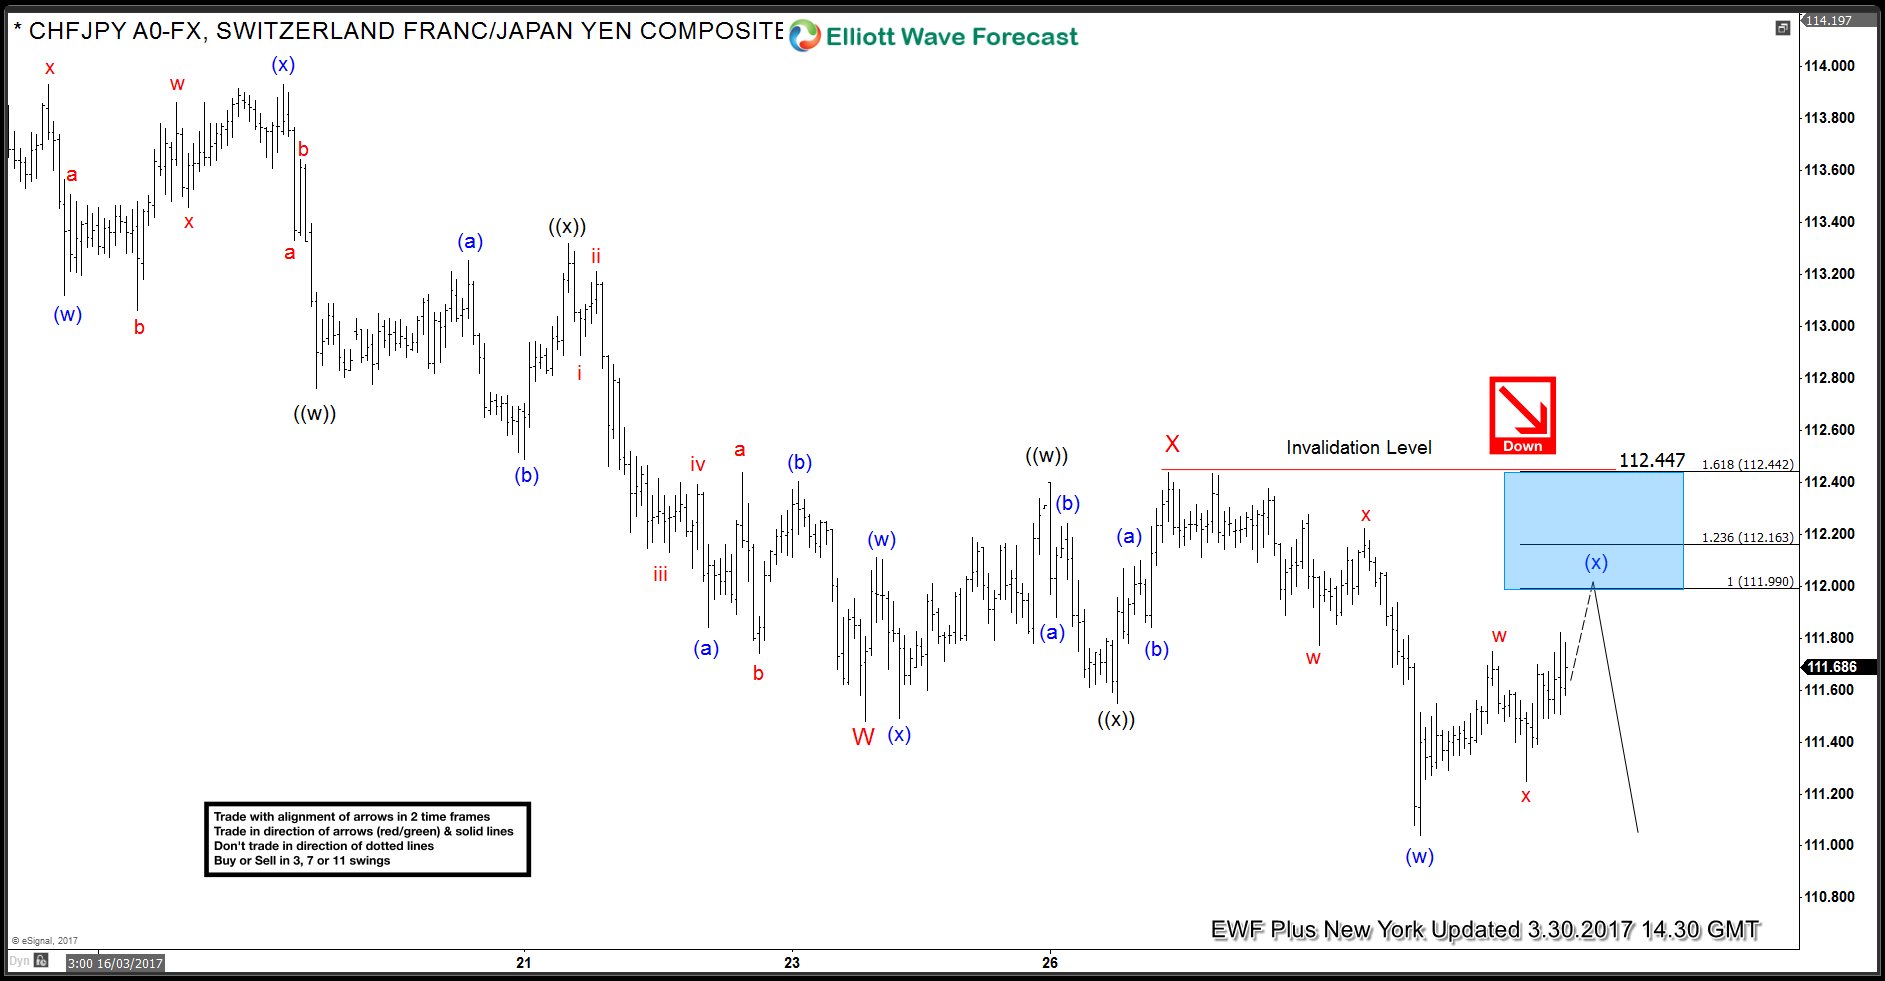
CHFJPY forecasting the decline and selling the rallies
Read MoreHello fellow traders. In this technical blog we’re going to take a quick look at the another nice trading opporunity we have had lately. The instrument we traded is $CHFJPY. In further text we’re going to explain price structure and reasons why we forecasted the decline. Let’s start explanation by taking a look at past Elliott […]
-
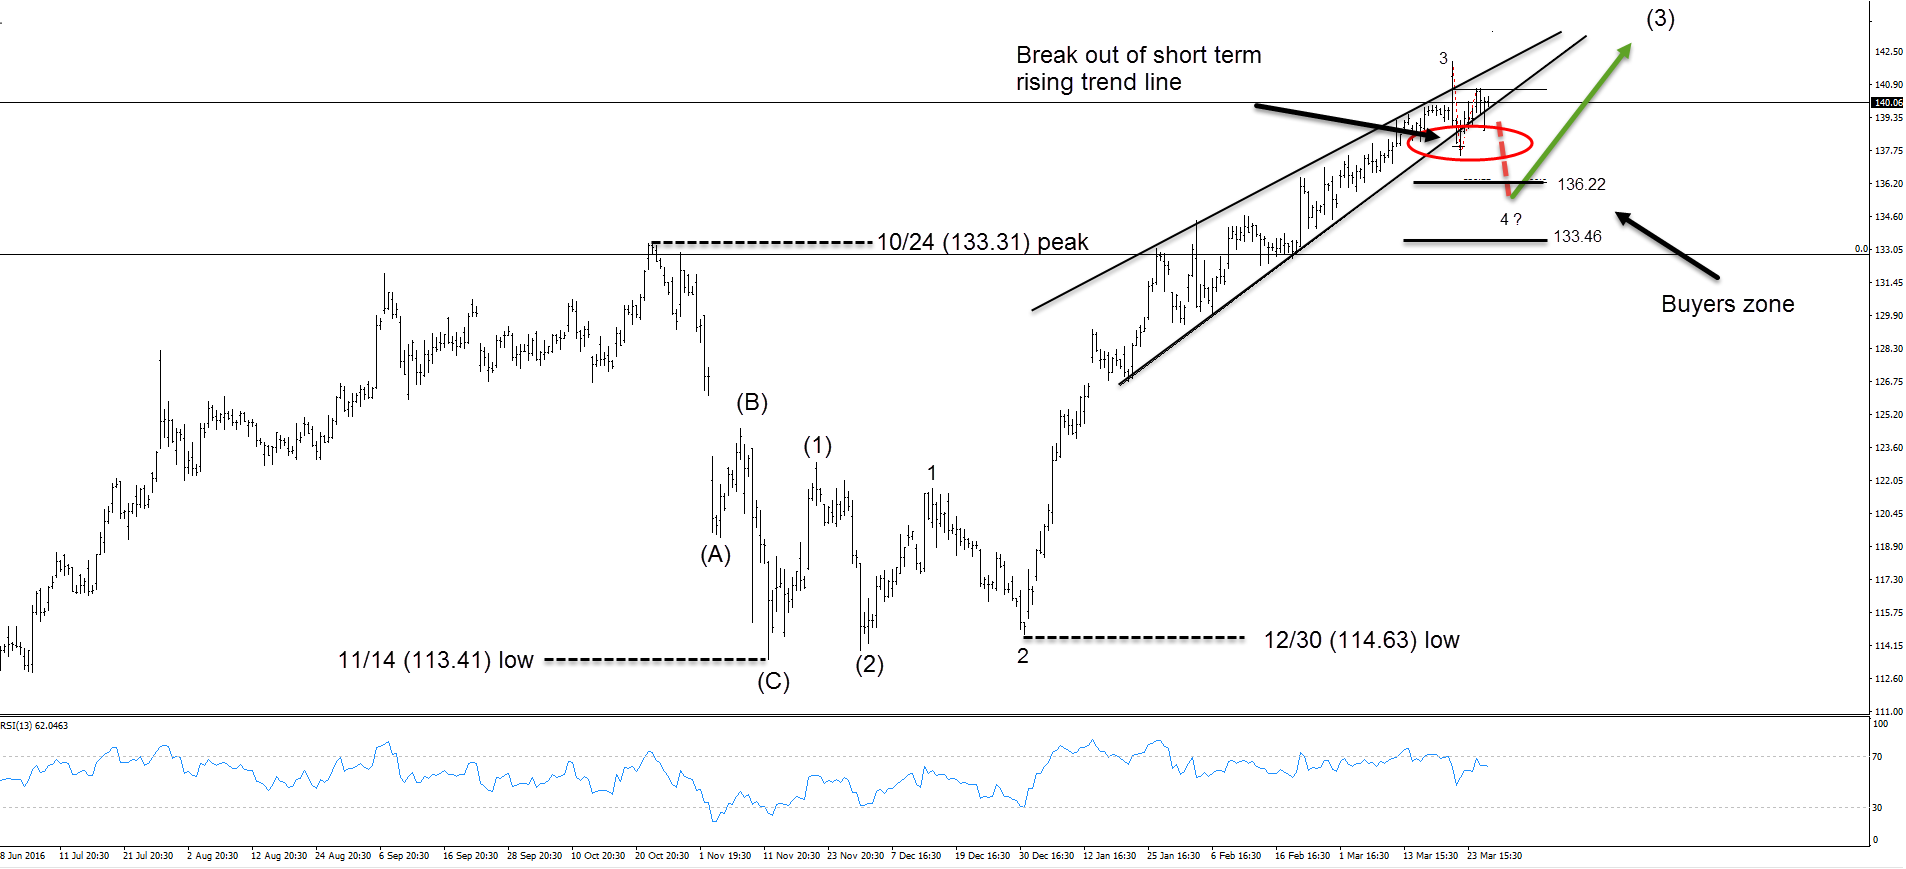
Facebook broke the short term trend line
Read MoreIn our last technical blog about Facebook, we explained that the stock is in a 3-year-old bullish trend, forecasted further rally and break above 10/24 (133.31) peak. As we can see now from the chart below, the price ended pull back at 113.41 low on November 14th as a truncation. After that, it traded sideways […]