
-

EURUSD Trading Setup Explained : Buying the Dips in the Blue Box
Read MoreAs our members know we have had many profitable trading setups recently. In this technical article, we are going to talk about another Elliott Wave trading setup we got in EURUSD. The pair has completed its correction exactly at the Equal Legs zone, also known as the Blue Box Area. In this article, we’ll break […]
-
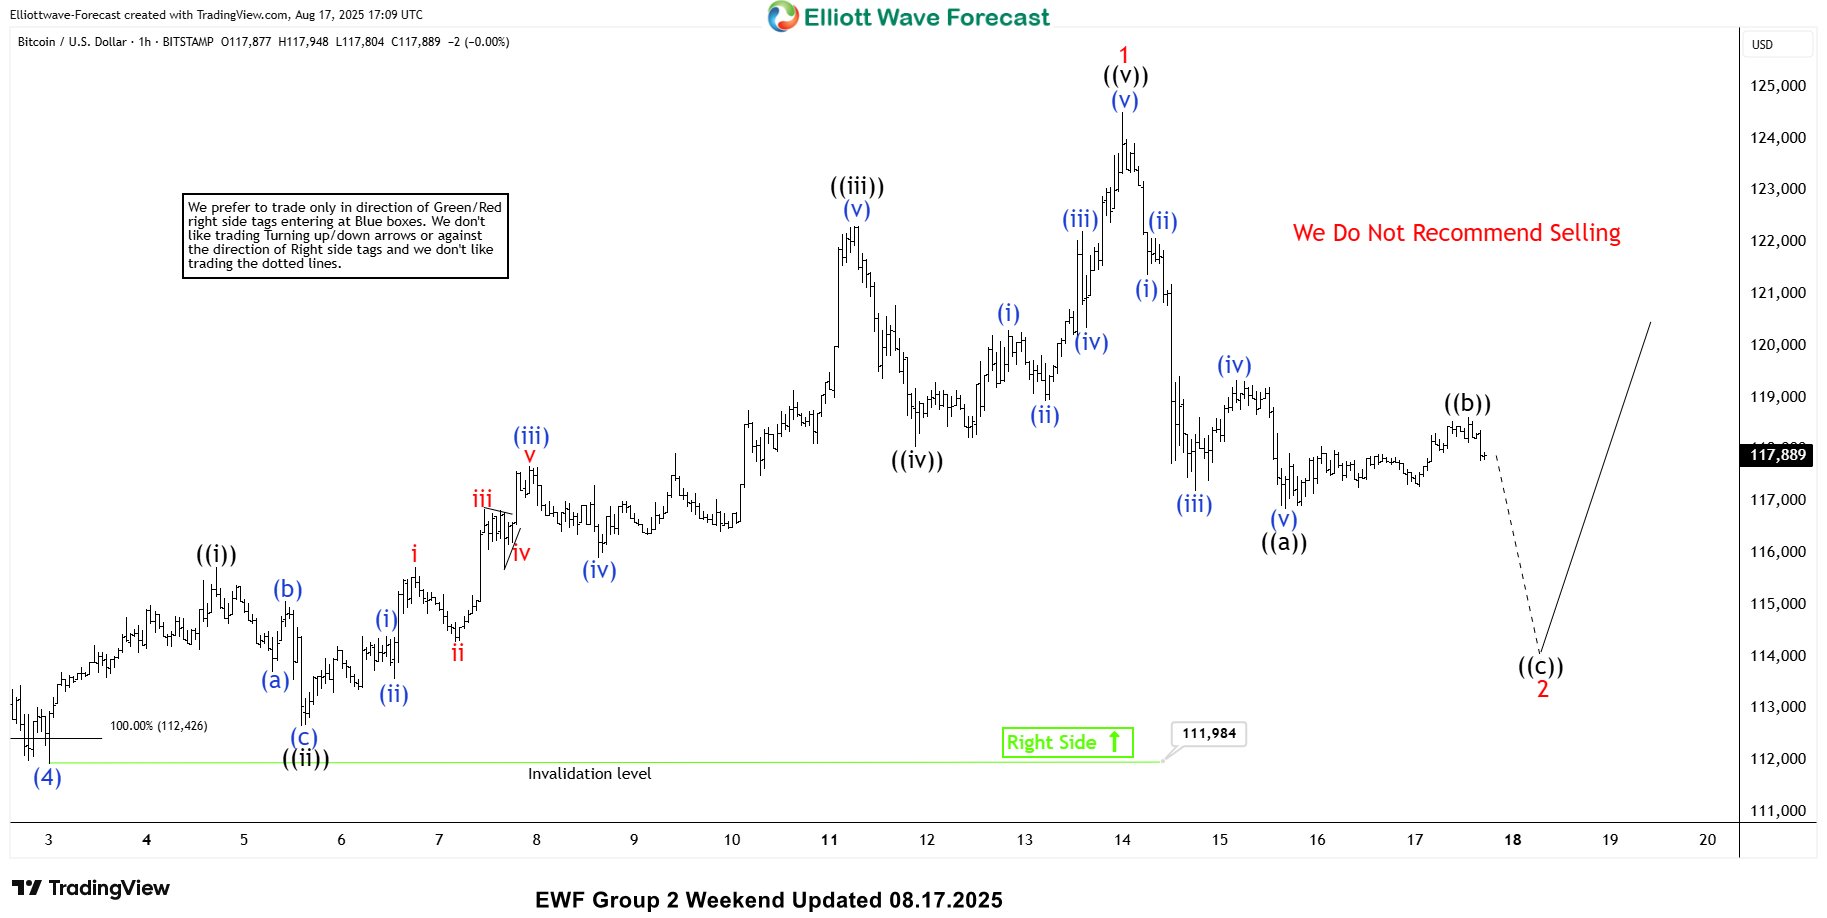
Bitcoin (BTCUSD) Elliott Wave: Forecasting the Path
Read MoreHello fellow traders. As our members know, we’ve been long in Bitcoin. The crypto has made a solid rally toward new all-time highs, gaining more than 20% since our entry on the June 22nd. In this technical article, we are going to present short term Elliott Wave forecast of BTCUSD. We were calling for a short-term weakness within […]
-
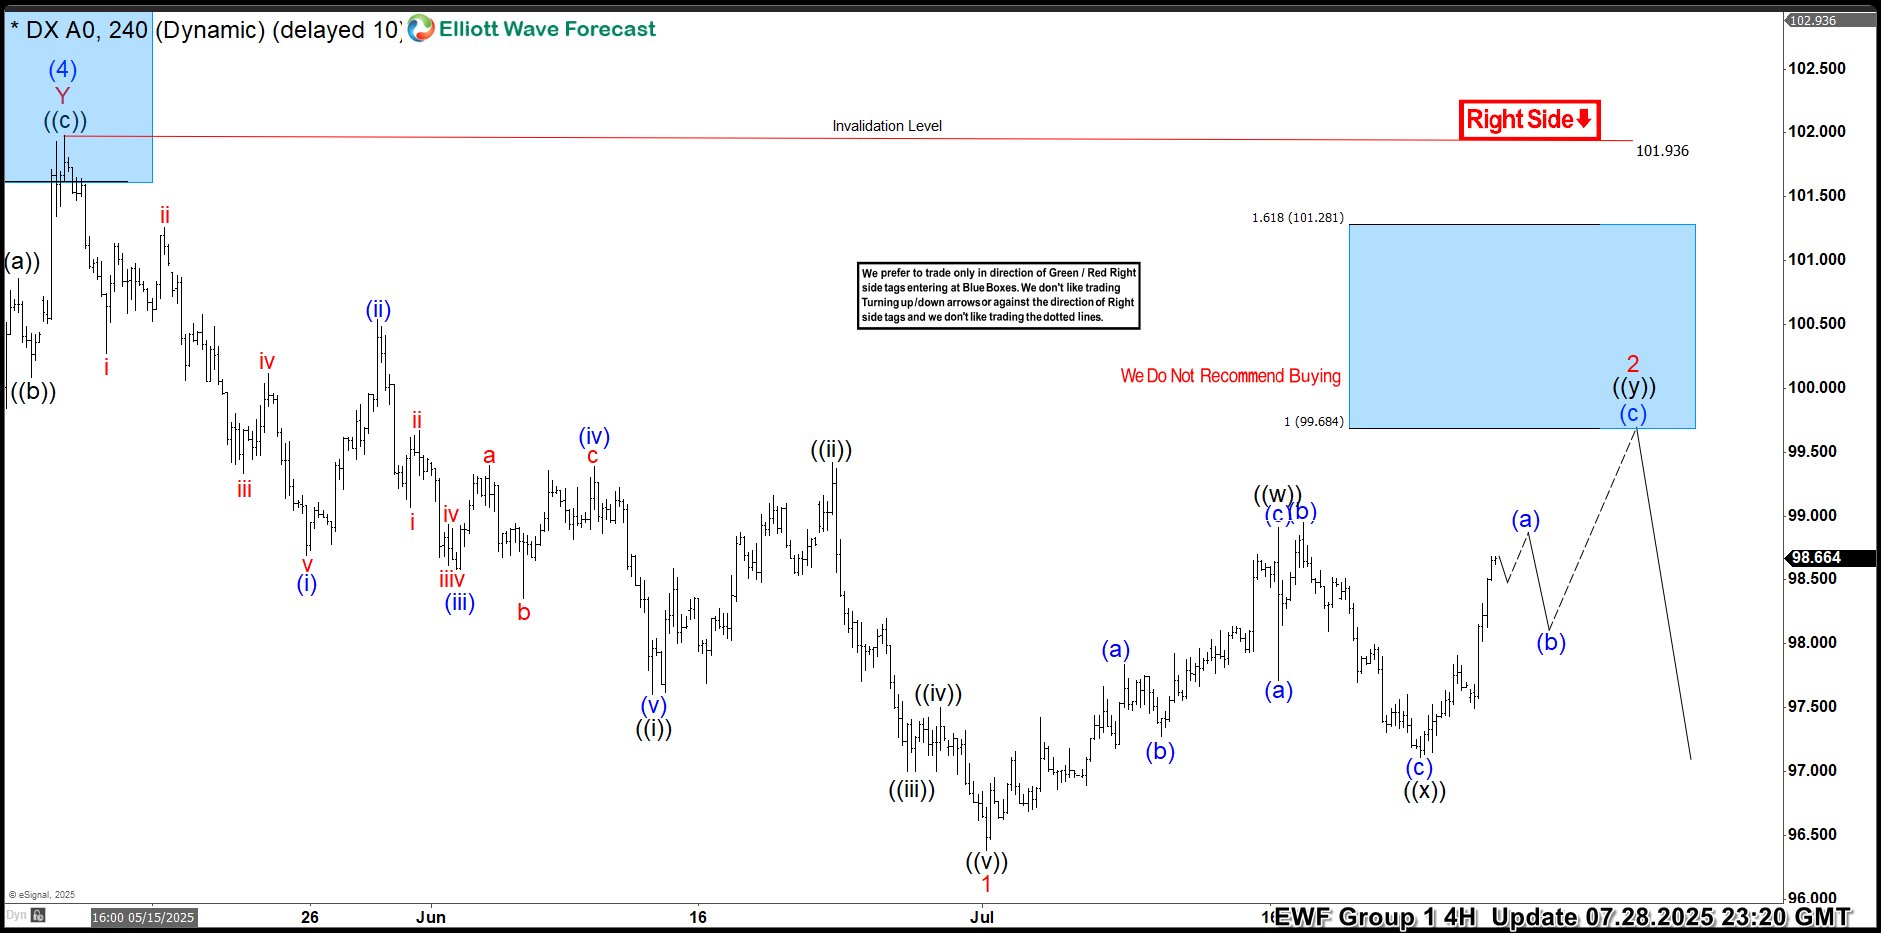
Dollar Index (DXY) Elliott Wave : Selling Rallies at the Blue Box
Read MoreHello traders. In this article, we are going to present another Elliott Wave trading setup we got in Dollar Index . As our members know DXY index remains bearish against the 101.936 pivot. Recently Dollar made a clear 3 waves recovery completed precisely at the Equal Legs zone, referred to as the Blue Box Area. […]
-
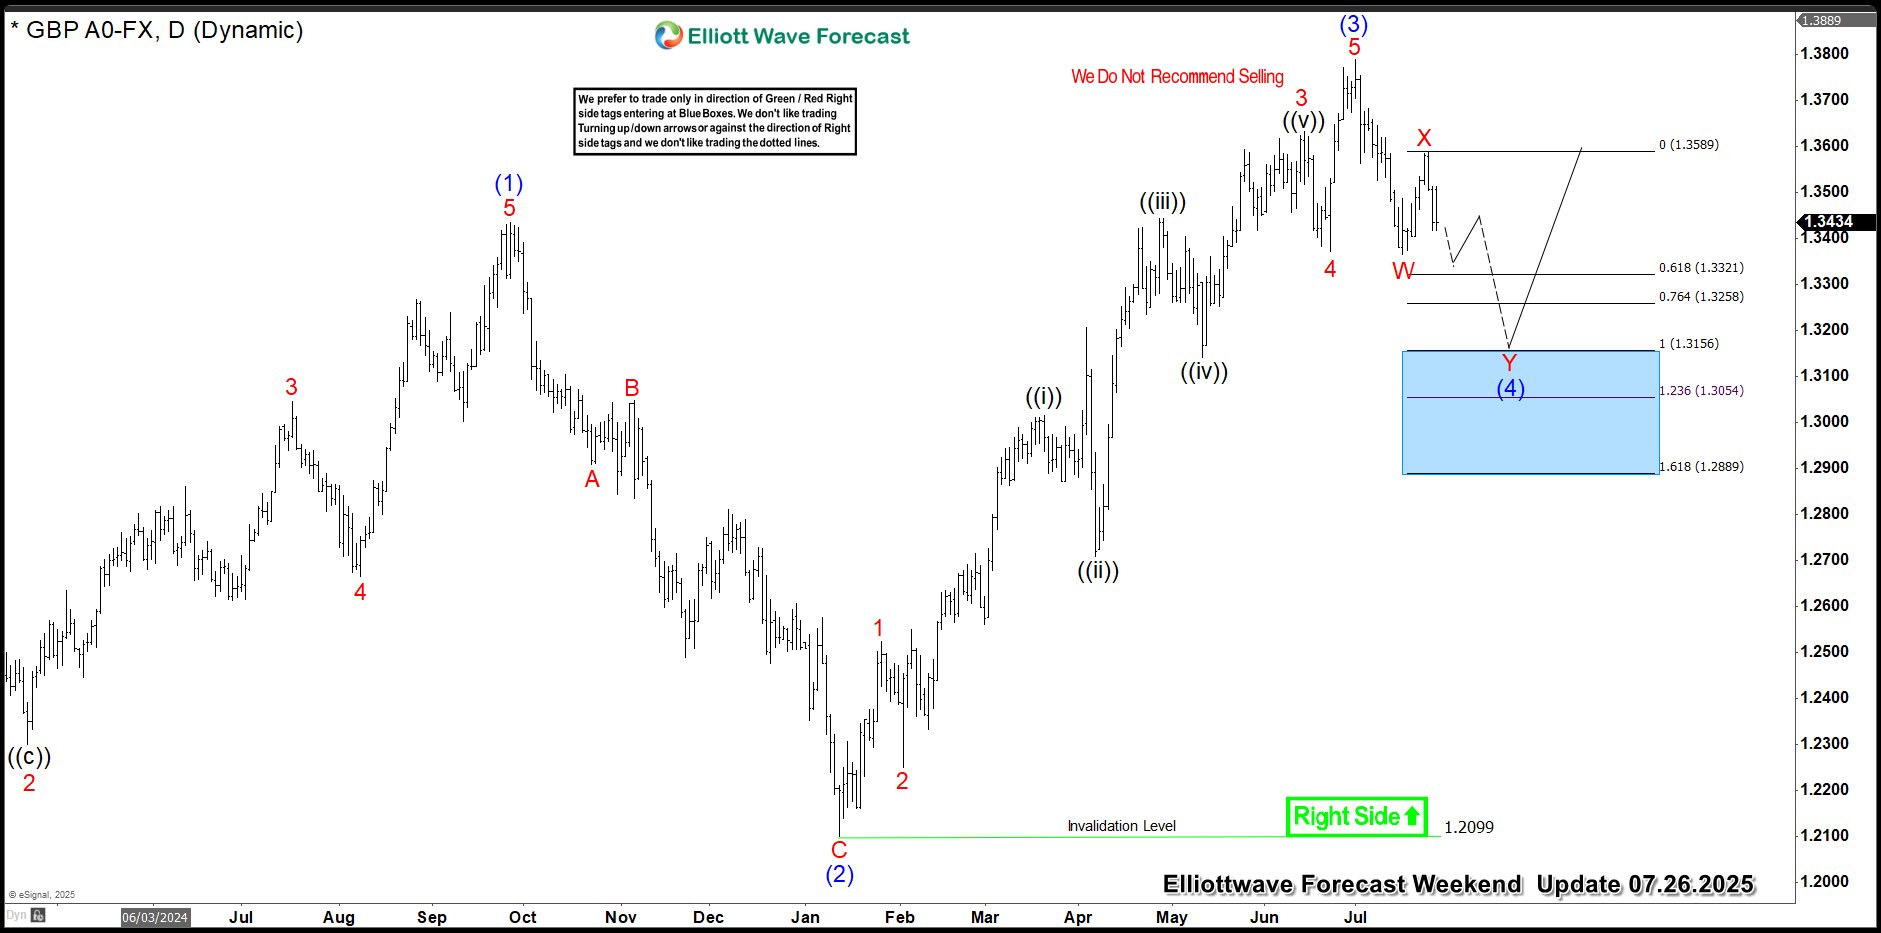
GBPUSD Elliott Wave Forecast: Buying the Dips in the Blue Box
Read MoreAs our members know we have had many profitable trading setups recently. In this technical article, we are going to talk about another Elliott Wave trading setup we got in GBPUSD. The pair has completed its correction exactly at the Equal Legs zone, also known as the Blue Box Area. In this article, we’ll break […]
-
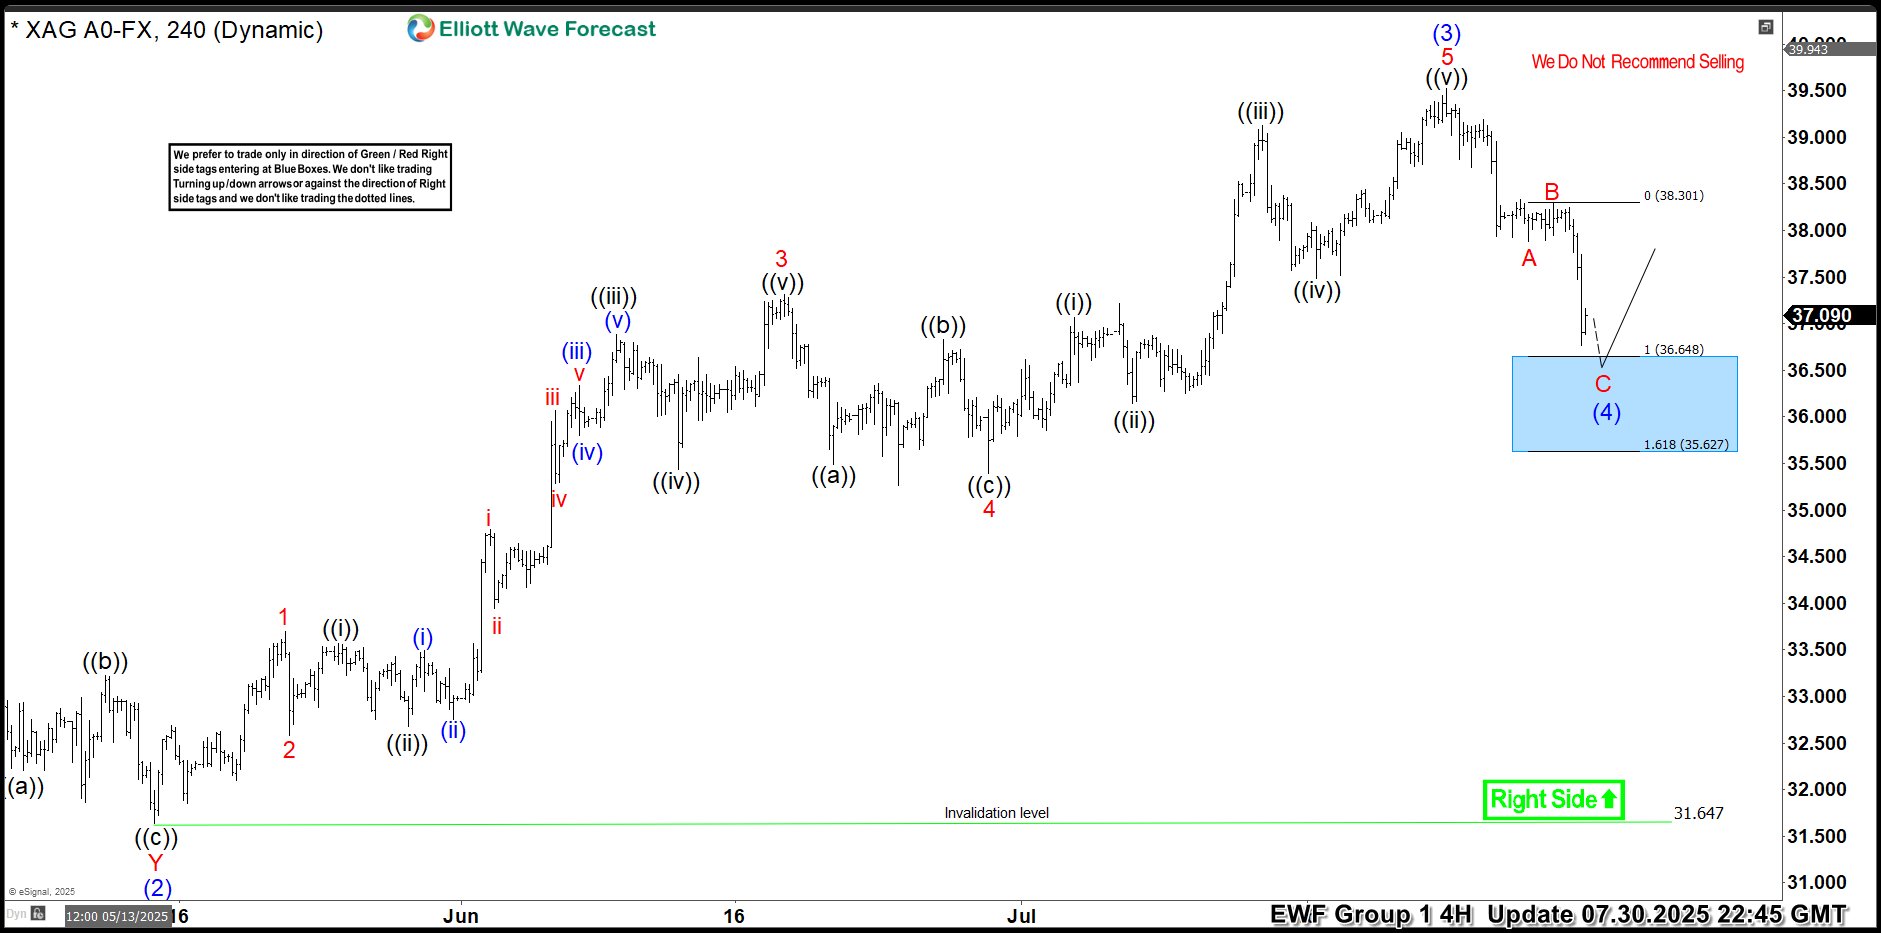
Silver (XAGUSD) Elliott Wave: Buying the Dips at the Blue Box
Read MoreHello traders. As our members know, we have had many profitable trading setups recently. In this technical article, we are going to talk about another Elliott Wave trading setup we got in Silver (XAGUSD). The commodity has completed its correction exactly at the Equal Legs zone, also known as the Blue Box Area. In this […]
-
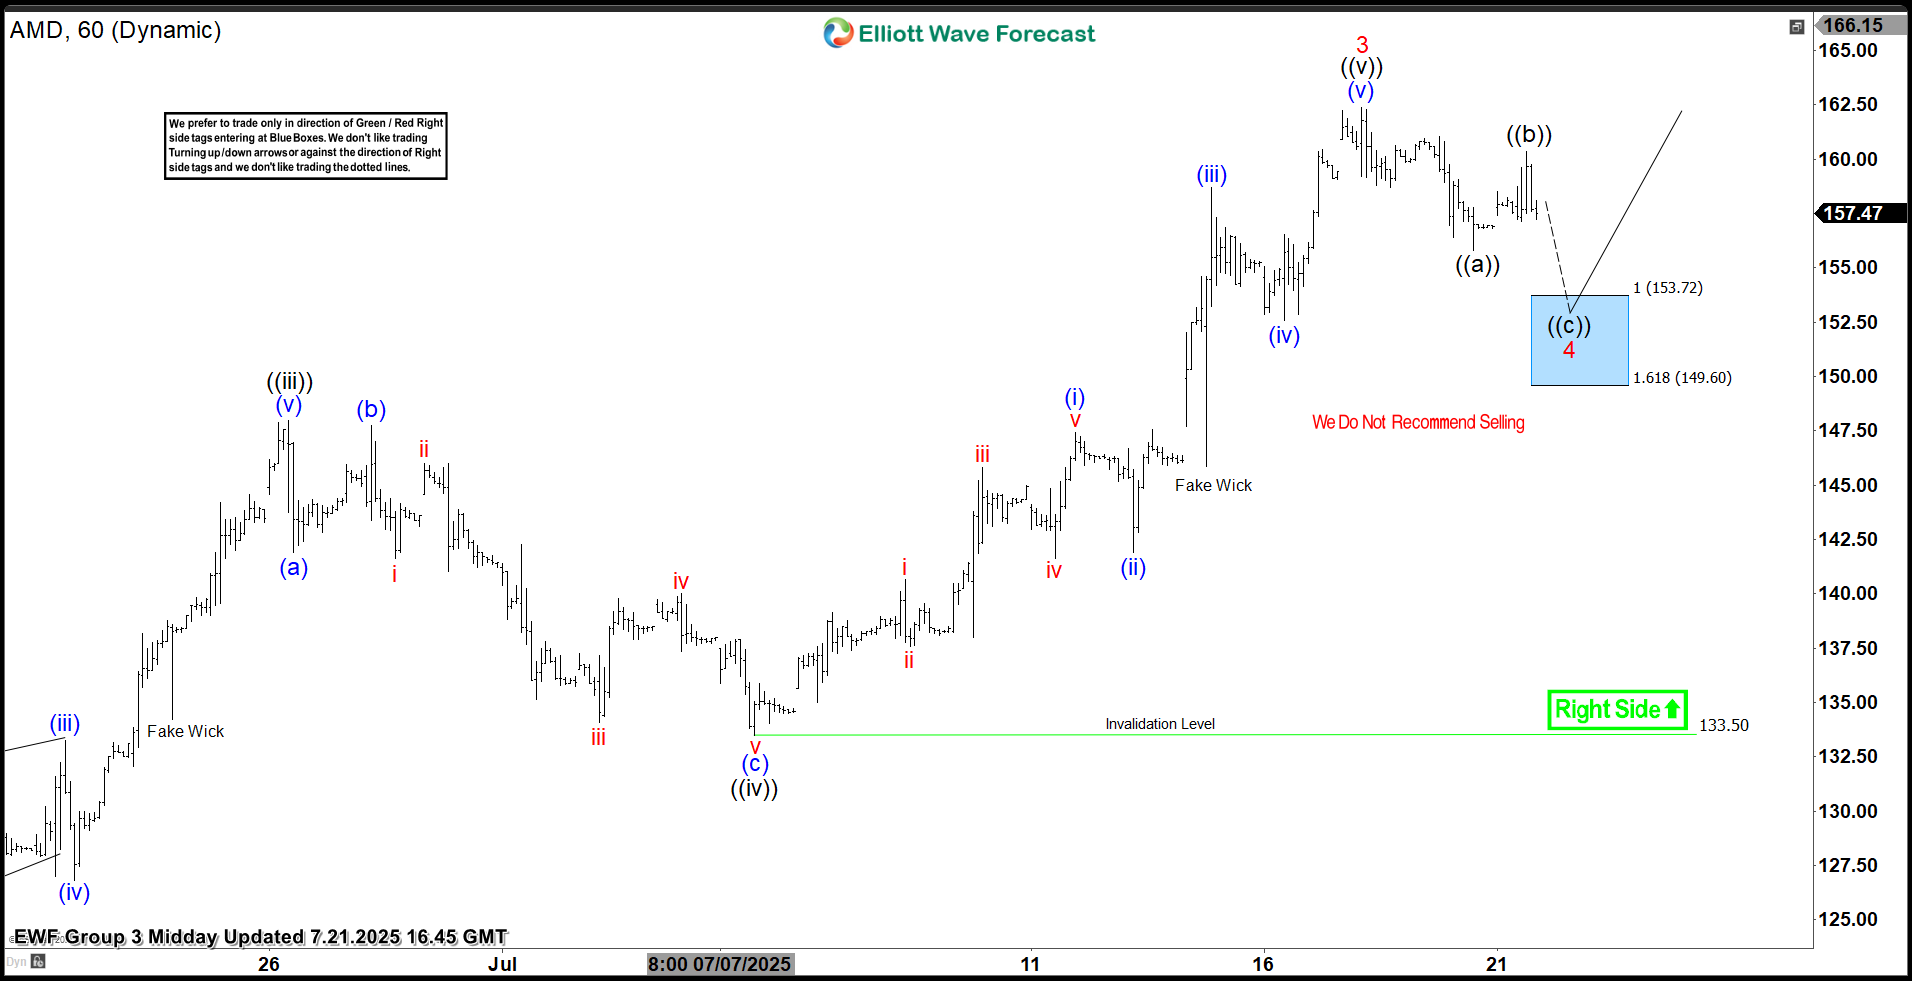
Advanced Micro Devices ( AMD) Stock Rallies from the Blue Box Area
Read MoreHello fellow traders. In this technical article, we are going to present Elliott Wave trading setup of AMD. The stock completed its corrective decline precisely at the Equal Legs area, also known as the Blue Box. In the following sections, we’ll break down the Elliott Wave structure in detail and explain the setup and trade management. […]