
-
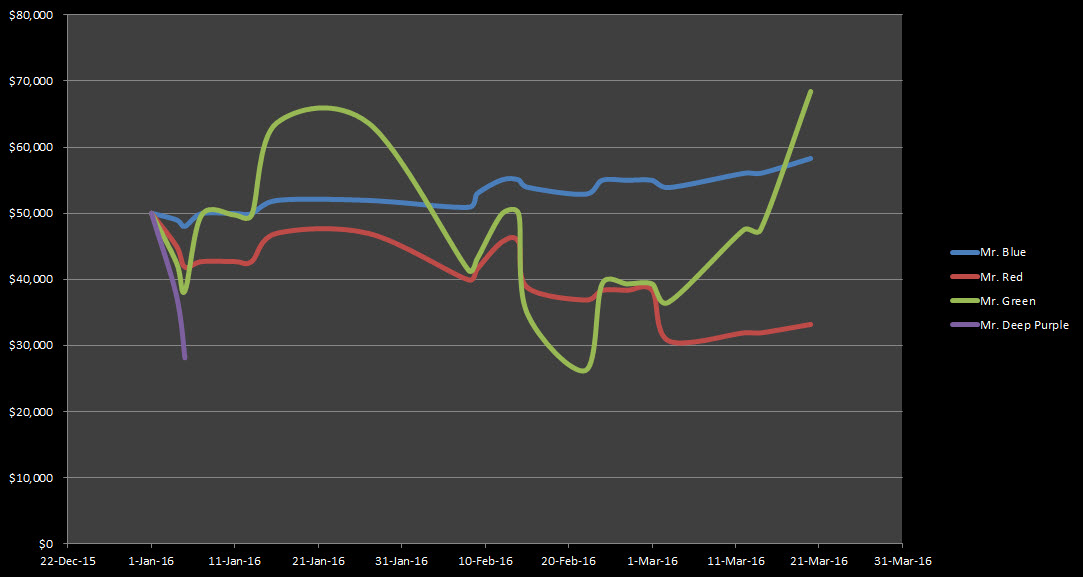
What happens when you don’t follow the 2% rule
Read MoreAs we have mentioned, every trader besides ability to forecast the market well, should also have good psychology and good money management in order to be successful. One of the most important things is to know how to manage the risks well and keep them as low as possible. As the rule says, you shouldn’t […]
-
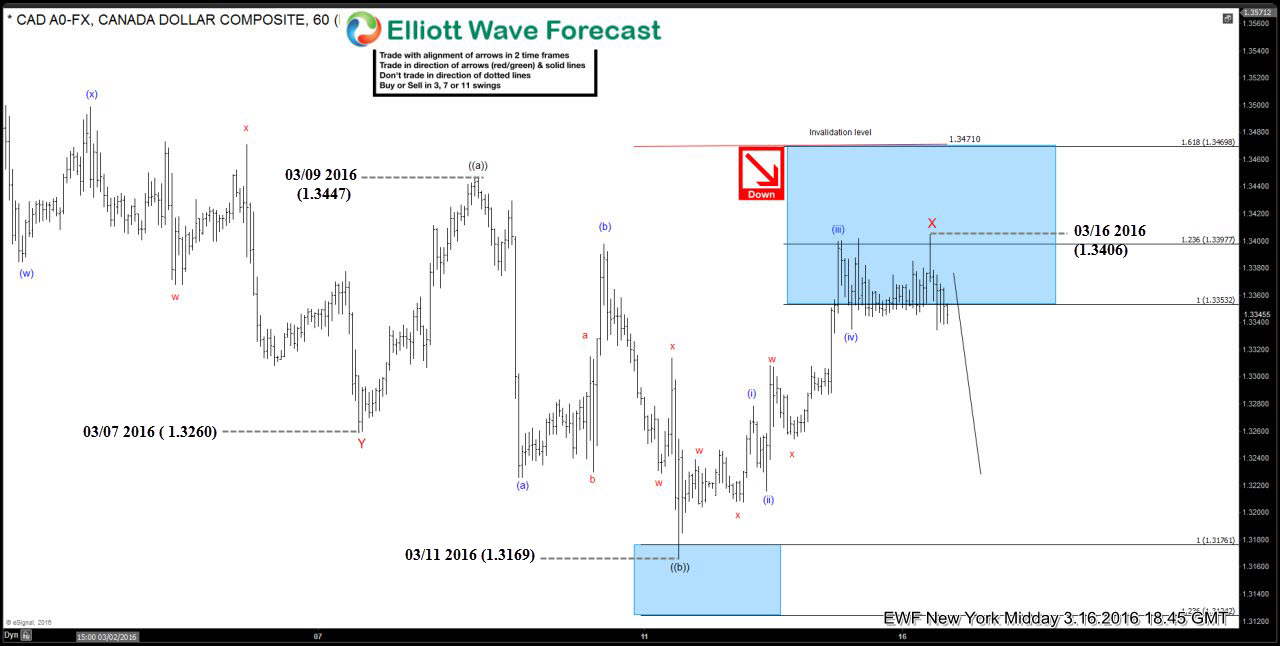
Elliott Wave Quiz: Could you recognize the structure ?
Read MoreLately we were doing a lot of educational blogs, explaining various Elliott Wave Patterns through real Market examples. Now we invite you to take this short Quiz in order to test your Elliott Wave knowledge. $USDCAD chart below shows our forecast from 16. March 2016 .It’s calling x red connector completed at 1.3347 and suggesting further […]
-
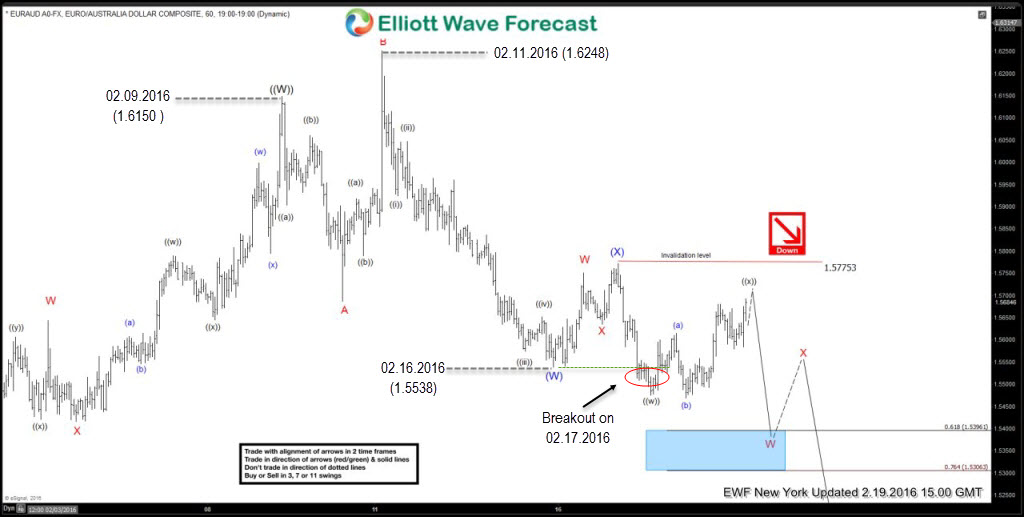
$EURAUD Elliott Waves Forecasting the decline
Read MoreIn this technical blog we’re going to take a quick look at $EURAUD price structure we had on 2.19.2016 to explain Ellott Wave Forecast we had back then. 1 Hour chart below presents New York Update from Februar 19. 2016 date. It suggests the cycle from the 02.09. date ( 1.6150 high) ended at 1.5538 […]
-
$AUDUSD Expanded Flat Pattern
Read MoreThe $AUDUSD chart below shows forecast from February 19 2016. It suggests the cycle from the 0.69693 short term low has not done to the upside yet, calling for further extension above the previous W high : 0.7242. The pair ended first leg wave ((w)) of Y red at 0.7171 and now it’s showing very […]
-
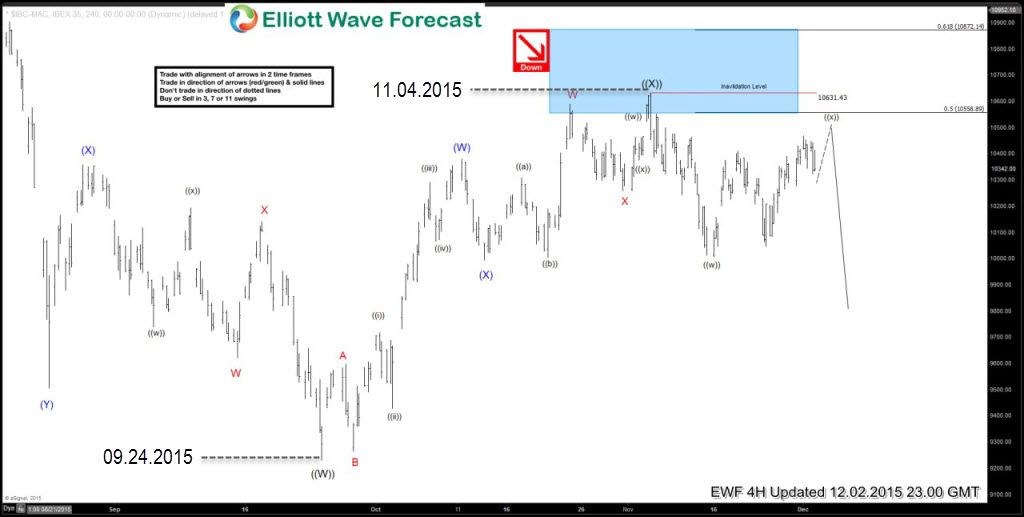
$IBEX: A look at the decline in December-January
Read MoreThe chart below from 2 December 2015 shows the move up from 24 September 2015 low. It shows price reached and slightly exceeded the 50 % Fibonacci retracement (10588.89) level of the previous ruling cycle before getting rejected and turning lower. Initial decline was in 3 waves but broke the rising trend line (not shown on the […]
-

$Nikkei $NKD_F Expanded FLAT Selling Opportunity
Read MoreNikkei 240 minute chart below shows the move up from September 29 2015 ( 16995 low) was a choppy and overlapping structure which showed a lot of contraction as well (see converging trend line connecting price highs and lows). We could also count 11 swings from the low to the high with momentum (RSI) divergence […]