
-
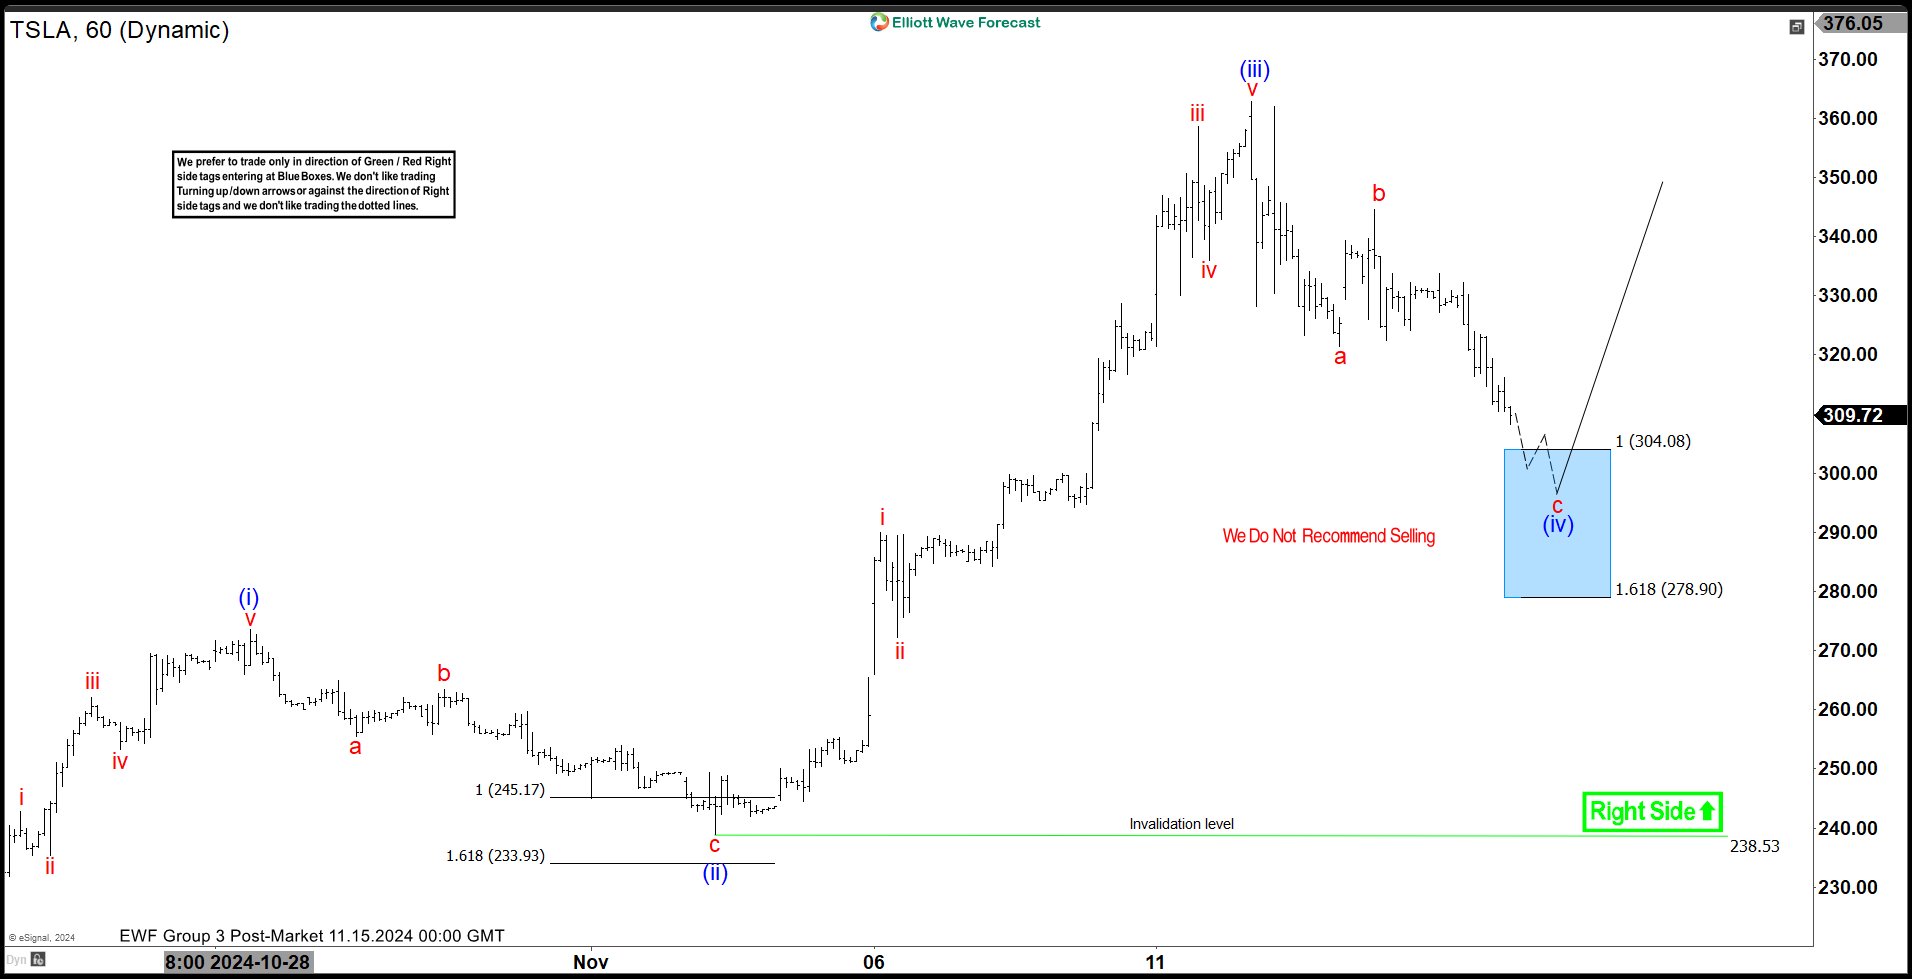
Tesla Inc. ( $TSLA) Elliott Wave Analysis: The Rally and What’s Next
Read MoreHello everyone! In today’s article, we’ll examine the recent performance of Tesla Inc. ($TSLA) through the lens of Elliott Wave Theory. We’ll review how the rally from the November 4, 2024, low unfolded as a 5-wave impulse and discuss our forecast for the next move. Let’s dive into the structure and expectations for this stock. 5 Wave Impulse Structure […]
-
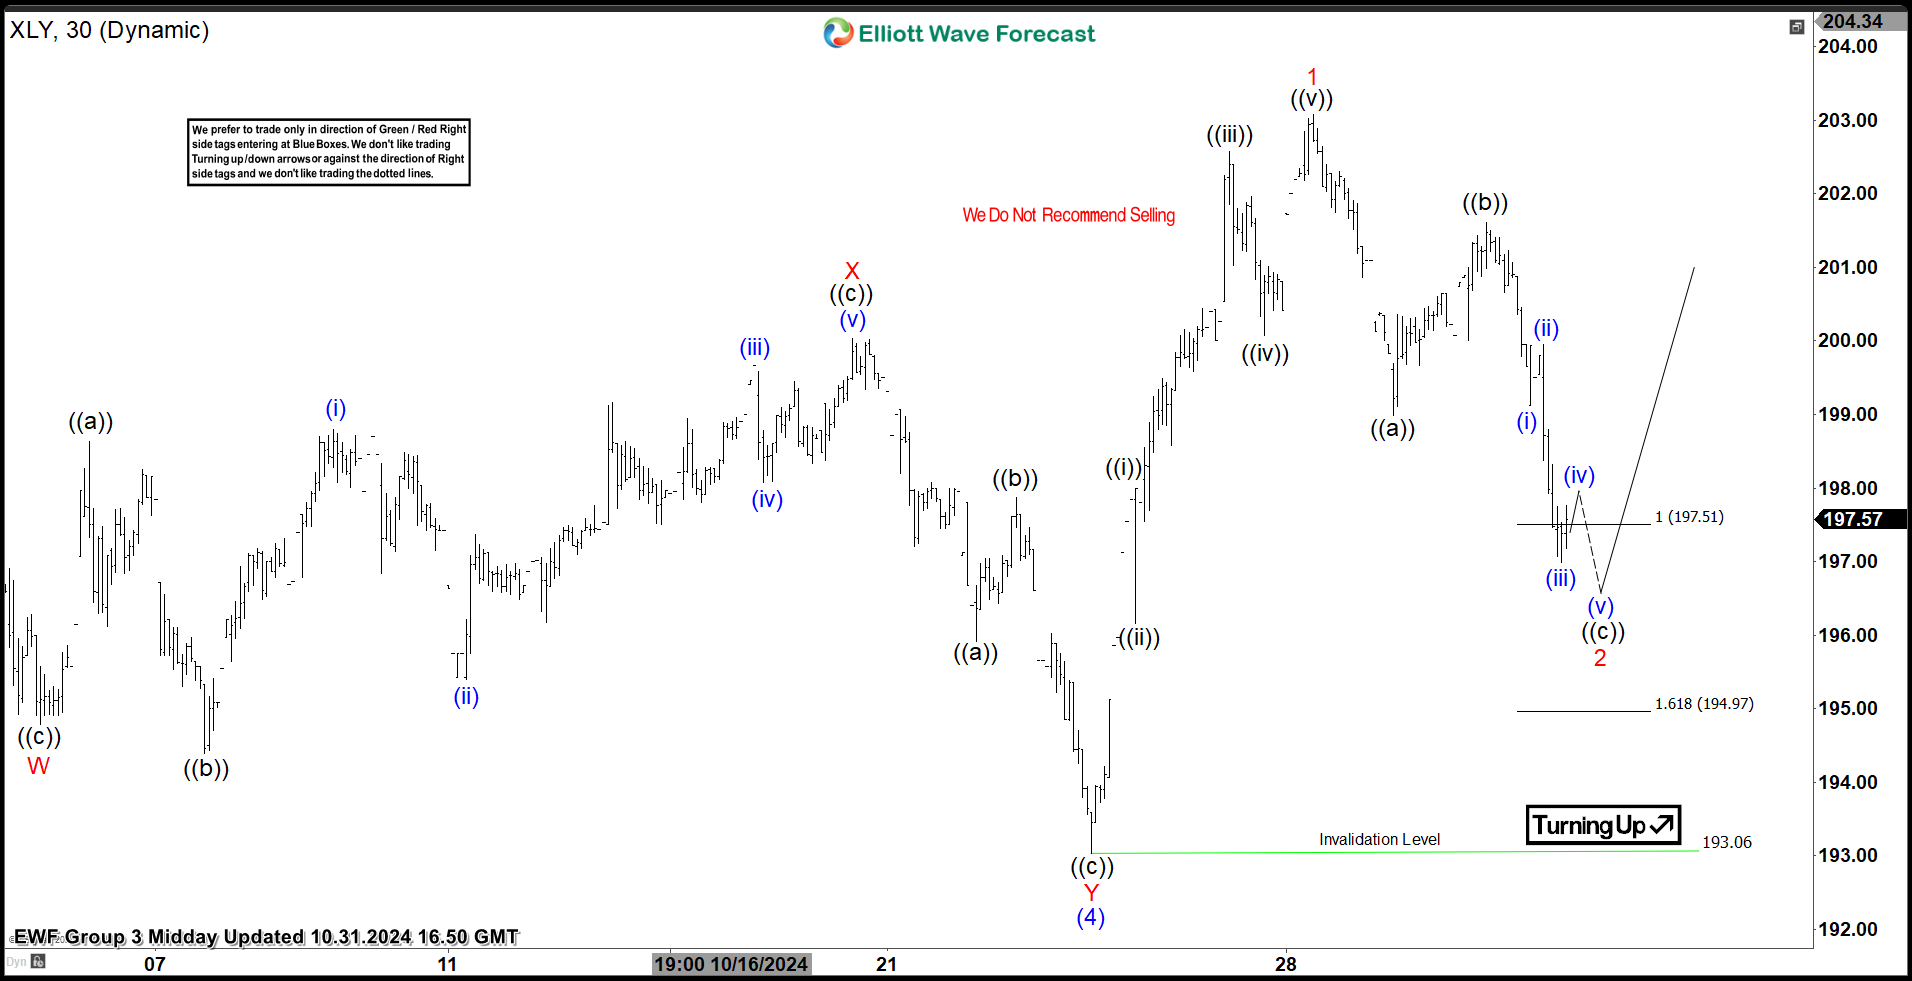
SPDR Consumer Discretionary ETF ( $XLY ) Elliott Wave Analysis: The Rally and What’s Next
Read MoreHello everyone! In today’s article, we’ll examine the recent performance of the SPDR Consumer Discretionary ETF ($XLY) through the lens of Elliott Wave Theory. We’ll review how the rally from the October 23, 2024, low unfolded as a 5-wave impulse and discuss our forecast for the next move. Let’s dive into the structure and expectations […]
-
Novo Nordisk A/S $NVO: Prepare for a Potential Rally as Elliott Wave Signals a Bullish Move.
Read MoreHello Traders! Today, we will look at the Weekly Elliott Wave structure of Novo Nordisk A/S ($NVO) and explain why the stock should soon react higher from a Blue Box area. Novo Nordisk A/S is a Danish multinational pharmaceutical company headquartered in Bagsværd with production facilities in nine countries and affiliates or offices in five countries. Novo Nordisk manufactures and markets pharmaceutical products and services, […]
-
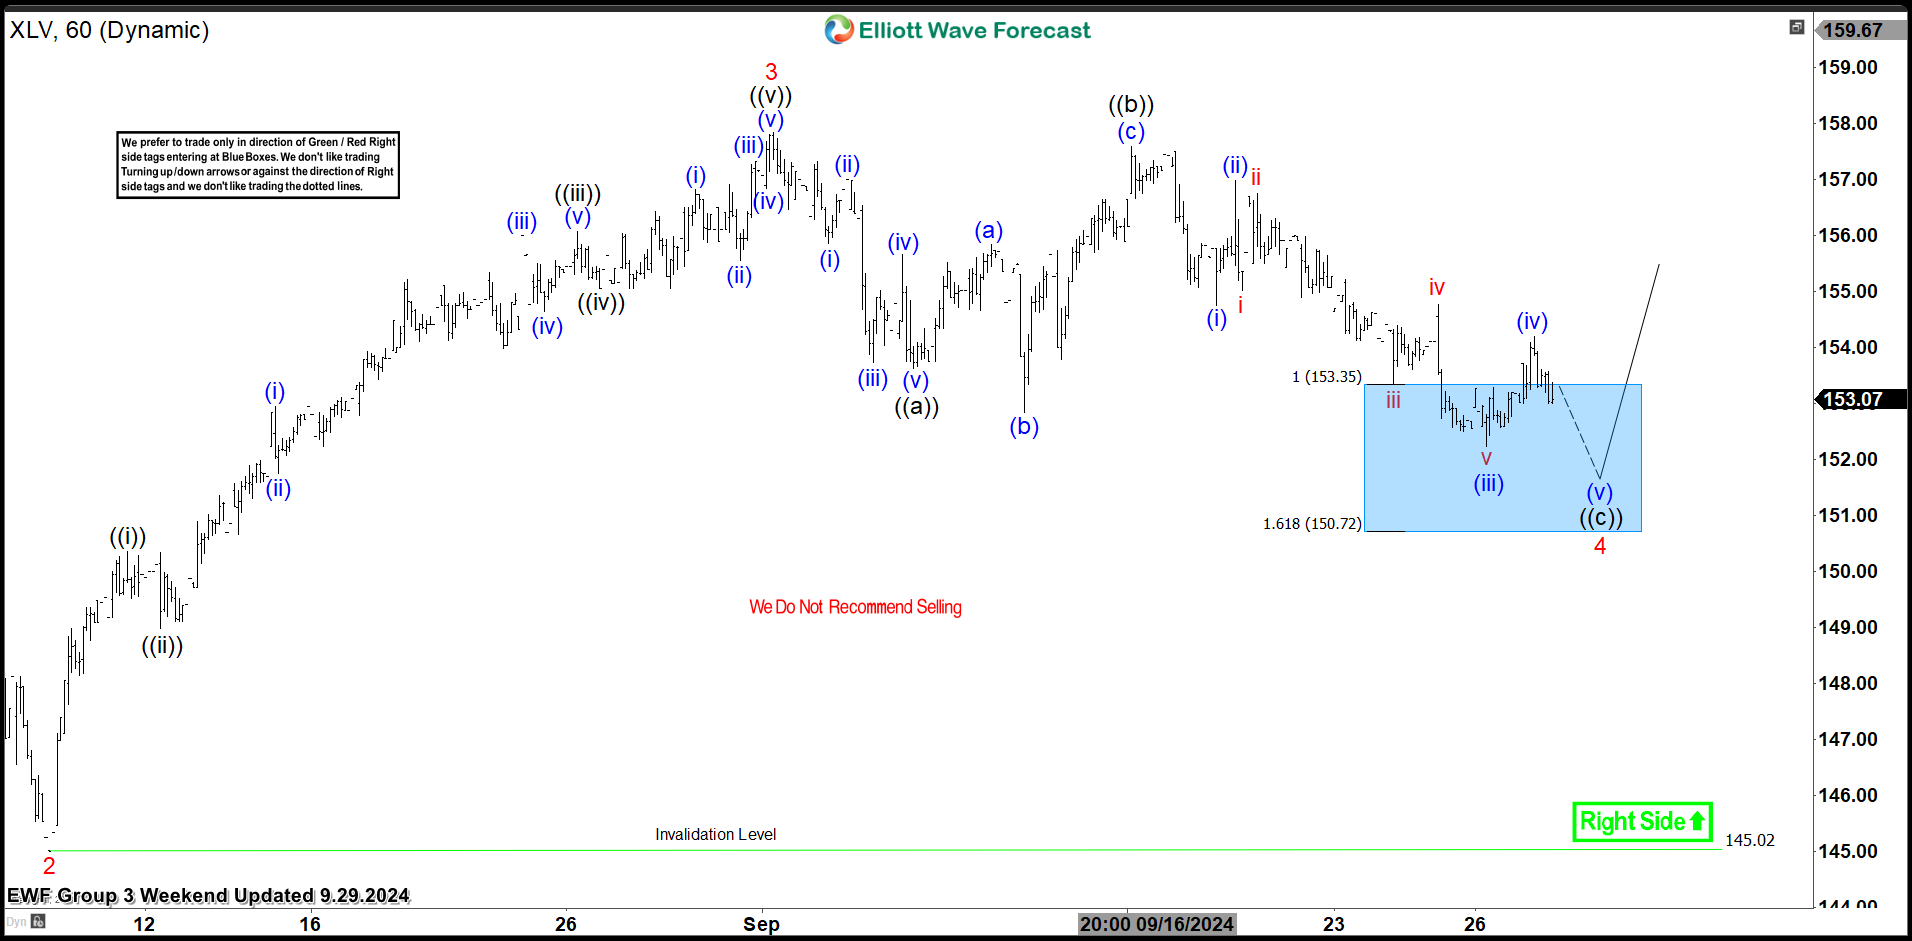
SPDR Health Care ETF $XLV Found Buyers At The Blue Box Area.
Read MoreHello everyone. In today’s article, we will look at the past performance of the 1H Hour Elliott Wave chart of SPDR Health Care ETF ($XLV). The rally from 8.07.2024 low unfolded as 5 waves impulse. So, we expected the pullback to unfold in 3 swings and find buyers again. We will explain the structure & […]
-
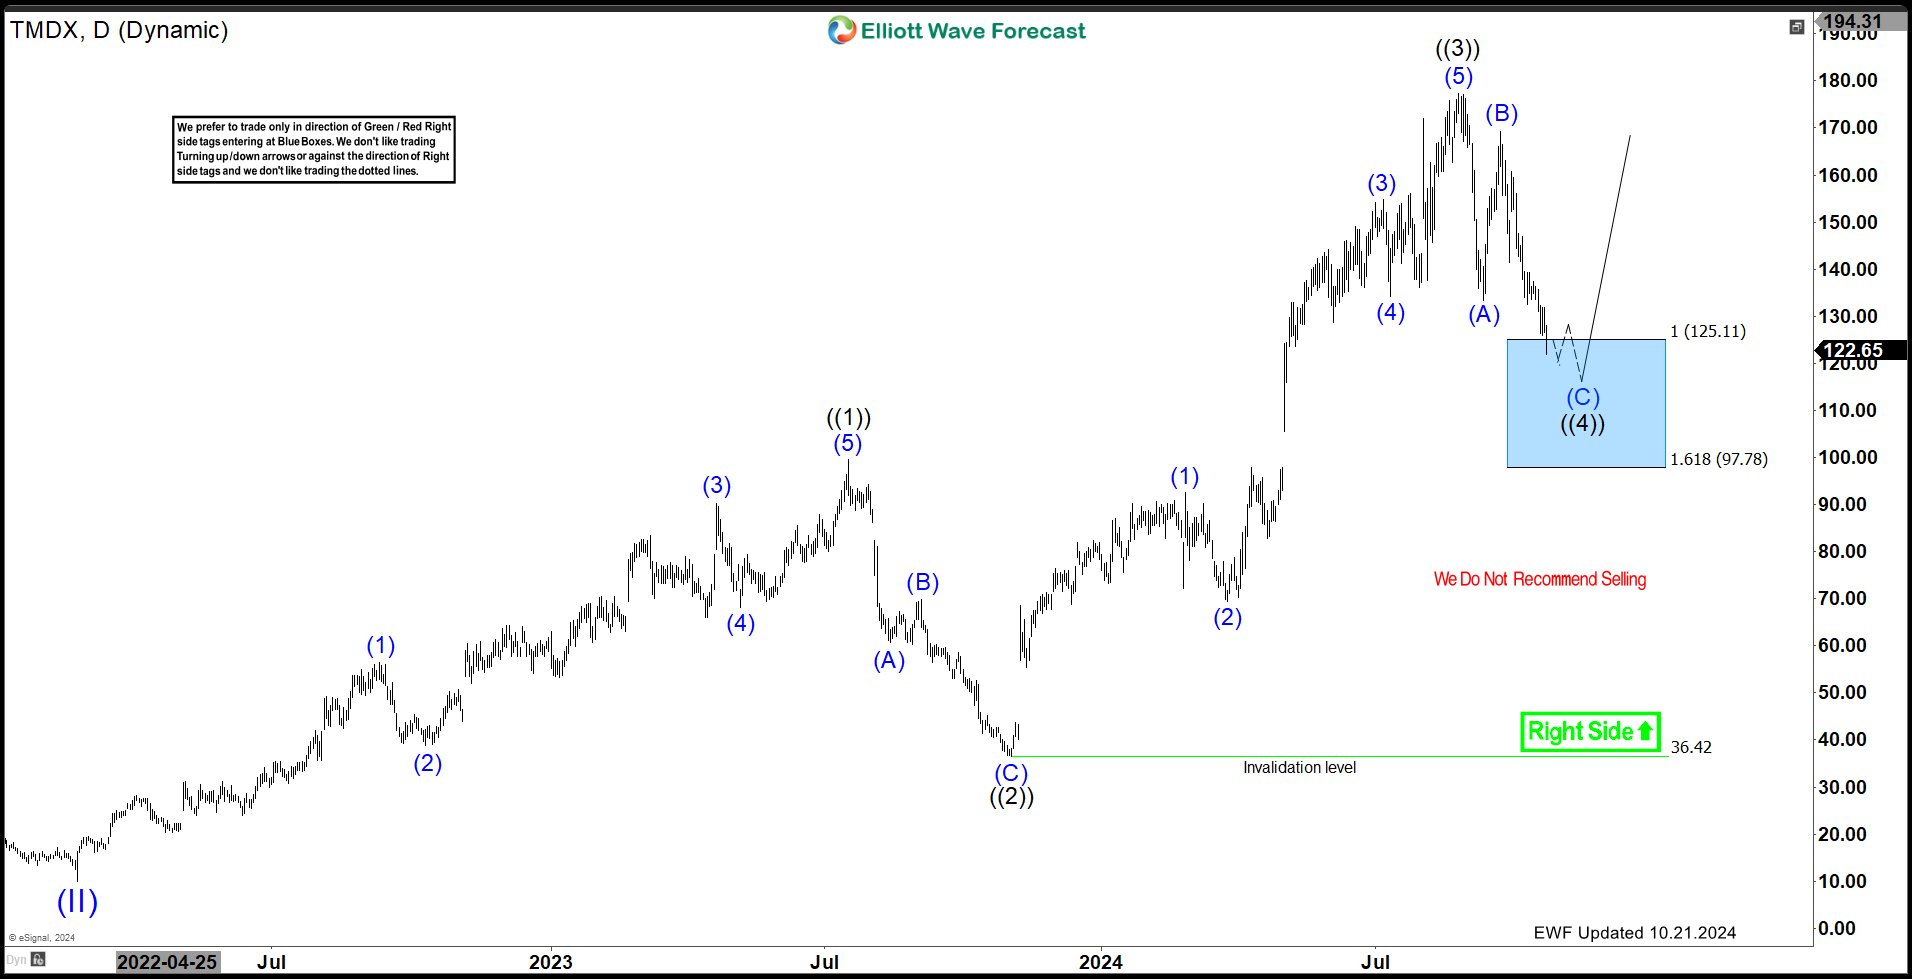
TransMedics Group (TMDX): Prepare for a Potential Rally as Elliott Wave Signals a Bullish Move
Read MoreHello Traders! Today, we will look at the Daily Elliott Wave structure of TransMedics Group Inc. (TMDX) and explain why the stock should soon reach a Blue Box area and react higher. TransMedics Group, Inc., a commercial-stage medical technology company, engages in transforming organ transplant therapy for end-stage organ failure patients in the United States […]
-
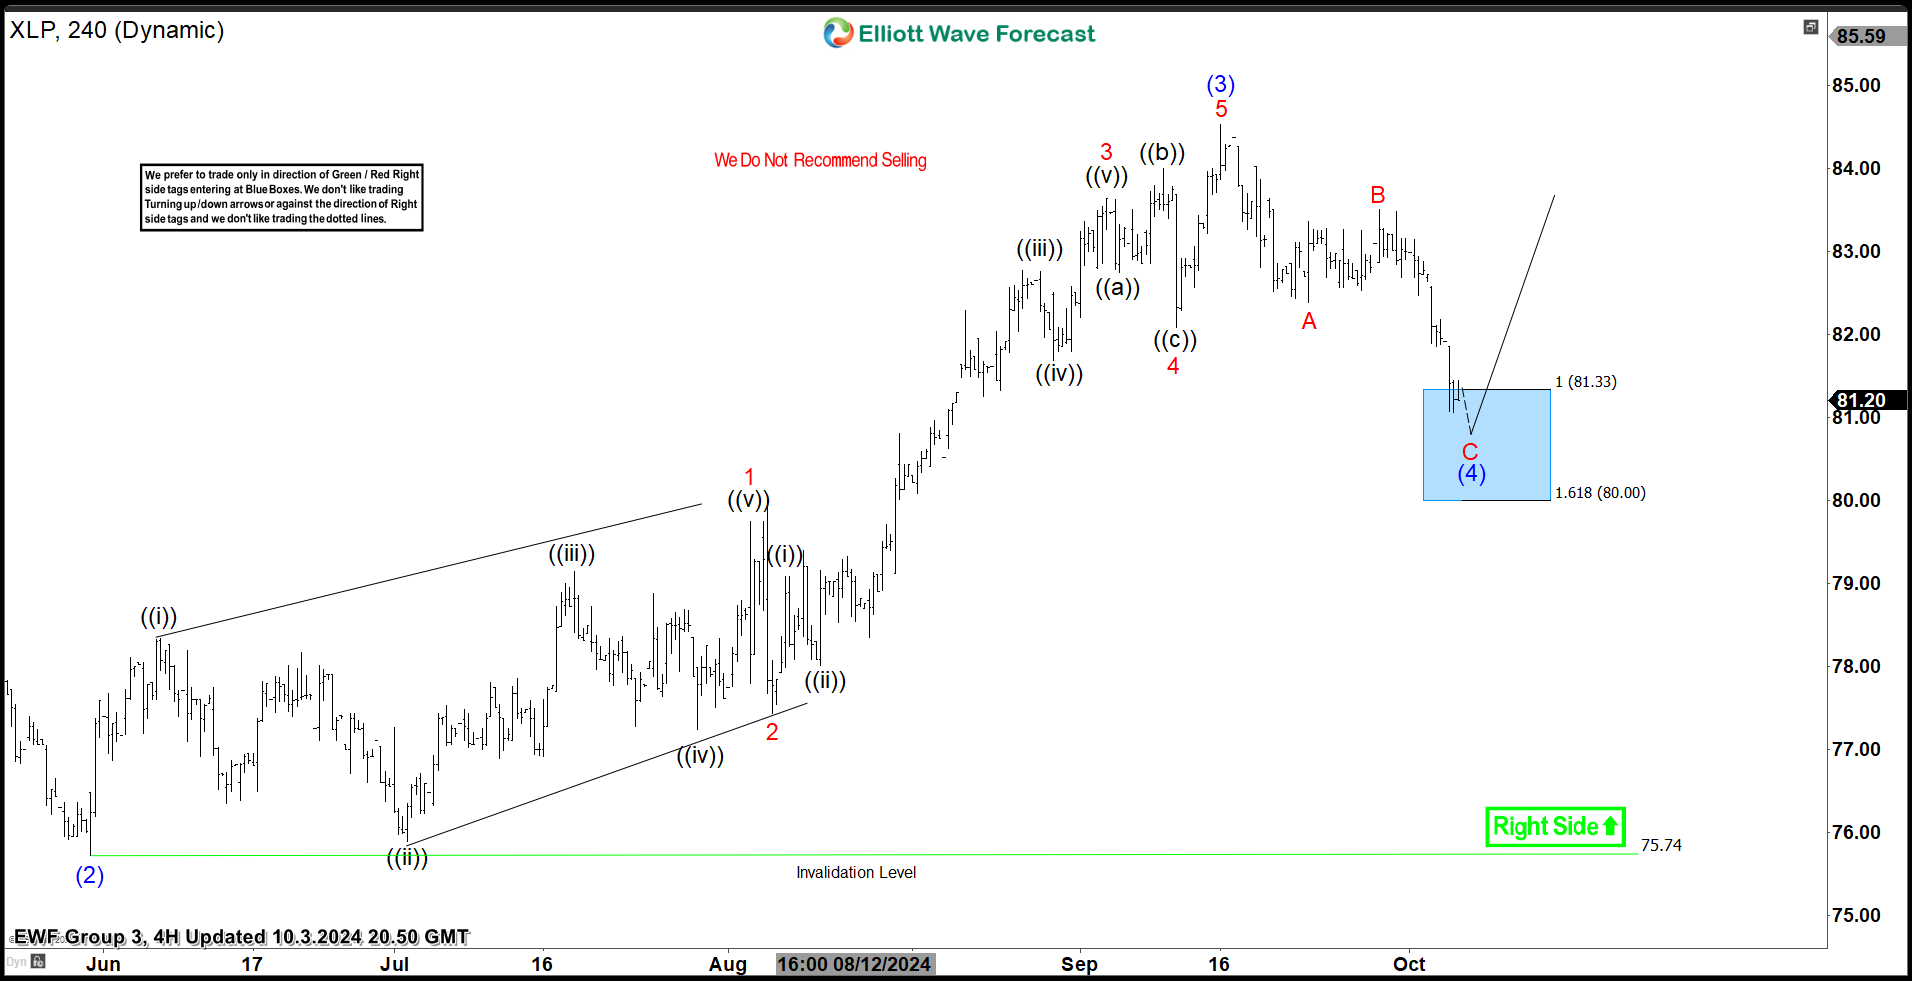
SPDR Consumer Staples ETF ( $XLP ) Found Buyers At The Blue Box Area.
Read MoreHello everyone. In today’s article, we will look at the past performance of the 4H Hour Elliott Wave chart of SPDR Consumer Staples ETF ($XLP). The rally from 5.31.2024 low unfolded as 5 waves impulse. So, we expected the pullback to unfold in 3 swings and find buyers again. We will explain the structure & […]