
-

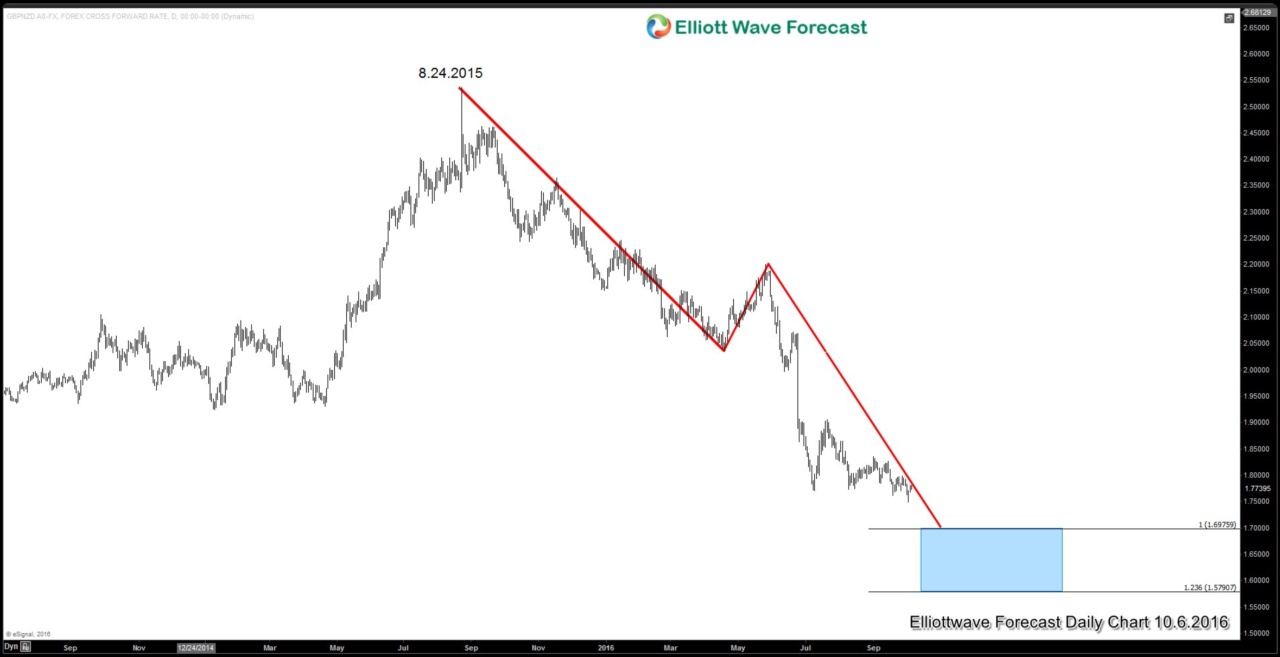
GBPNZD Setup from Live Trading Room Oct 4
Read MoreThe Elliott wave trading setup below comes from Oct 4 Live Trading Room session. We sold GBPNZD at 1.773 and made 500 pips profit. We also sold GBPAUD at 1.683 for a 200 pips profit. Journal Video Find more information about Live Trading Room by watching the video below or click –> Live Trading Room Take our […]
-
Fear of Hard Brexit and Poundsterling
Read MoreSince the Brexit vote in June, Poundsterling has fallen 13% against the U.S. dollar and it is now worth 22% less than a year ago. Today the pound worths around $1.27 while a year ago it was worth $1.55. The currency was further under pressure this week after the U.K Prime Minister Theresa May provided more […]
-
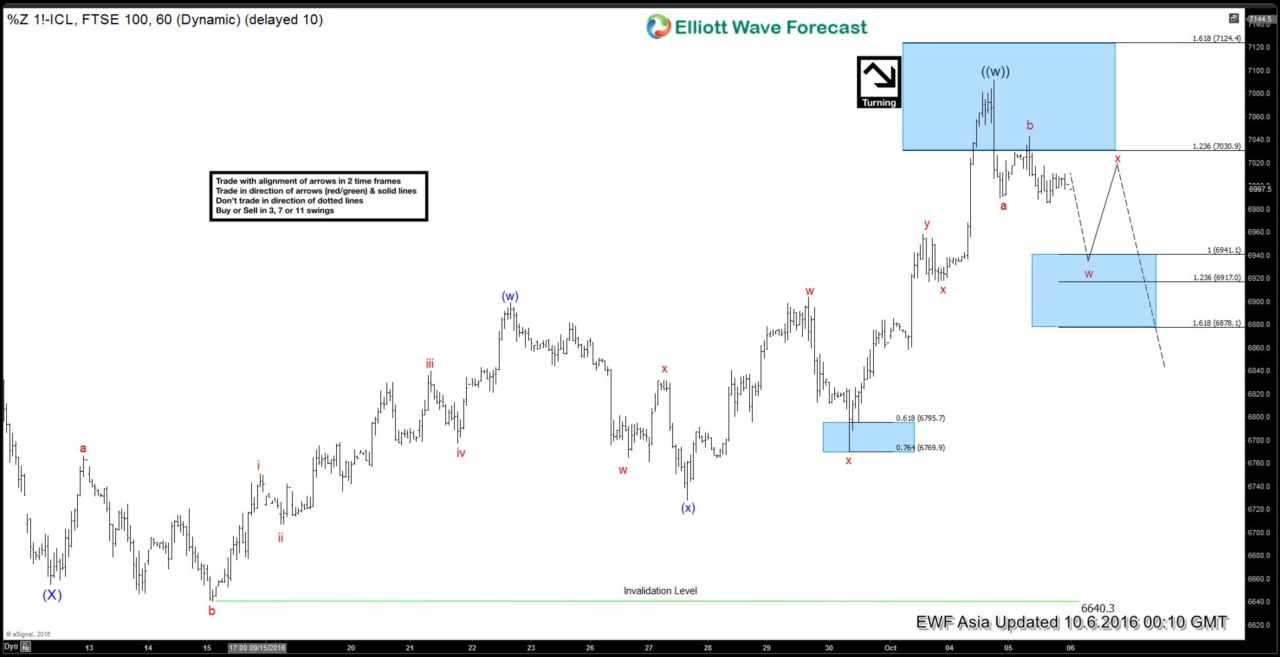
$FTSE Short-term Elliott Wave Analysis 10.6.2016
Read MoreShort term Elliott wave count suggests that pullback to 6640.3 at 9/15 ended wave (X). The rally from there is unfolding as a double three where wave (w) ended at 6899.5, wave (x) ended at 6728.5, and wave (y) of ((w)) is proposed complete at 7091.5. Near term, while bounces stay below 7091.5, expect the Index to […]
-
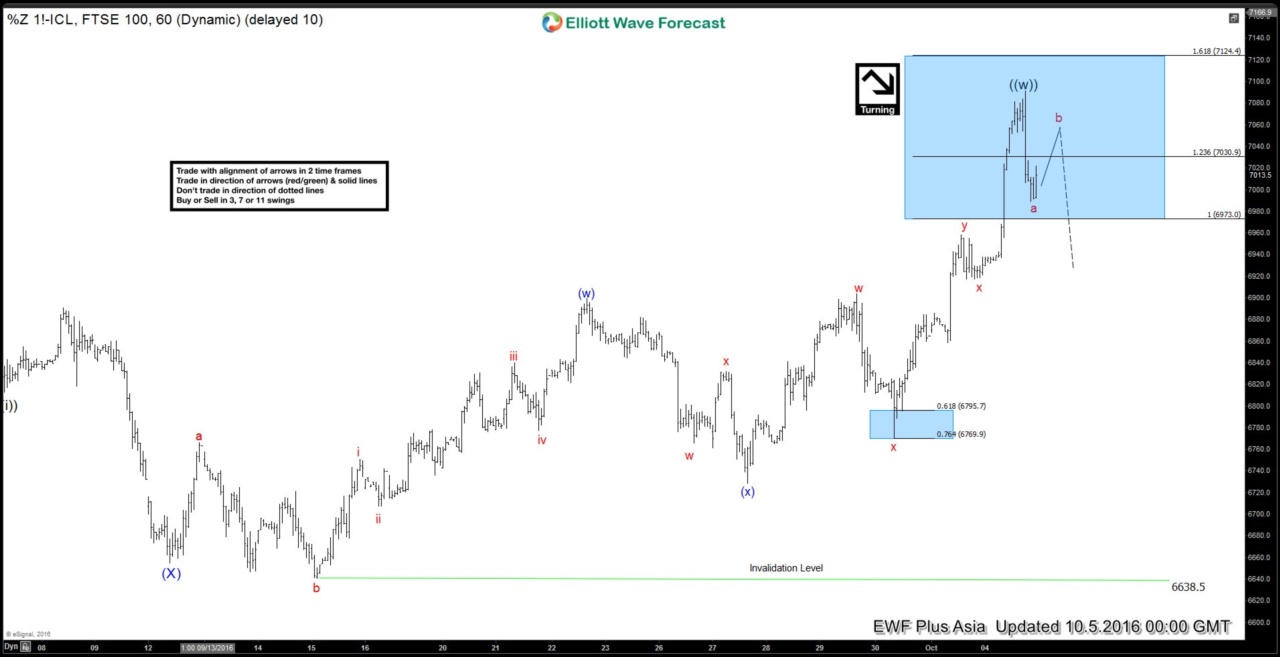
$FTSE Short-term Elliott Wave Analysis 10.5.2016
Read MoreShort term Elliott wave count suggests that pullback to 6640 at 9/15 ended wave (X). The rally from there is unfolding as a double three where wave (w) ended at 6899.5, wave (x) ended at 6728.5, and wave (y) of ((w)) is proposed complete at 7091.5. Near term, while bounces stay below 7091.5, expect wave ((x)) pullback in 3, […]
-
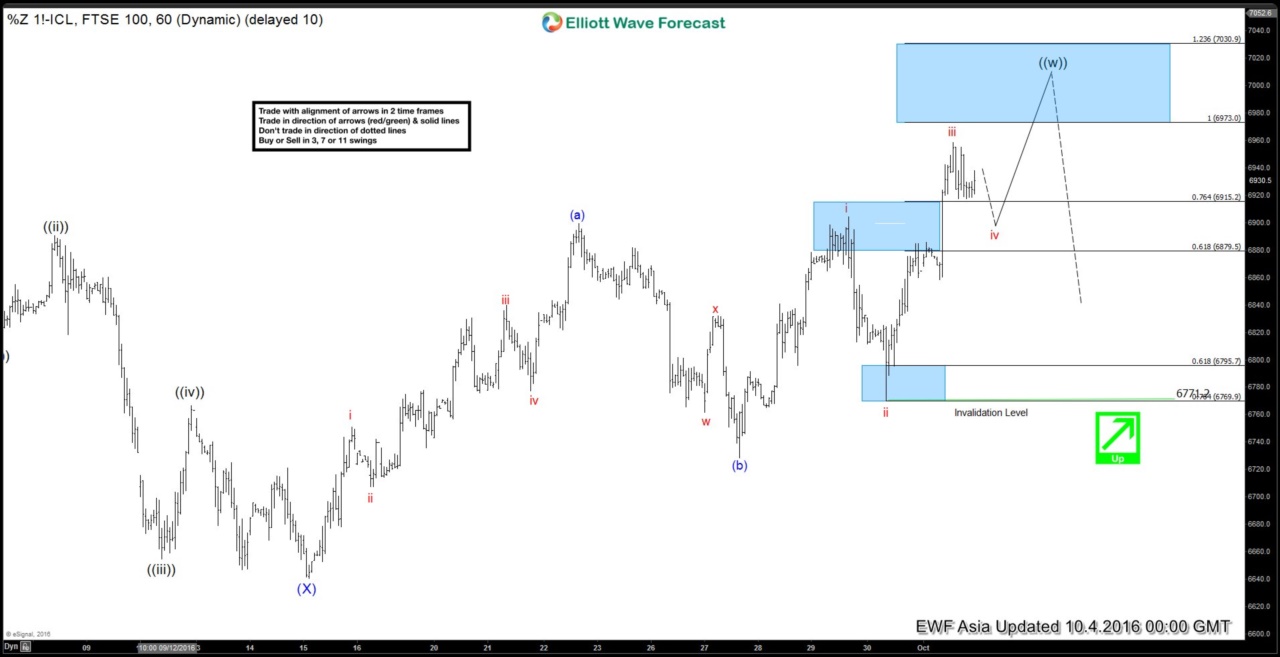
$FTSE Short-term Elliott Wave Analysis 10.4.2016
Read MoreShort term Elliott wave count suggests that pullback to 6640 at 9/15 ended wave (X). The rally from there is unfolding as a zigzag where wave (a) ended at 6899.5, wave (b) ended at 6728.5, and wave (c) is in progress as 5 waves. Wave iii of (c) is proposed complete at 6958.5 and a pullback in wave […]
-
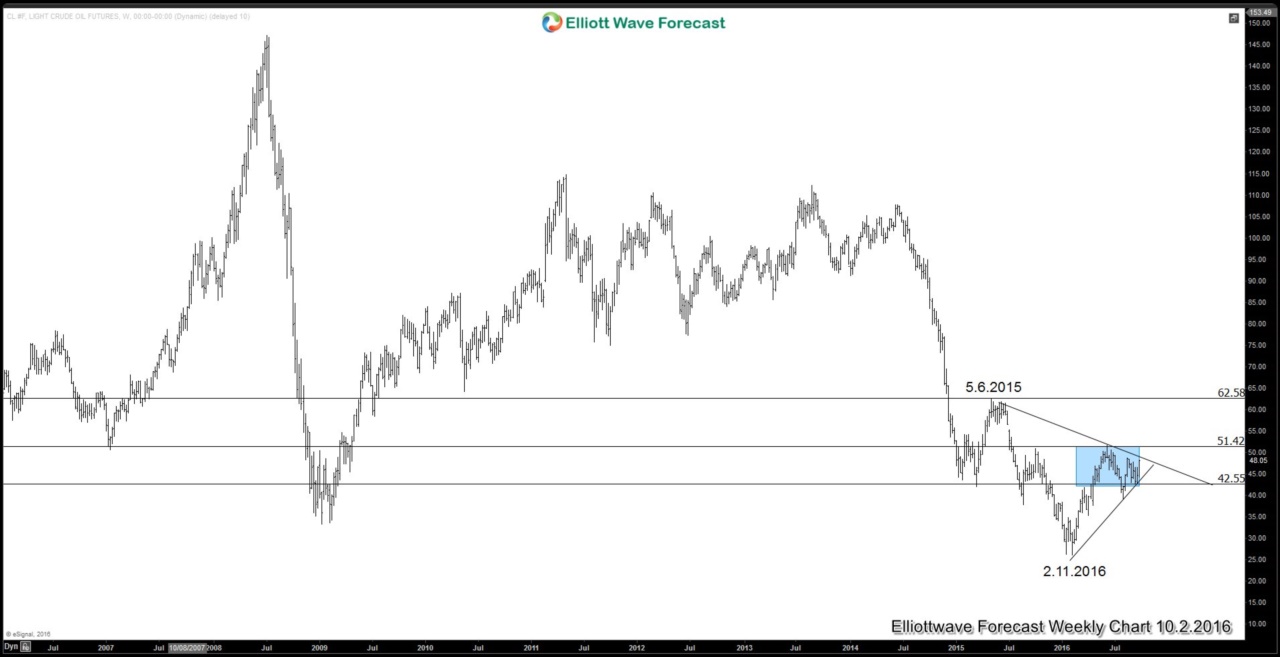
Will the new policy by OPEC reverse oil’s price trend?
Read MoreIn a significant shift of Arab Saudi’s oil policy since 2008, on Wednesday Sept 24, the kingdom has reached an understanding together with other members of the oil cartel to cut oil’s output to reduce the world’s supply glut. This is in contrast to Arab Saudi’s persistent policy to flood the oil market in the last few years to wage […]