
-
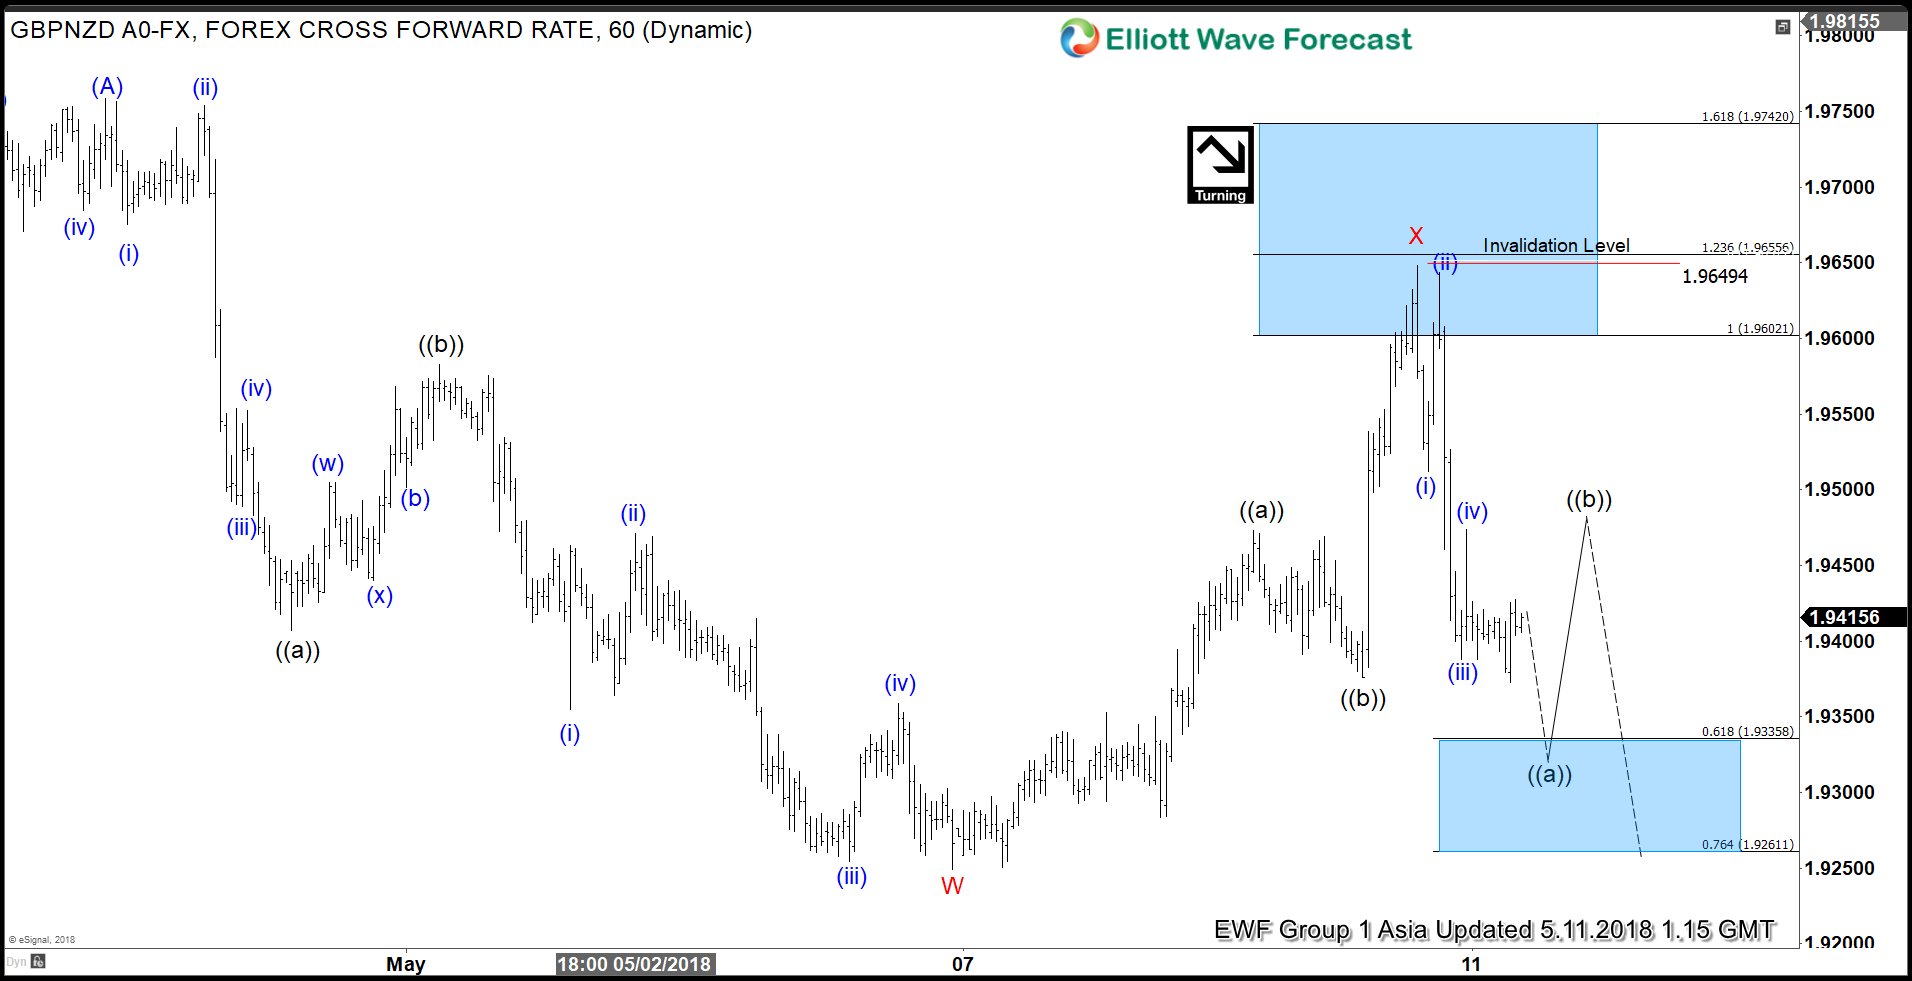
GBPNZD Elliott Wave View: Ending an Impulse Move
Read MoreGBPNZD short-term Elliott wave view suggests that the rally to 1.9758 on 4/26 high ended Intermediate wave (A). Down from there, Intermediate wave (B) remains in progress as a double three Elliott Wave structure. The internals of each leg in double three (WXY) sub-divides into 3 waves corrective sequence and usually is the combination of two […]
-
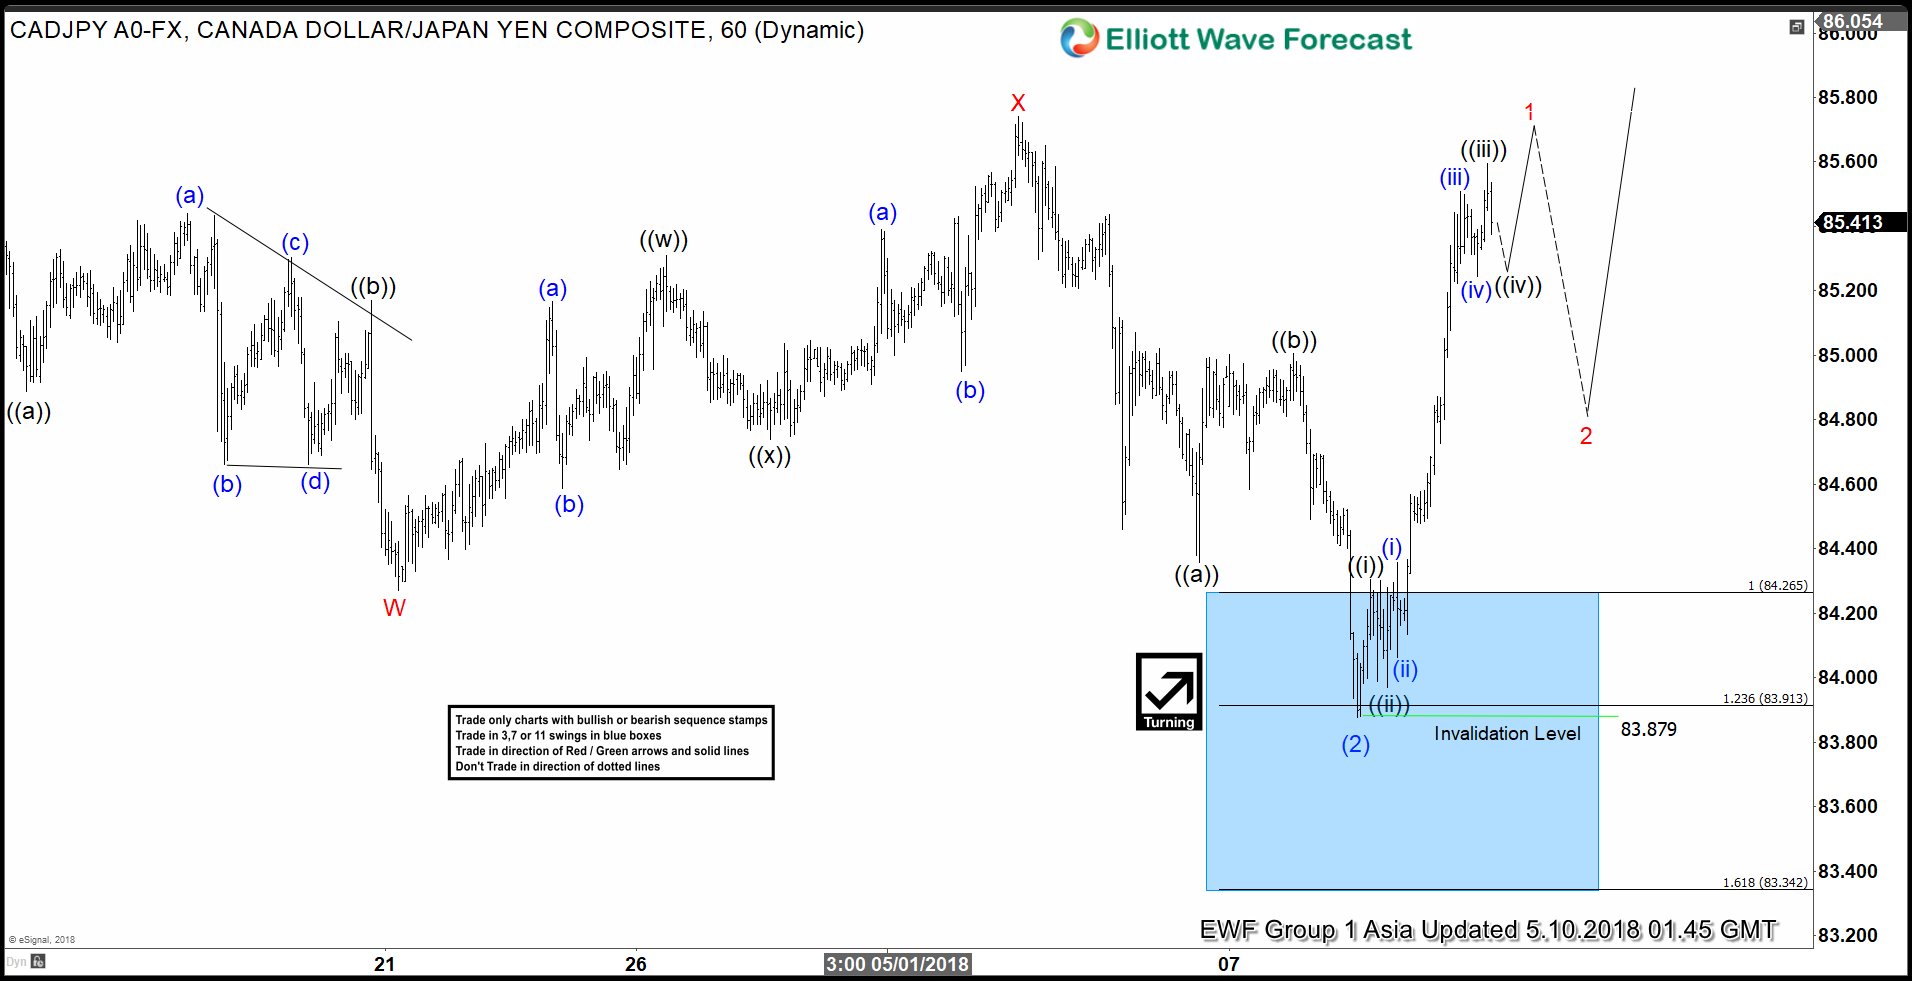
CADJPY Elliott Wave View: Calling Strength Higher
Read MoreCADJPY Short Term Elliott Wave view suggests that the decline from 4/13 peak at 85.76 to 83.87 low ended Intermediate wave (2) as a double three Elliott Wave structure. The internal subdivision of the decline from 85.76 high shows an overlapping structure. This suggests the decline is corrective in nature. We label the correctin as W-X-Y. […]
-
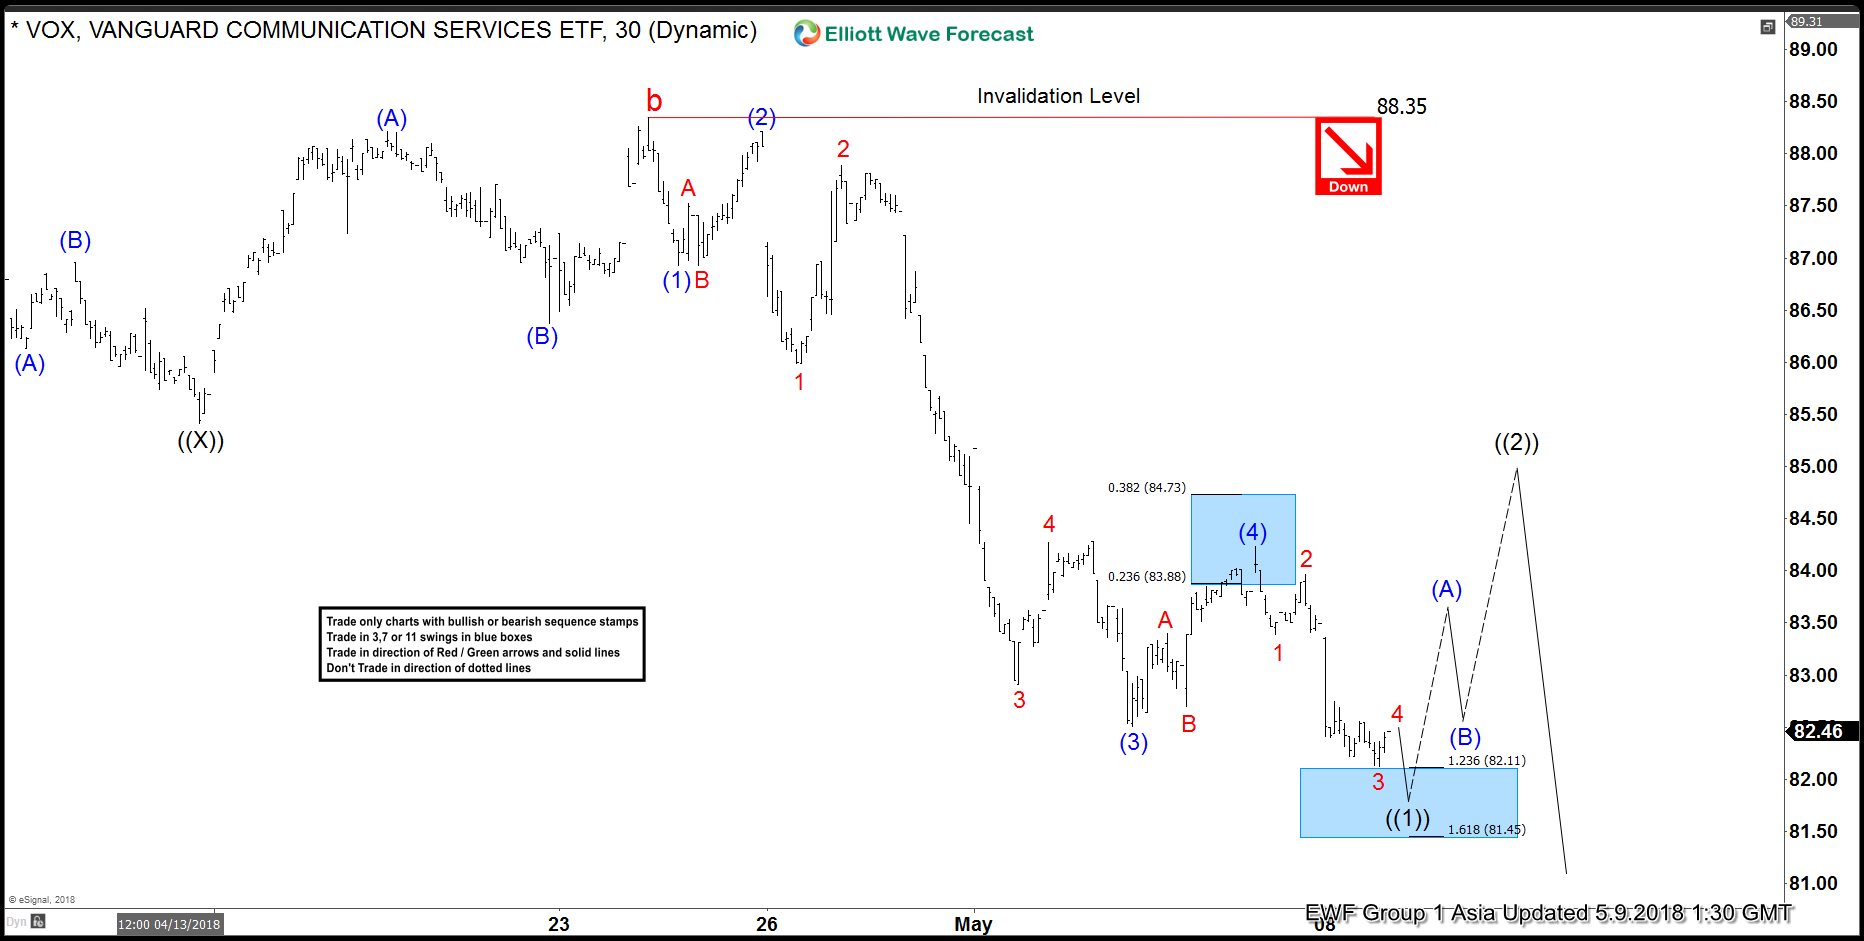
VOX Elliott Wave View: Calling For A Bounce Soon
Read MoreVanguard communication services ETF ticker symbol: VOX short-term Elliott Wave view suggests that the bounce to 88.35 on 4/24/2018 high ended cycle degree wave “b”. Below from there, the cycle degree wave “c” remain in progress as an Impulse Elliott Wave structure looking for more downside extensions. Down from 88.35 high, Primary wave ((1)) is in progress as […]
-
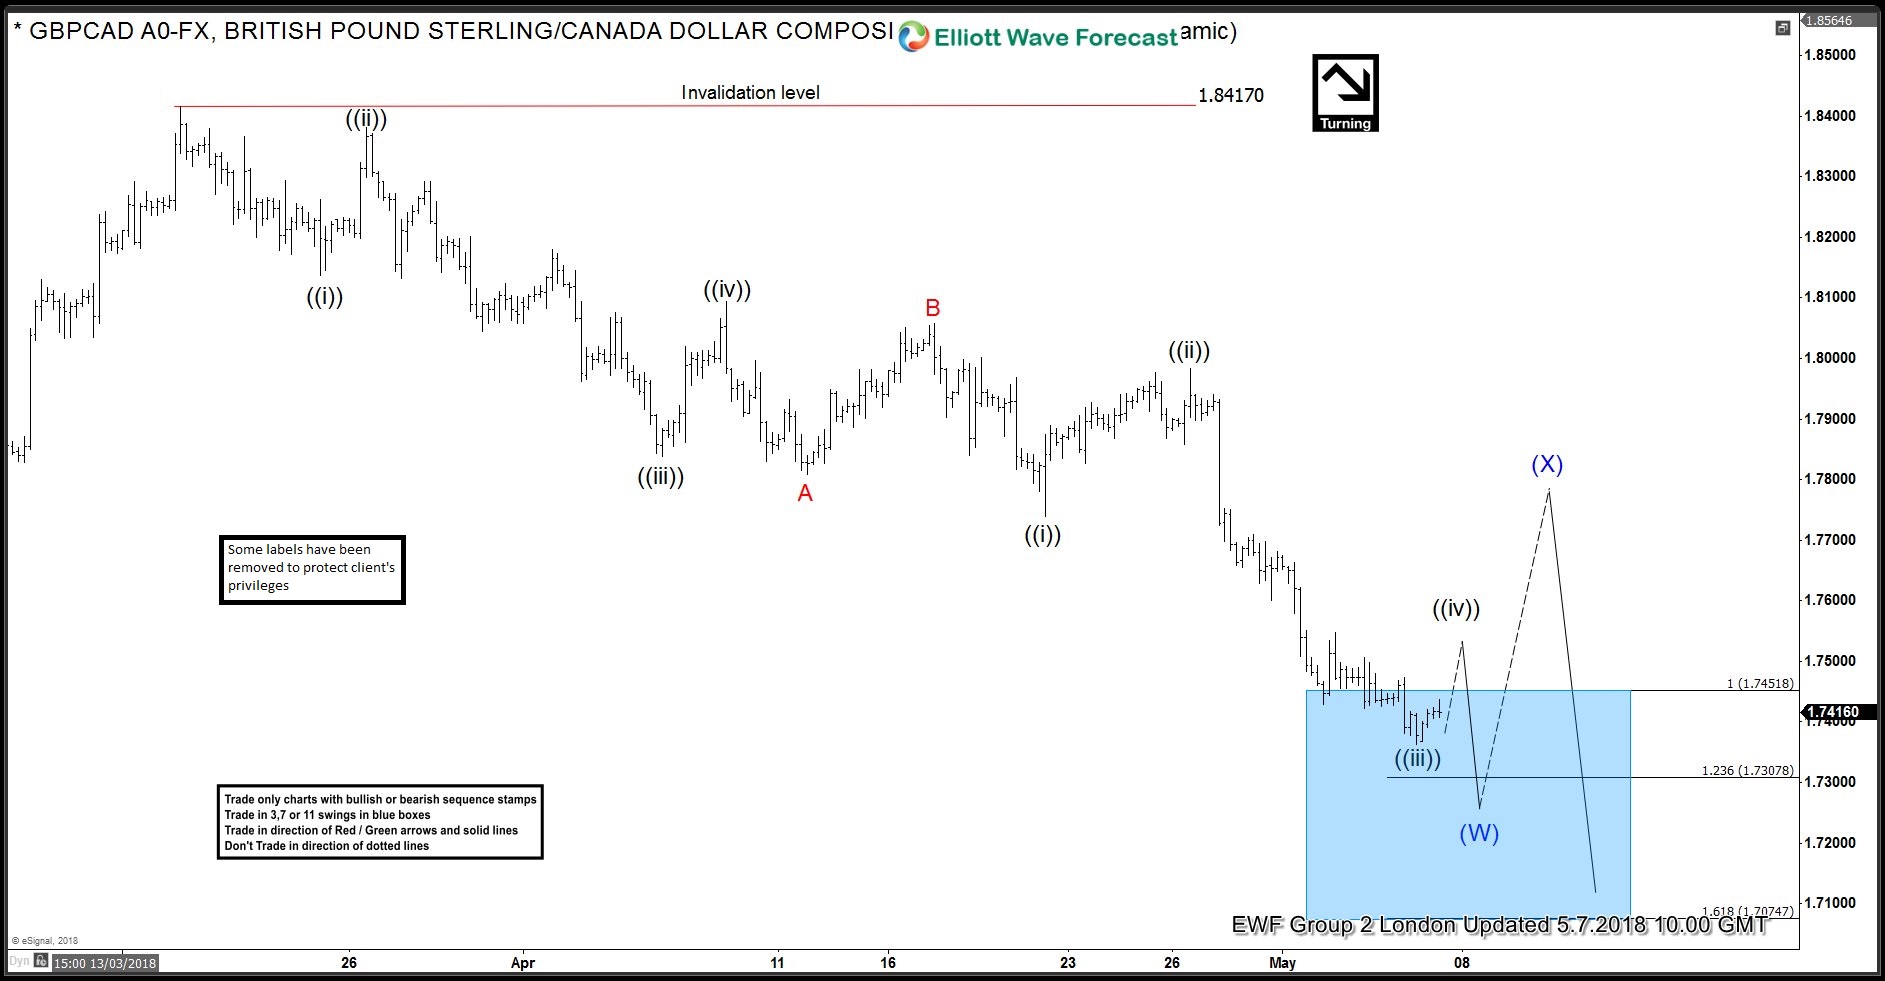
GBPCAD Elliott Wave View: Calling The Bounce Soon
Read MoreGBPCAD Elliott wave view in shorter cycles suggests that the decline from 3/19/2018 high 1.8417 is unfolding as a Zigzag structure in intermediate wave (W) lower. The internals of a zigzag structure unfolds with sub-division of 5-3-5 wave structure when wave A & C consists of 5 waves structure, which can be labeled as impulse […]
-
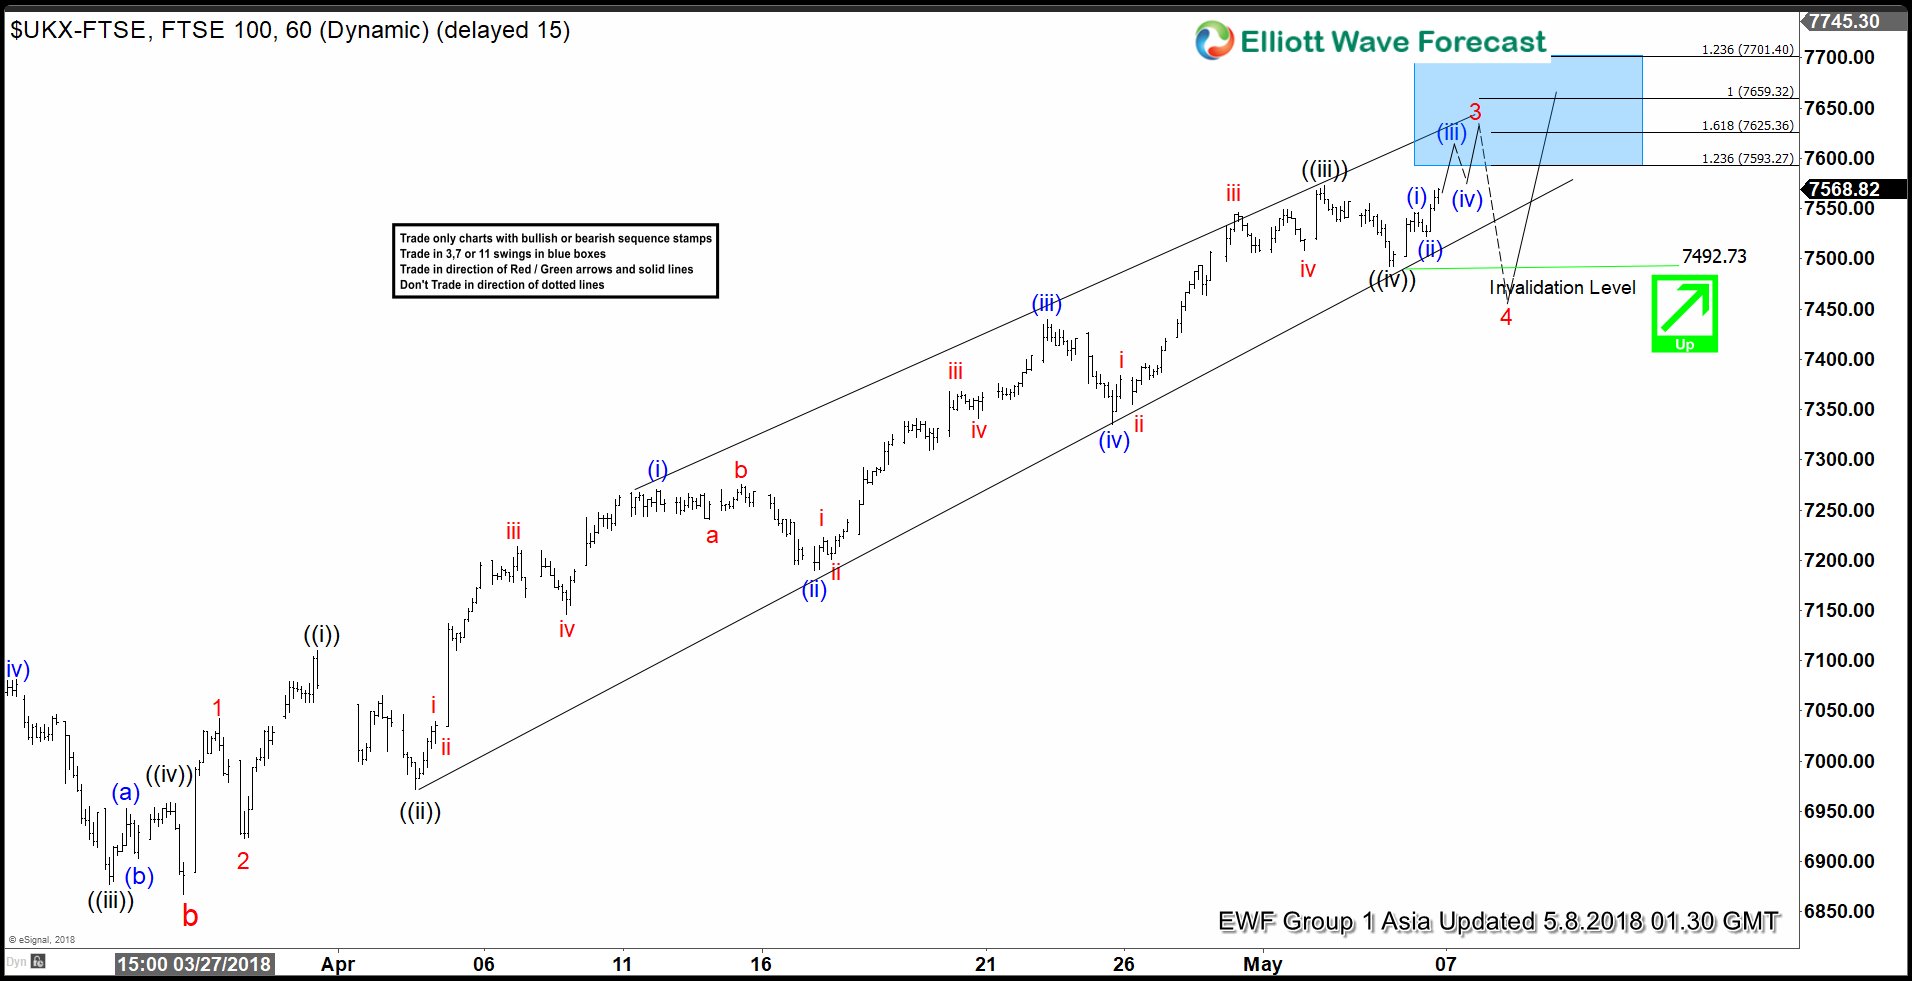
FTSE Showing Impulse Elliott Wave Structure
Read MoreFTSE short-term Elliott Wave view suggests that the decline to 3/26/2018 low 6866.94 ended the cycle degree wave “b”. Above from there, the index is rallying higher in a strong Impulse Elliott Wave structure with extension in the 3rd wave. It’s important to note that an impulse structure should have internal subdivision of lesser degree 5 […]
-
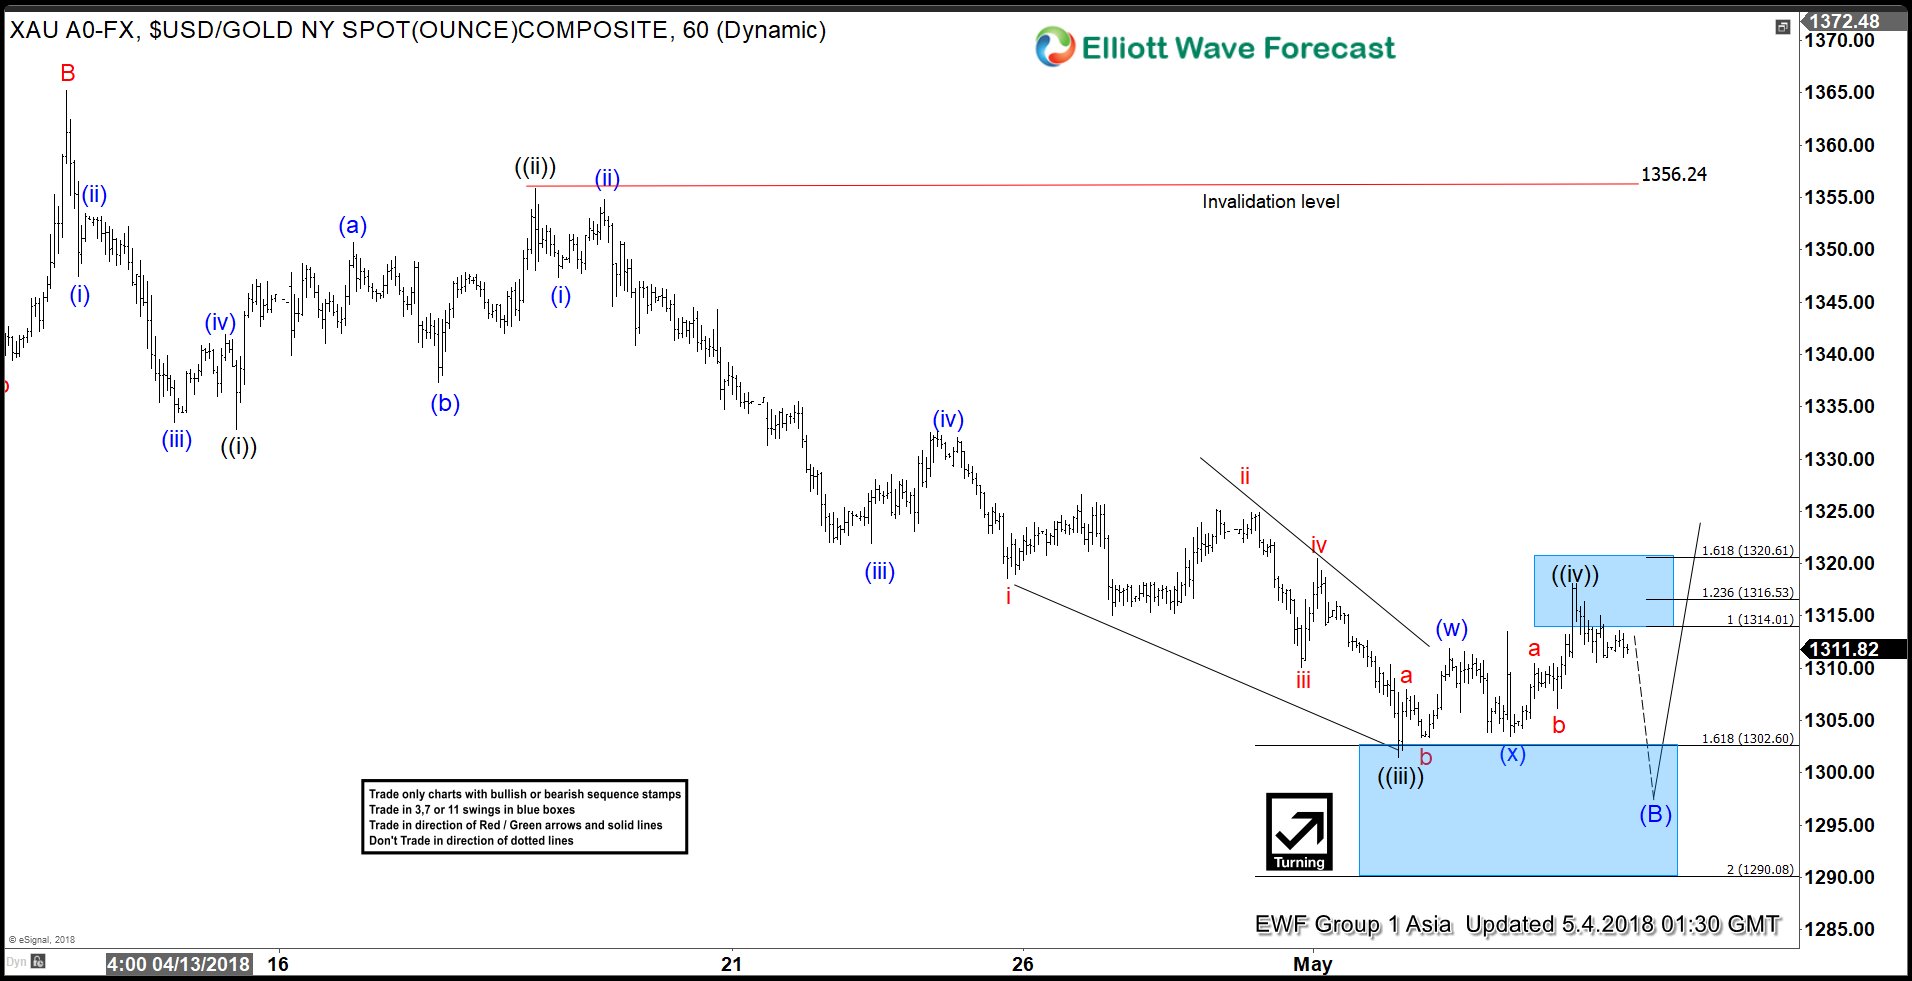
Elliott Wave View: Gold Entering Buying Areas
Read MoreGold short-term Elliott Wave view suggests that the rally to 4/11 high at 1365.24 ended Minor wave B. Below from there, the decline is unfolding as an impulse Elliott wave structure in Minor wave C of (B) lower. This structure forms a bigger FLAT Elliott Wave structure which starts from 1/25 peak. Internals of each leg to […]