
-
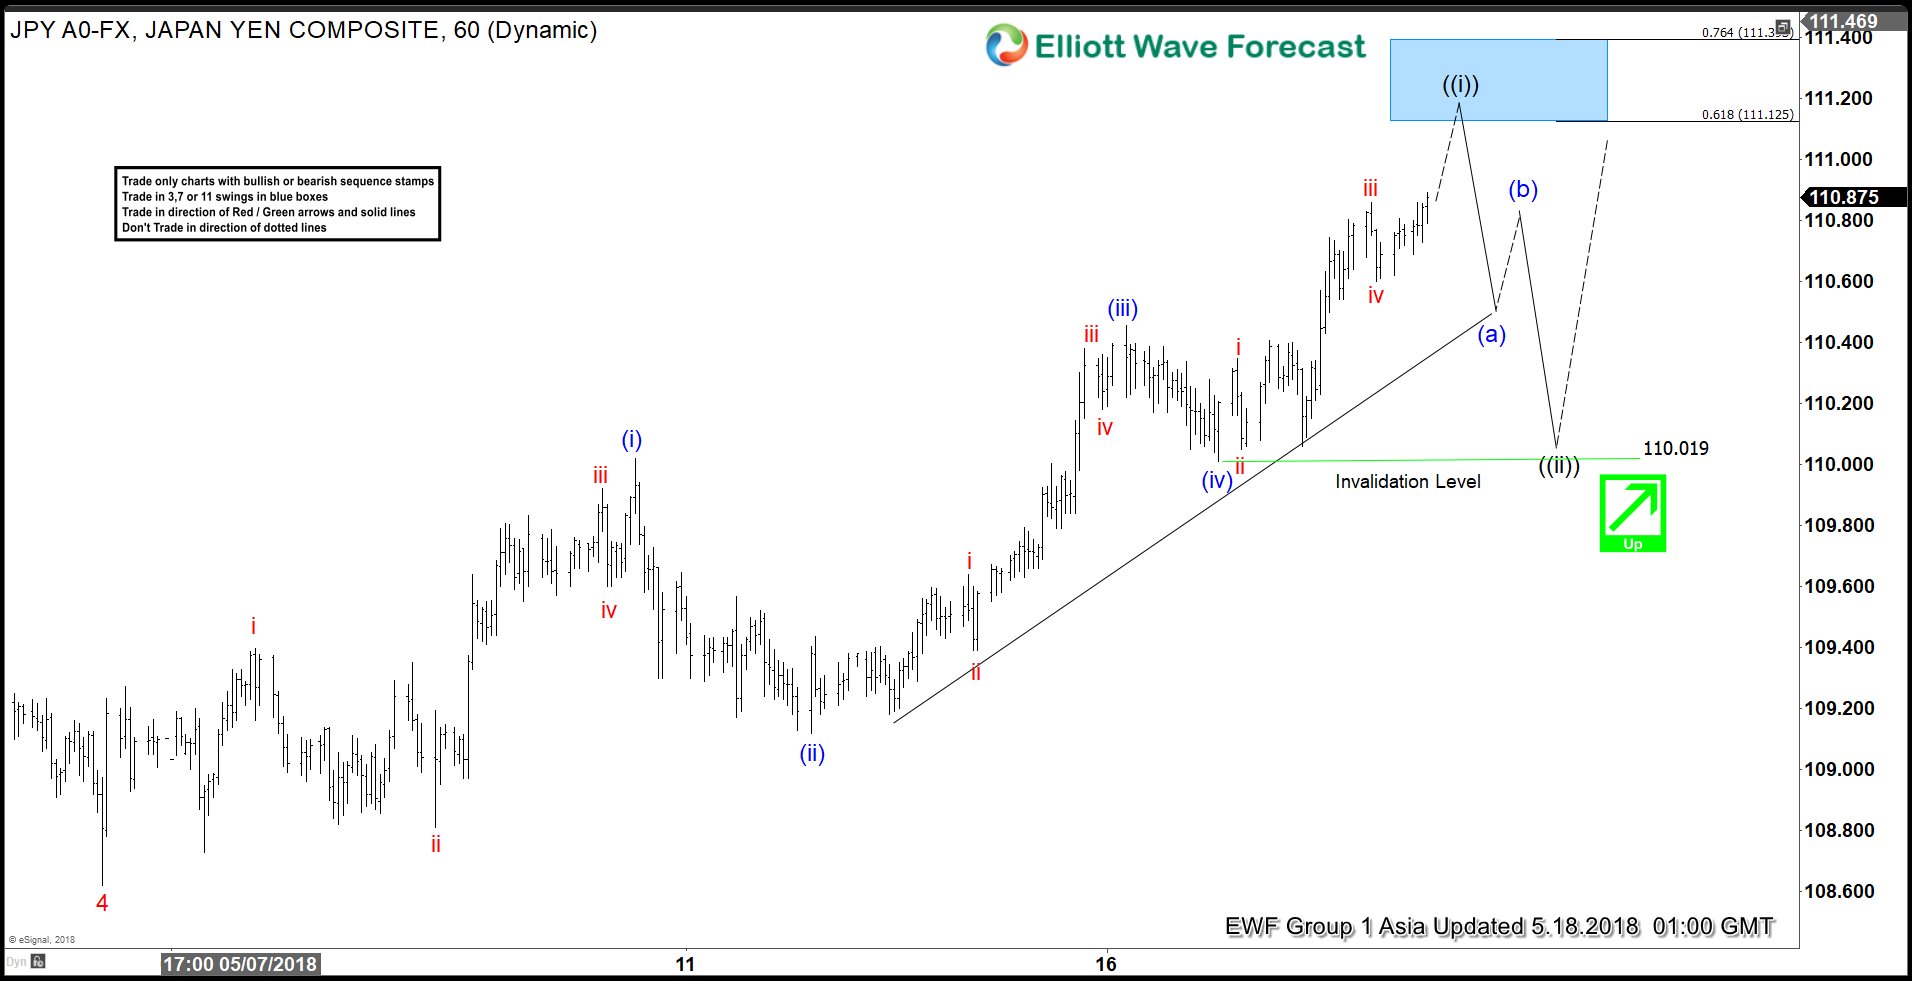
USDJPY Elliott Wave View: Ending 5 Waves Impulse Soon
Read MoreUSDJPY Short-term Elliott wave view suggests that the pullback to 108.62 on 5/04 low ended Minor degree wave 4. Above from there, the rally is unfolding as a 5 waves Elliott Wave structure, also known as Impulse. It’s important to note that the sub-division of Minor wave 1, 3 & 5 are also impulsive in […]
-
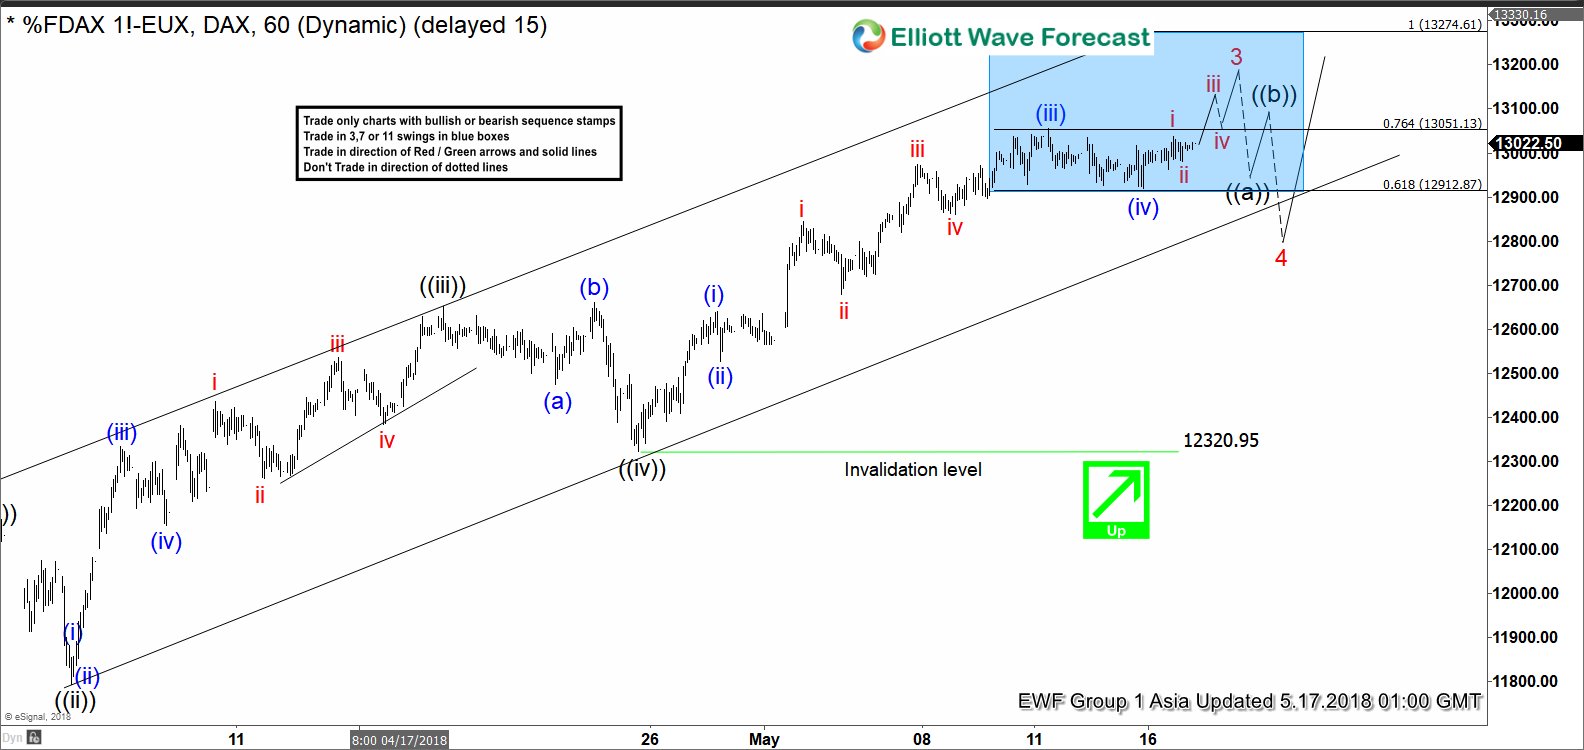
DAX Elliott Wave Analysis: Wave 3 Remains In Progress
Read MoreDAX short-term Elliott Wave view suggests that the rally from March 26.2018 low (11704) is unfolding as Impulse Elliott Wave structure. As an impulse, the internals of Minor degree wave 1, 3 & 5 should have subdivision of 5 waves impulse of lesser degree. In the case of DAX, Minute wave ((i)), ((iii)) & ((v)) are all impulsive. […]
-
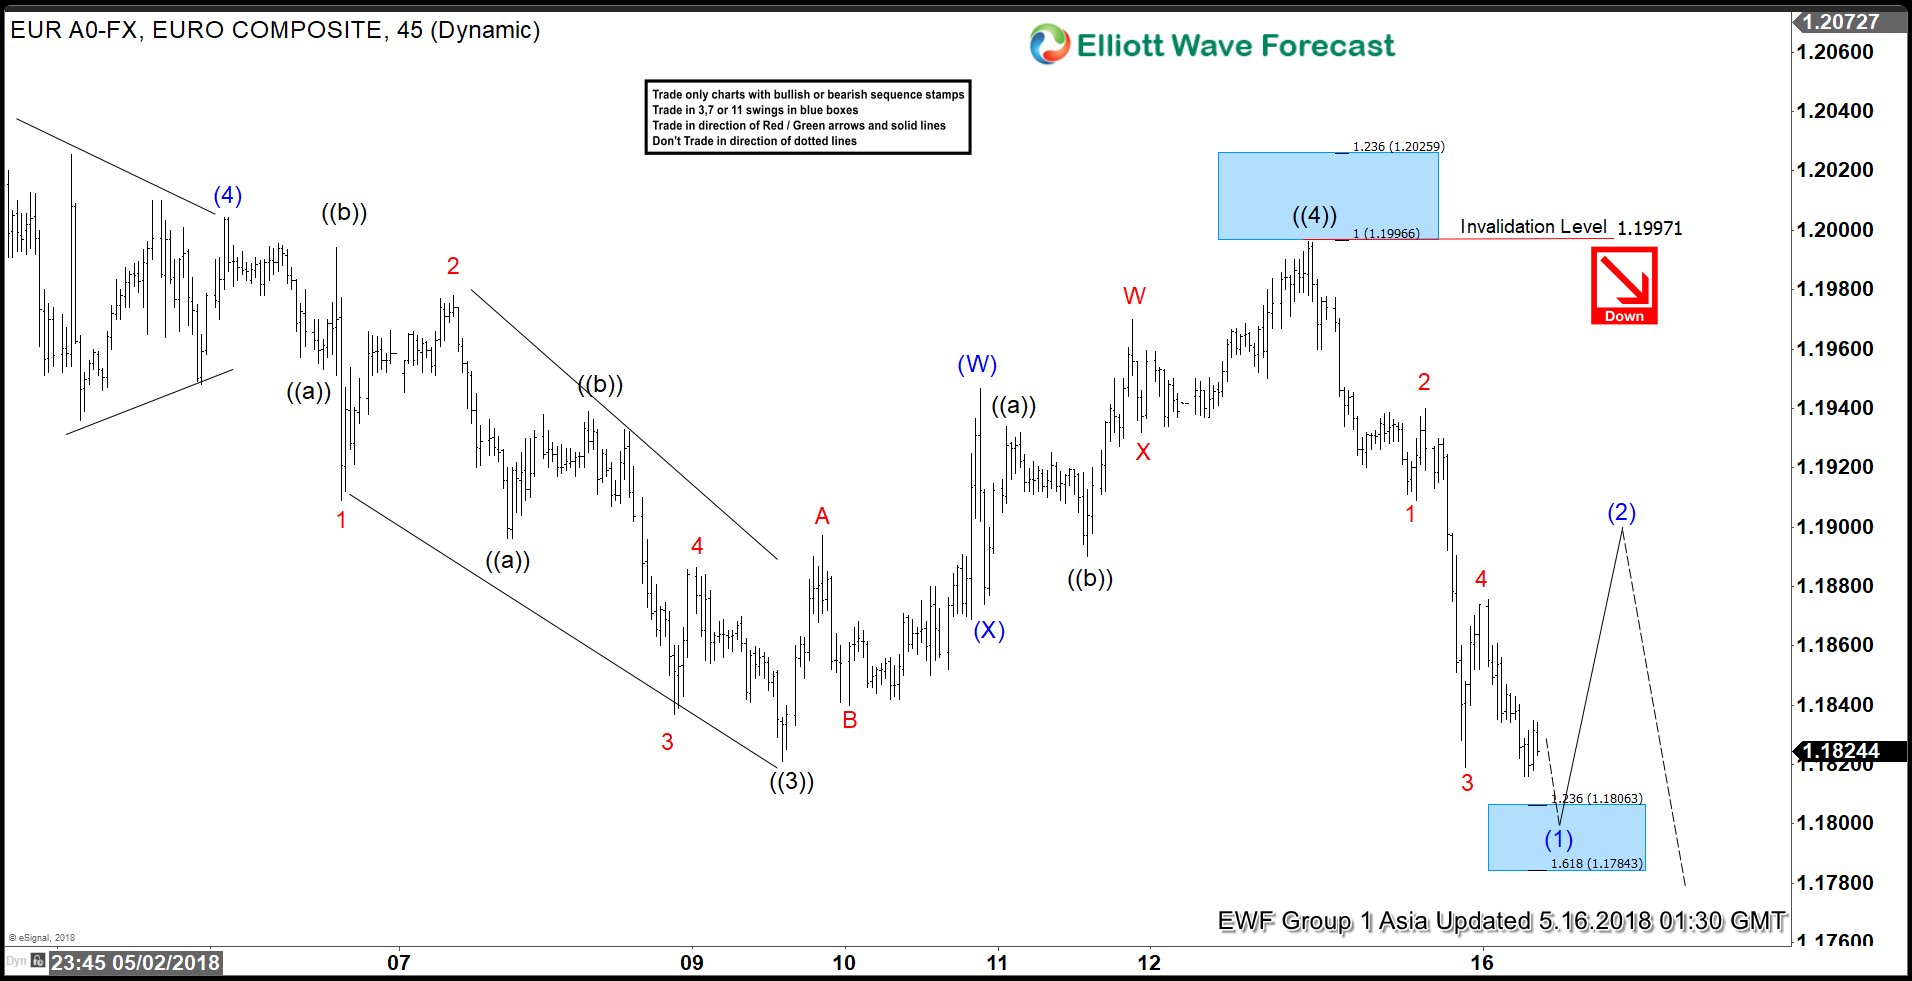
EURUSD Elliott Wave Analysis: Strength Can Be Temporary
Read MoreEURUSD Short Term Elliott Wave view suggests that the decline to 1.1821 on 5/09/2018 low ended Primary wave ((3)). The move lower came from 4/17/2018 peak as a 5 waves impulse structure. Above from 1.1821, pair ended the correction of cycle from 4/17/2018 high in Primary wave ((4)) at 1.1997. The internals of that rally […]
-
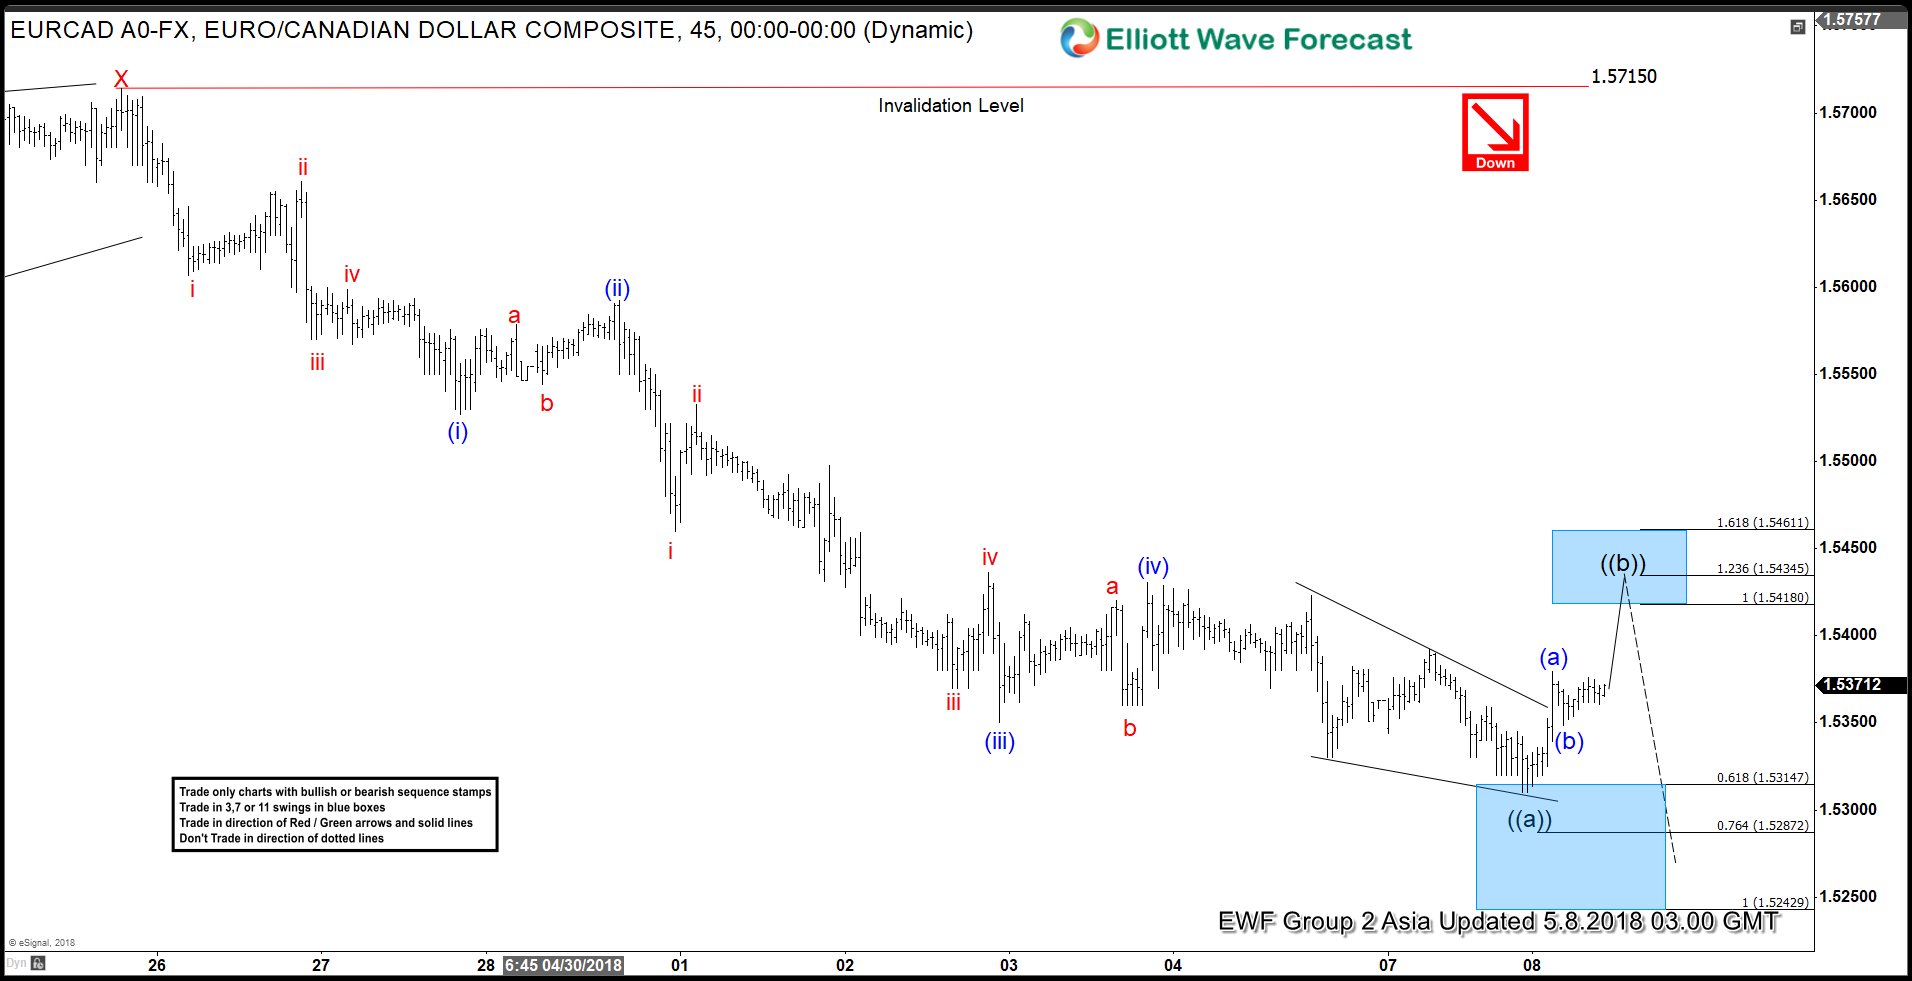
EURCAD: Selling The Elliott Wave Bounces
Read MoreIn this Technical blog, we are going to take a quick look at the past performance of EURCAD Elliott Wave charts that we presented to our clients. We are going to explain the structure and the forecast. As our members knew, we were pointing out that the sequence from March 20 high 1.6153 is incomplete to the […]
-
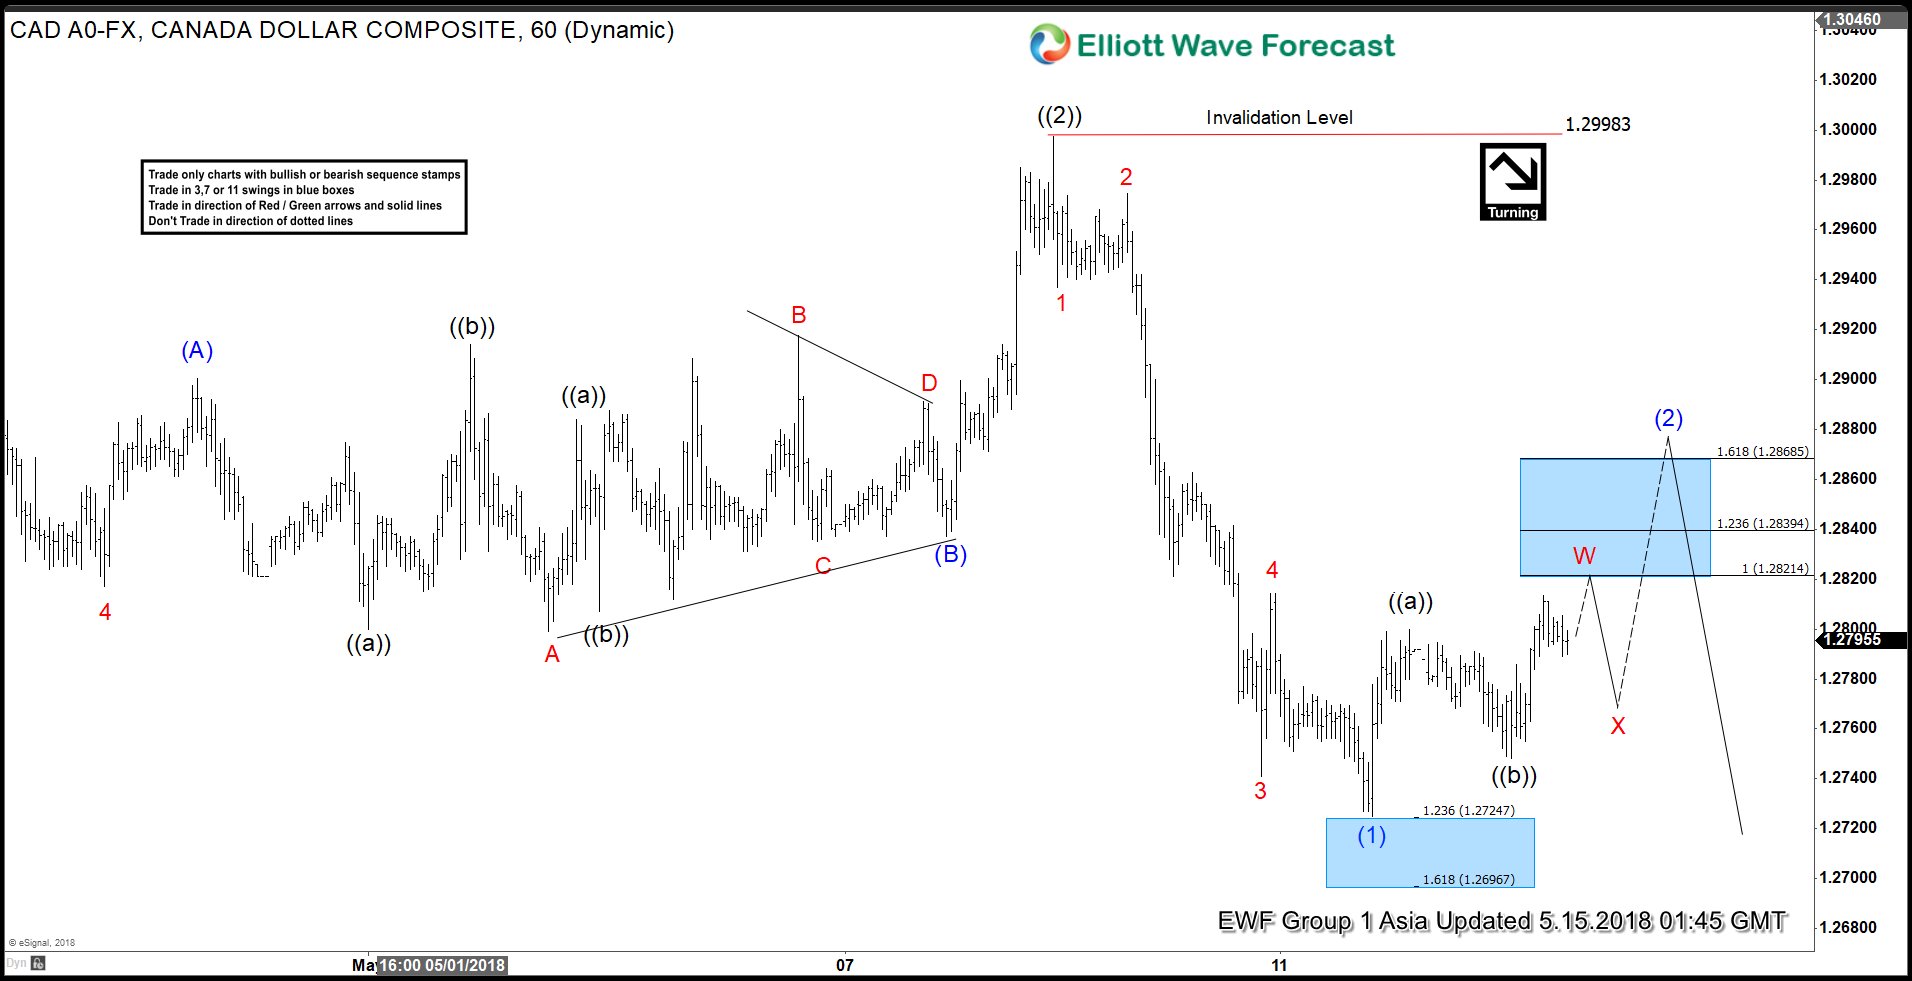
USDCAD Elliott Wave View: Correction May Fail for Extension Lower
Read MoreUSDCAD Short Term Elliott Wave view suggests that the rally to 1.2998 on May 08,2018 high ended Primary wave ((2)). The internals of Primary wave ((2)) unfolded as a Zigzag Elliott Wave structure where Intermediate wave (A) ended at 1.29. Afterwards, the sideways consolidation to 1.2837 low ended Intermediate wave (B) as a triangle Elliott […]
-
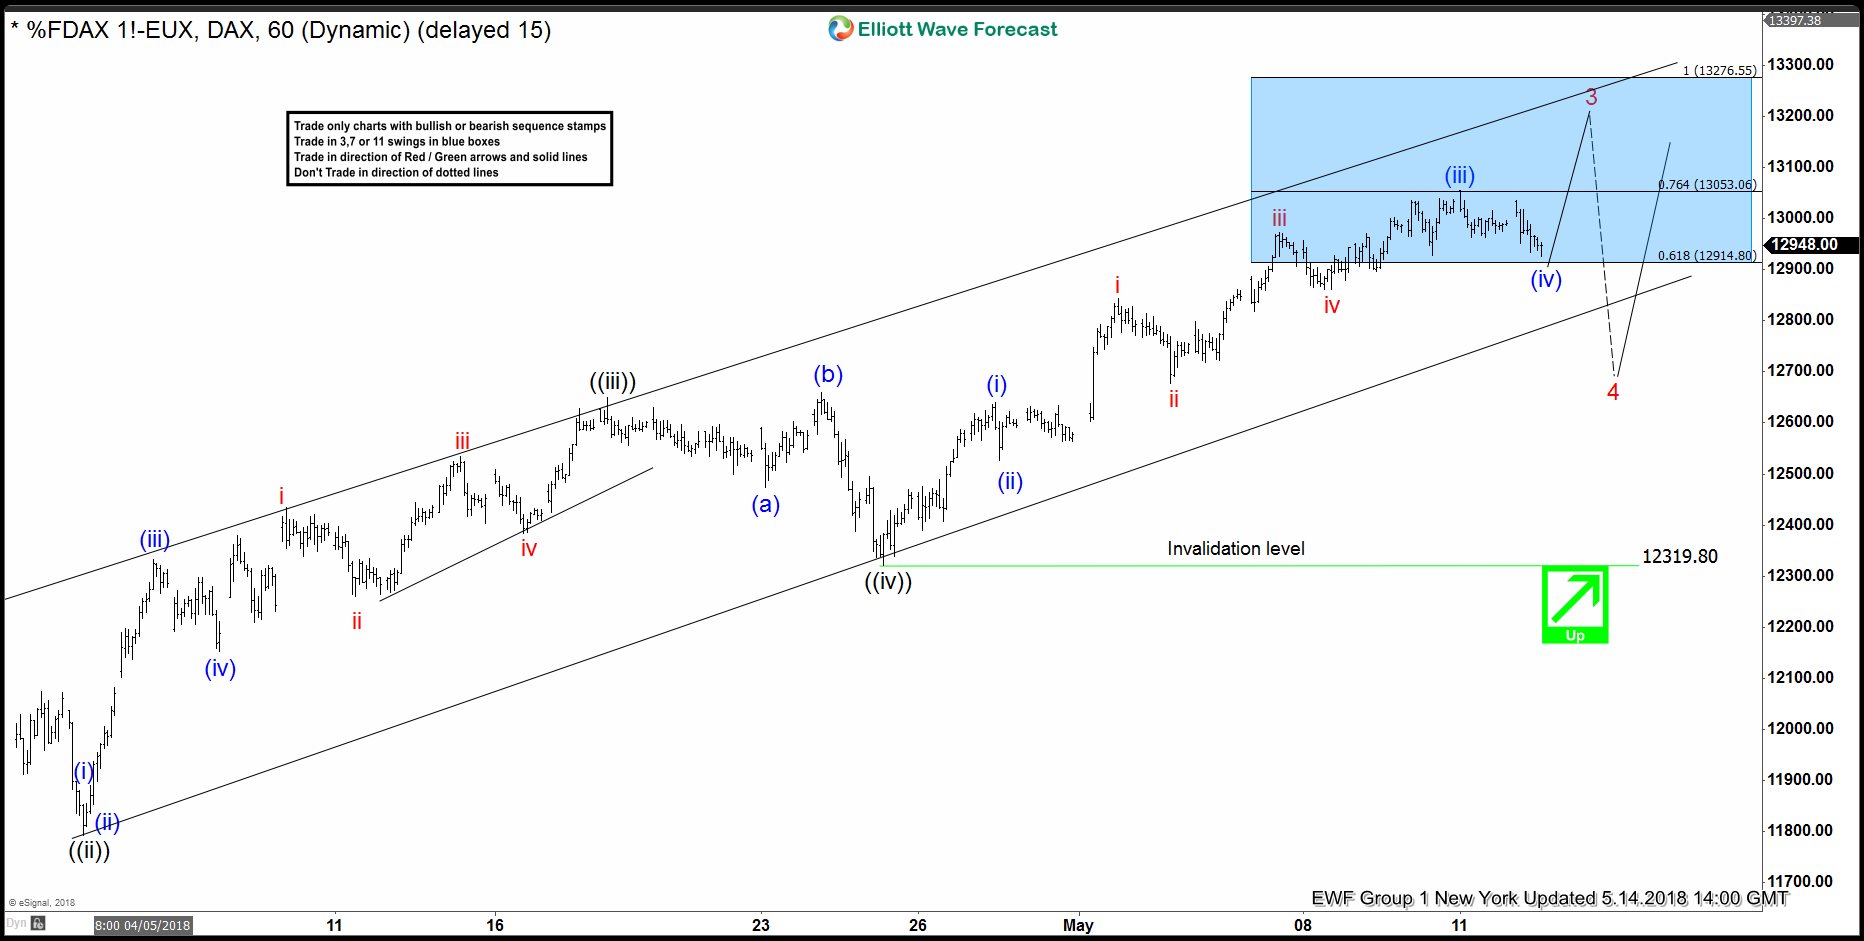
DAX Elliott Wave Analysis: Ending The Wave 3 Soon
Read MoreDAX Elliott Wave view in shorter cycles suggests that the rally from March 26.2018 low (11704) is extending higher in Impulse sequence with extension in the 3rd wave. It’s important to note that an impulse structure should have internal subdivision of lesser degree 5 waves impulse. And in particular, DAX’s case, Minute wave ((i)), ((ii)) and […]