
-
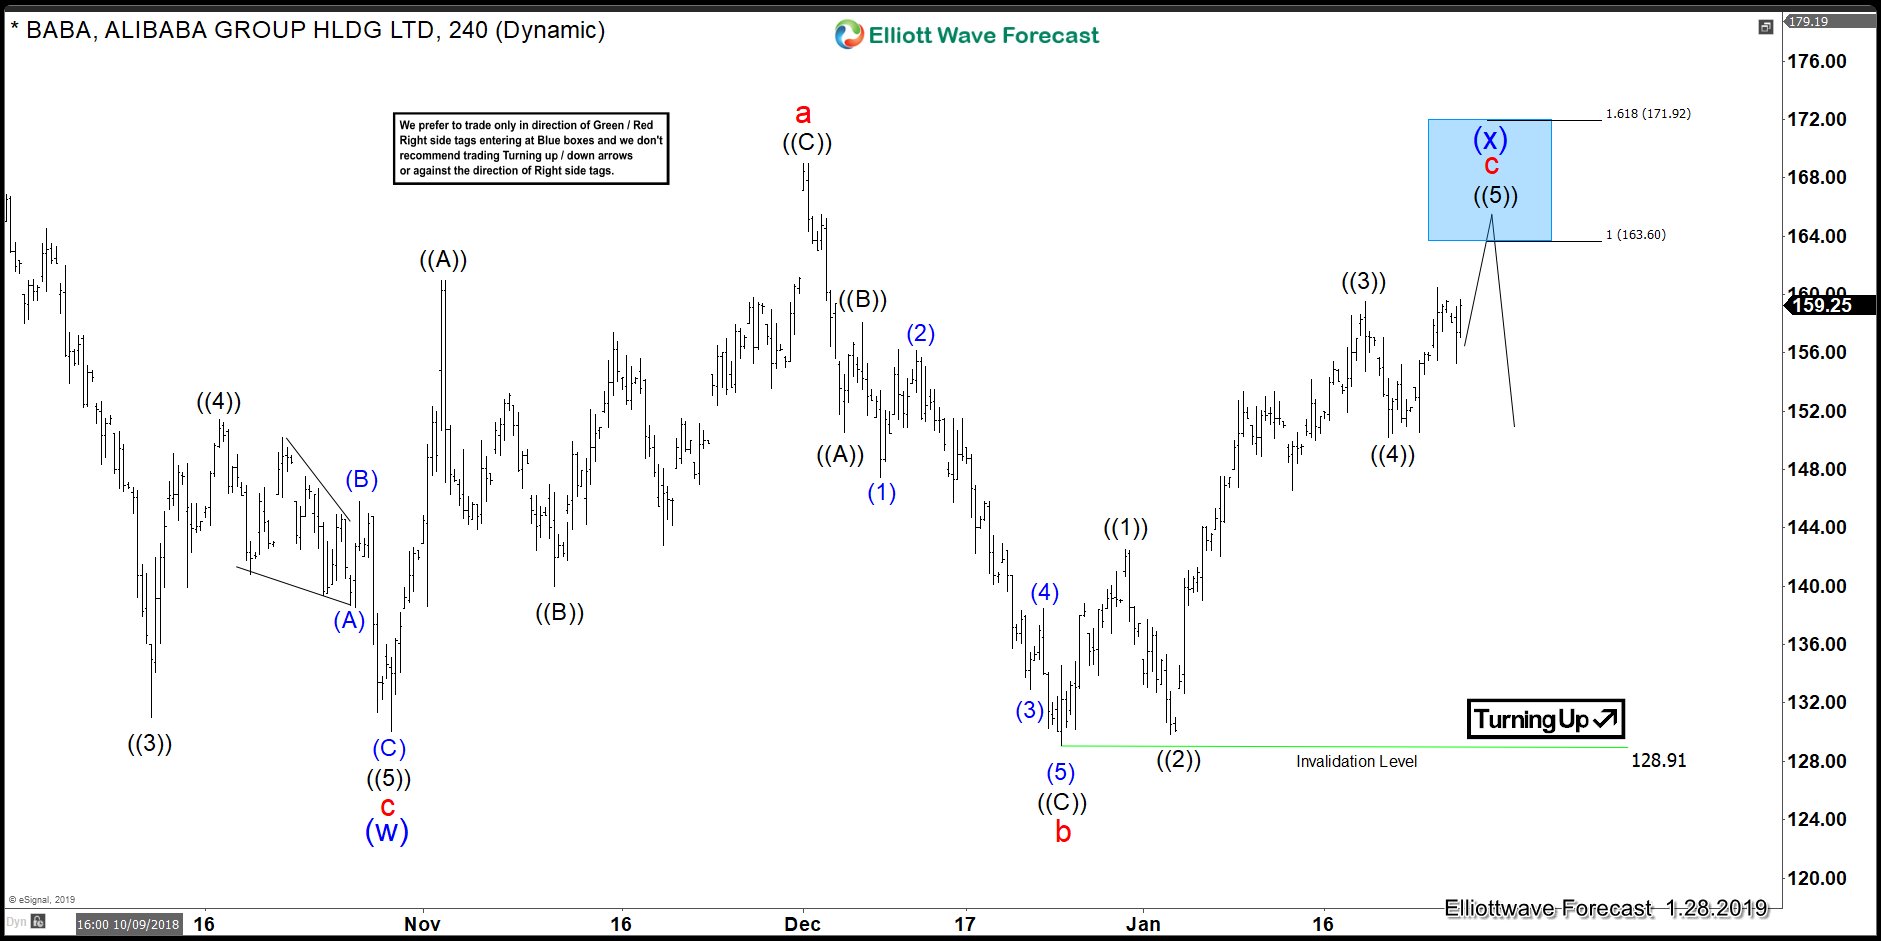
Alibaba Ended Elliott Wave Flat Correction: What’s Next?
Read MoreAlibaba has ended the cycle from 12/24/2018 low at $173.23 high suggesting that cycle from 10/30/2018 low ($130.06) could be done in Flat correction.
-

Tesla Elliott Wave Bearish Sequence Favoring More Downside
Read MoreTesla short term Elliott wave view suggests that the cycle from 12/07/2018 peak is showing incomplete structure favoring more downside.
-
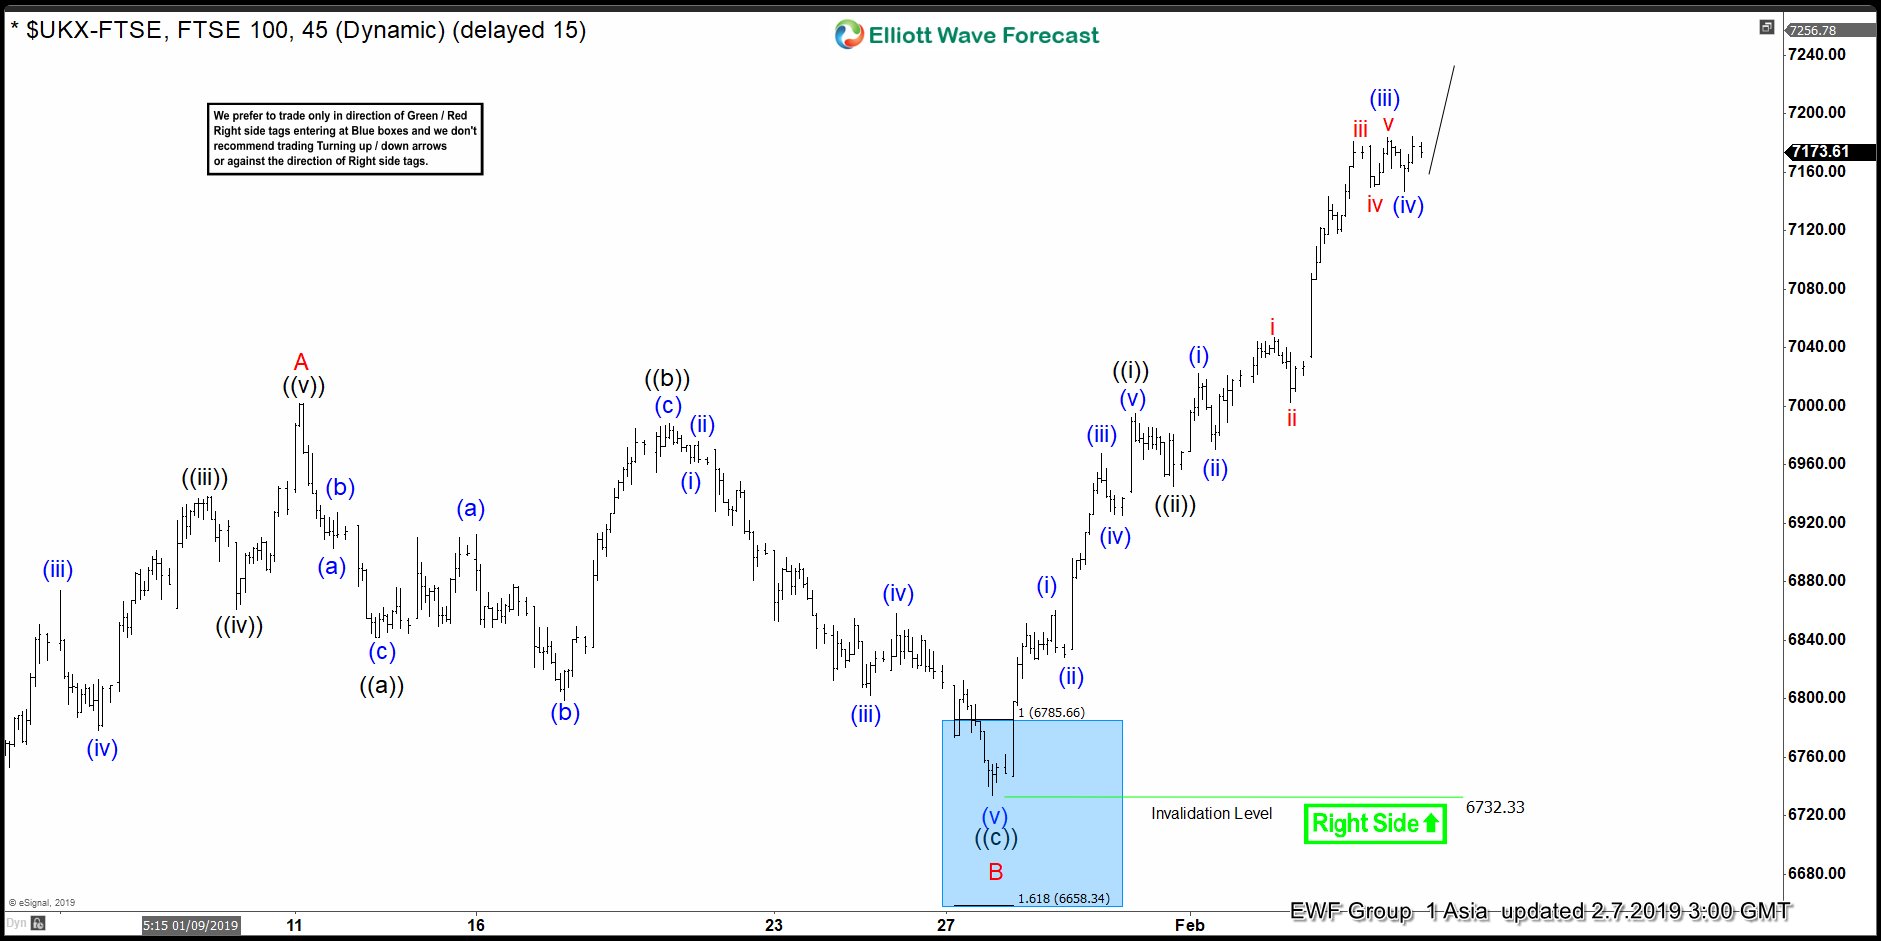
Elliott Wave View Suggest FTSE Close To Reaching Extreme
Read MoreFTSE short-term Elliott wave view suggests that the cycle from 12/27/2018 low is unfolding as elliott wave zigzag structure & soon should be reaching its extreme area at 7191.16-7473.95 expecting more downside or 3 wave reaction lower at least.
-
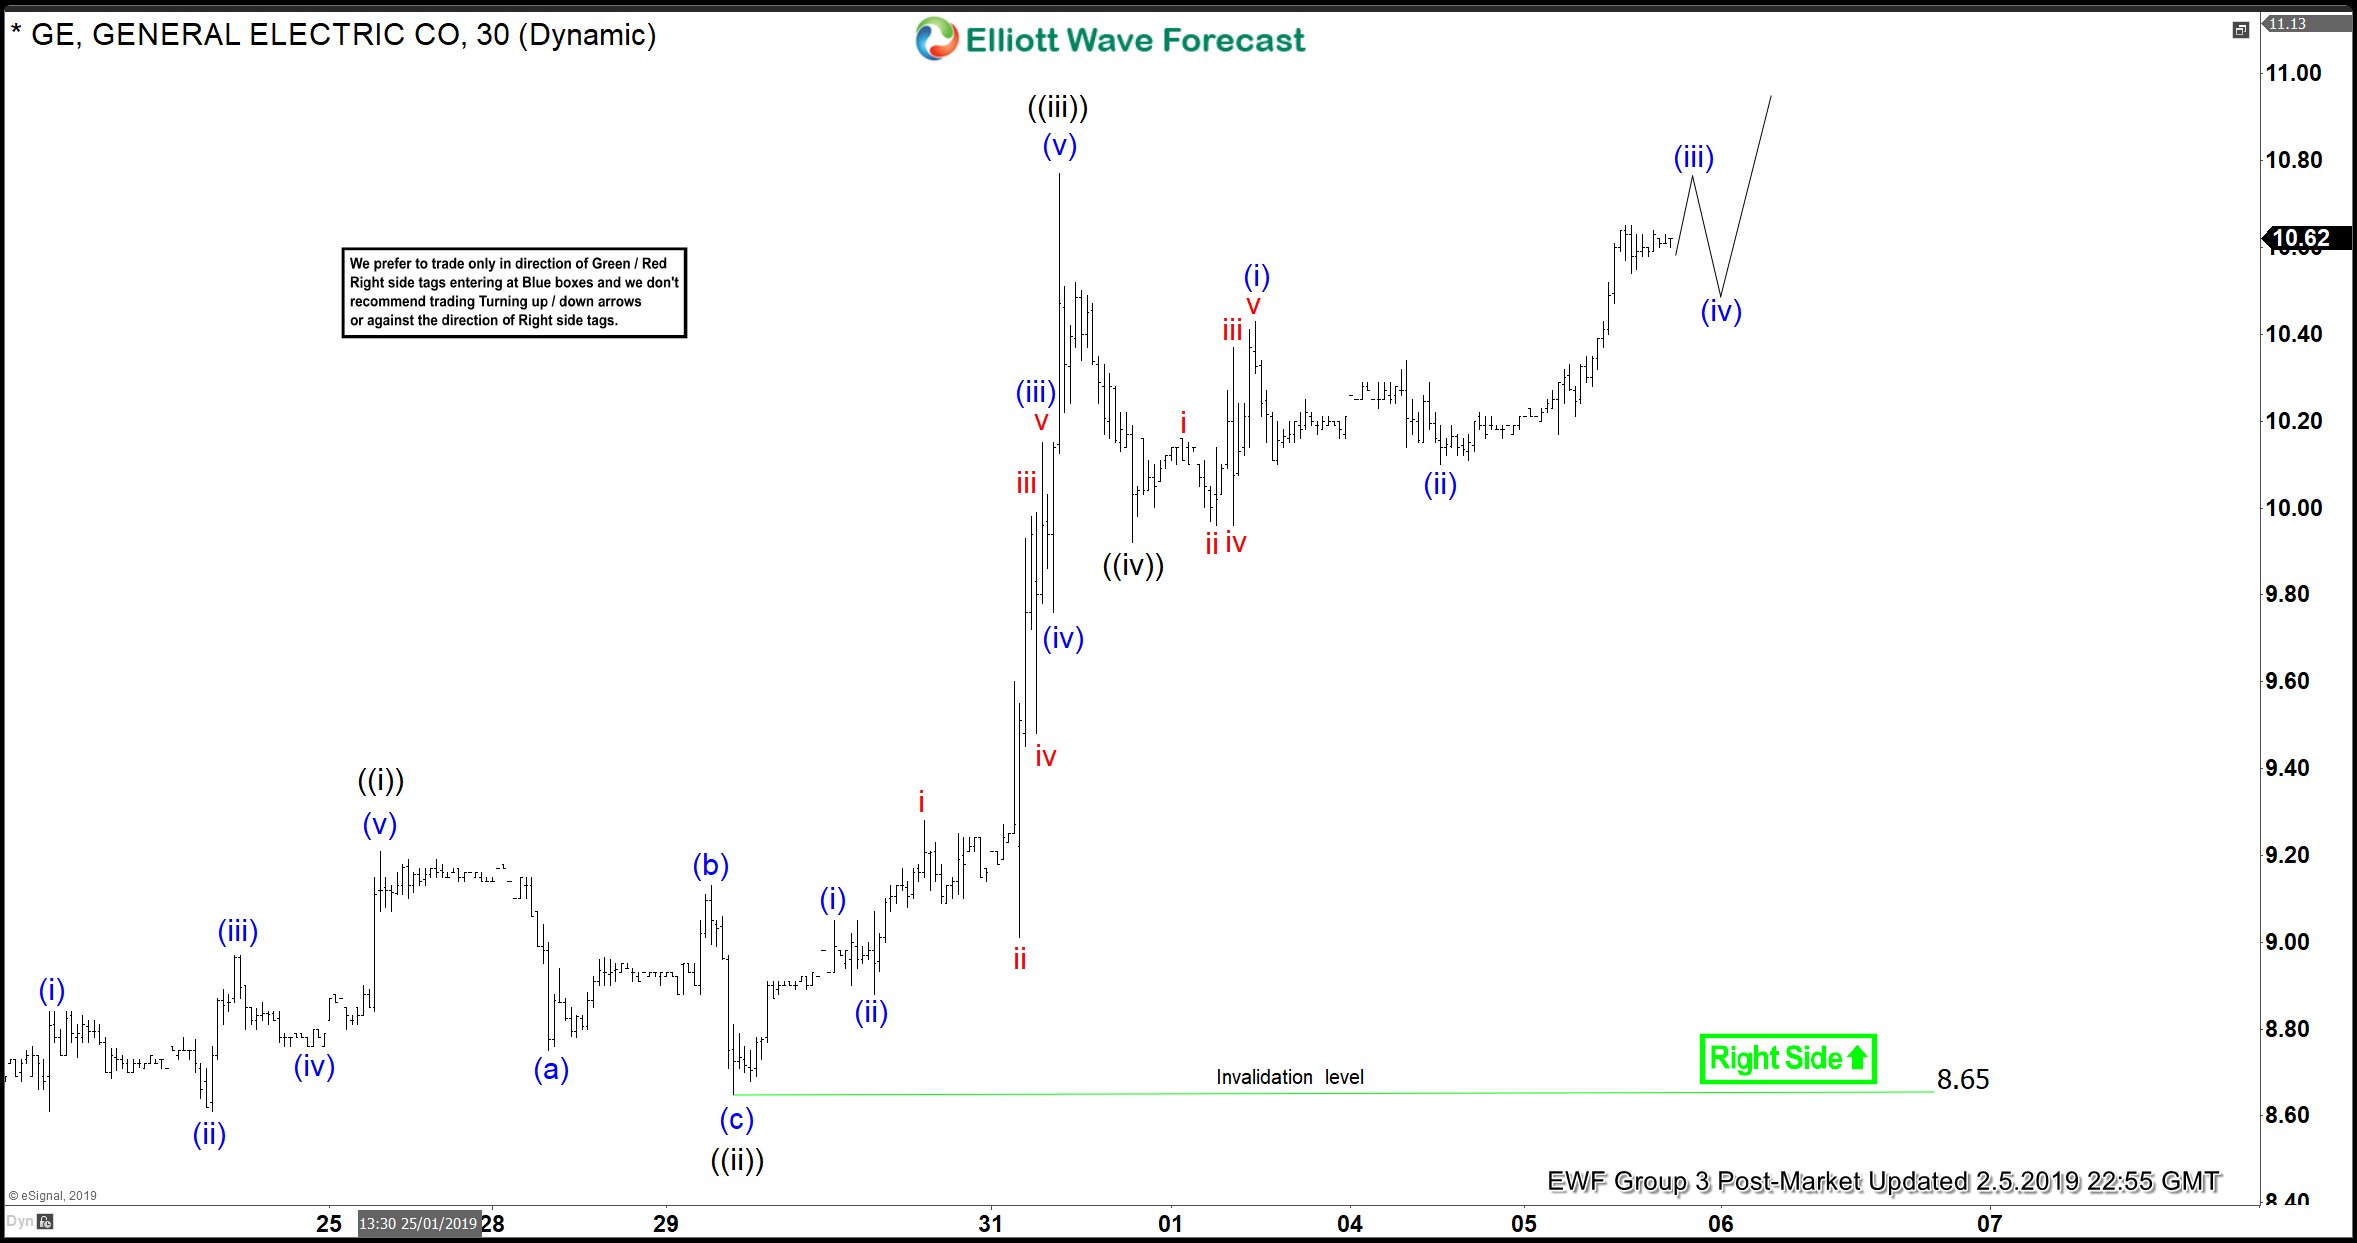
Elliott Wave View Suggest More Upside in General Electric
Read MoreGeneral Electric short term Elliott wave view suggests that the rally from 12/11/2018 low is unfolding as zigzag structure & missing the extreme favoring more upside still.
-
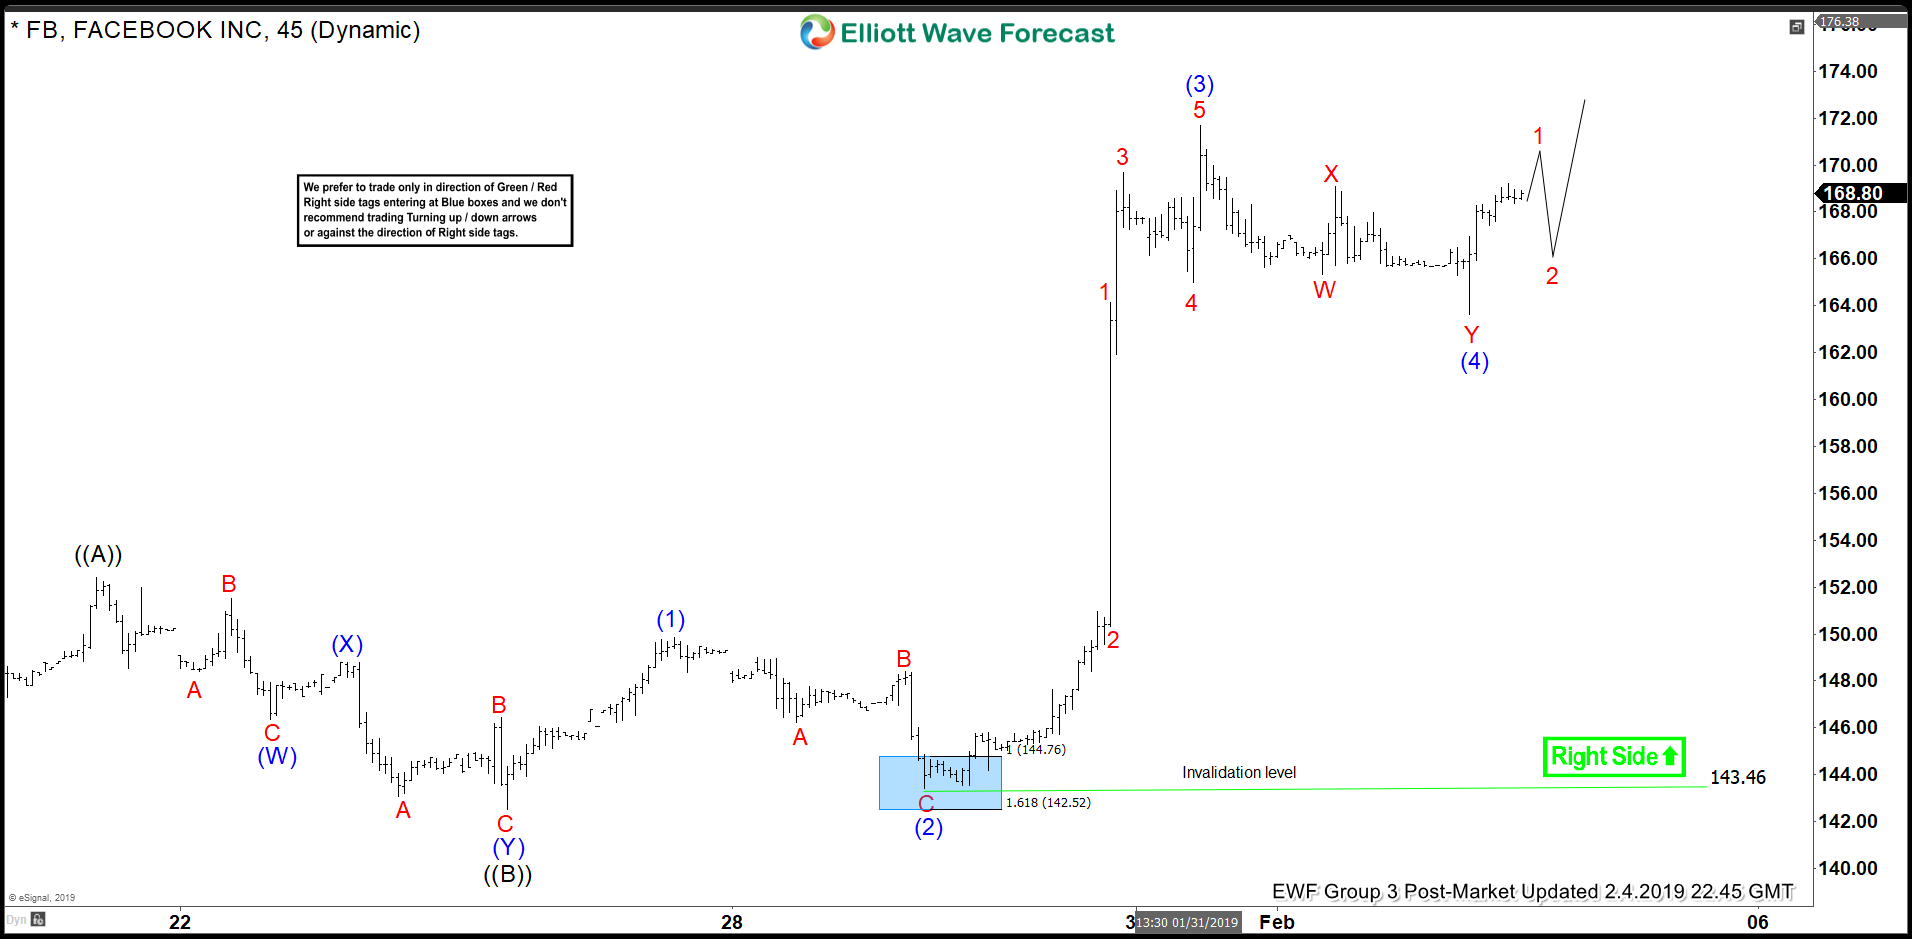
Elliott Wave View Suggest Another Push Higher In Facebook
Read MoreThis article and video explain the short term Elliott Wave structure of Facebook. 1 more high is expected due to incomplete Elliott wave structure.
-
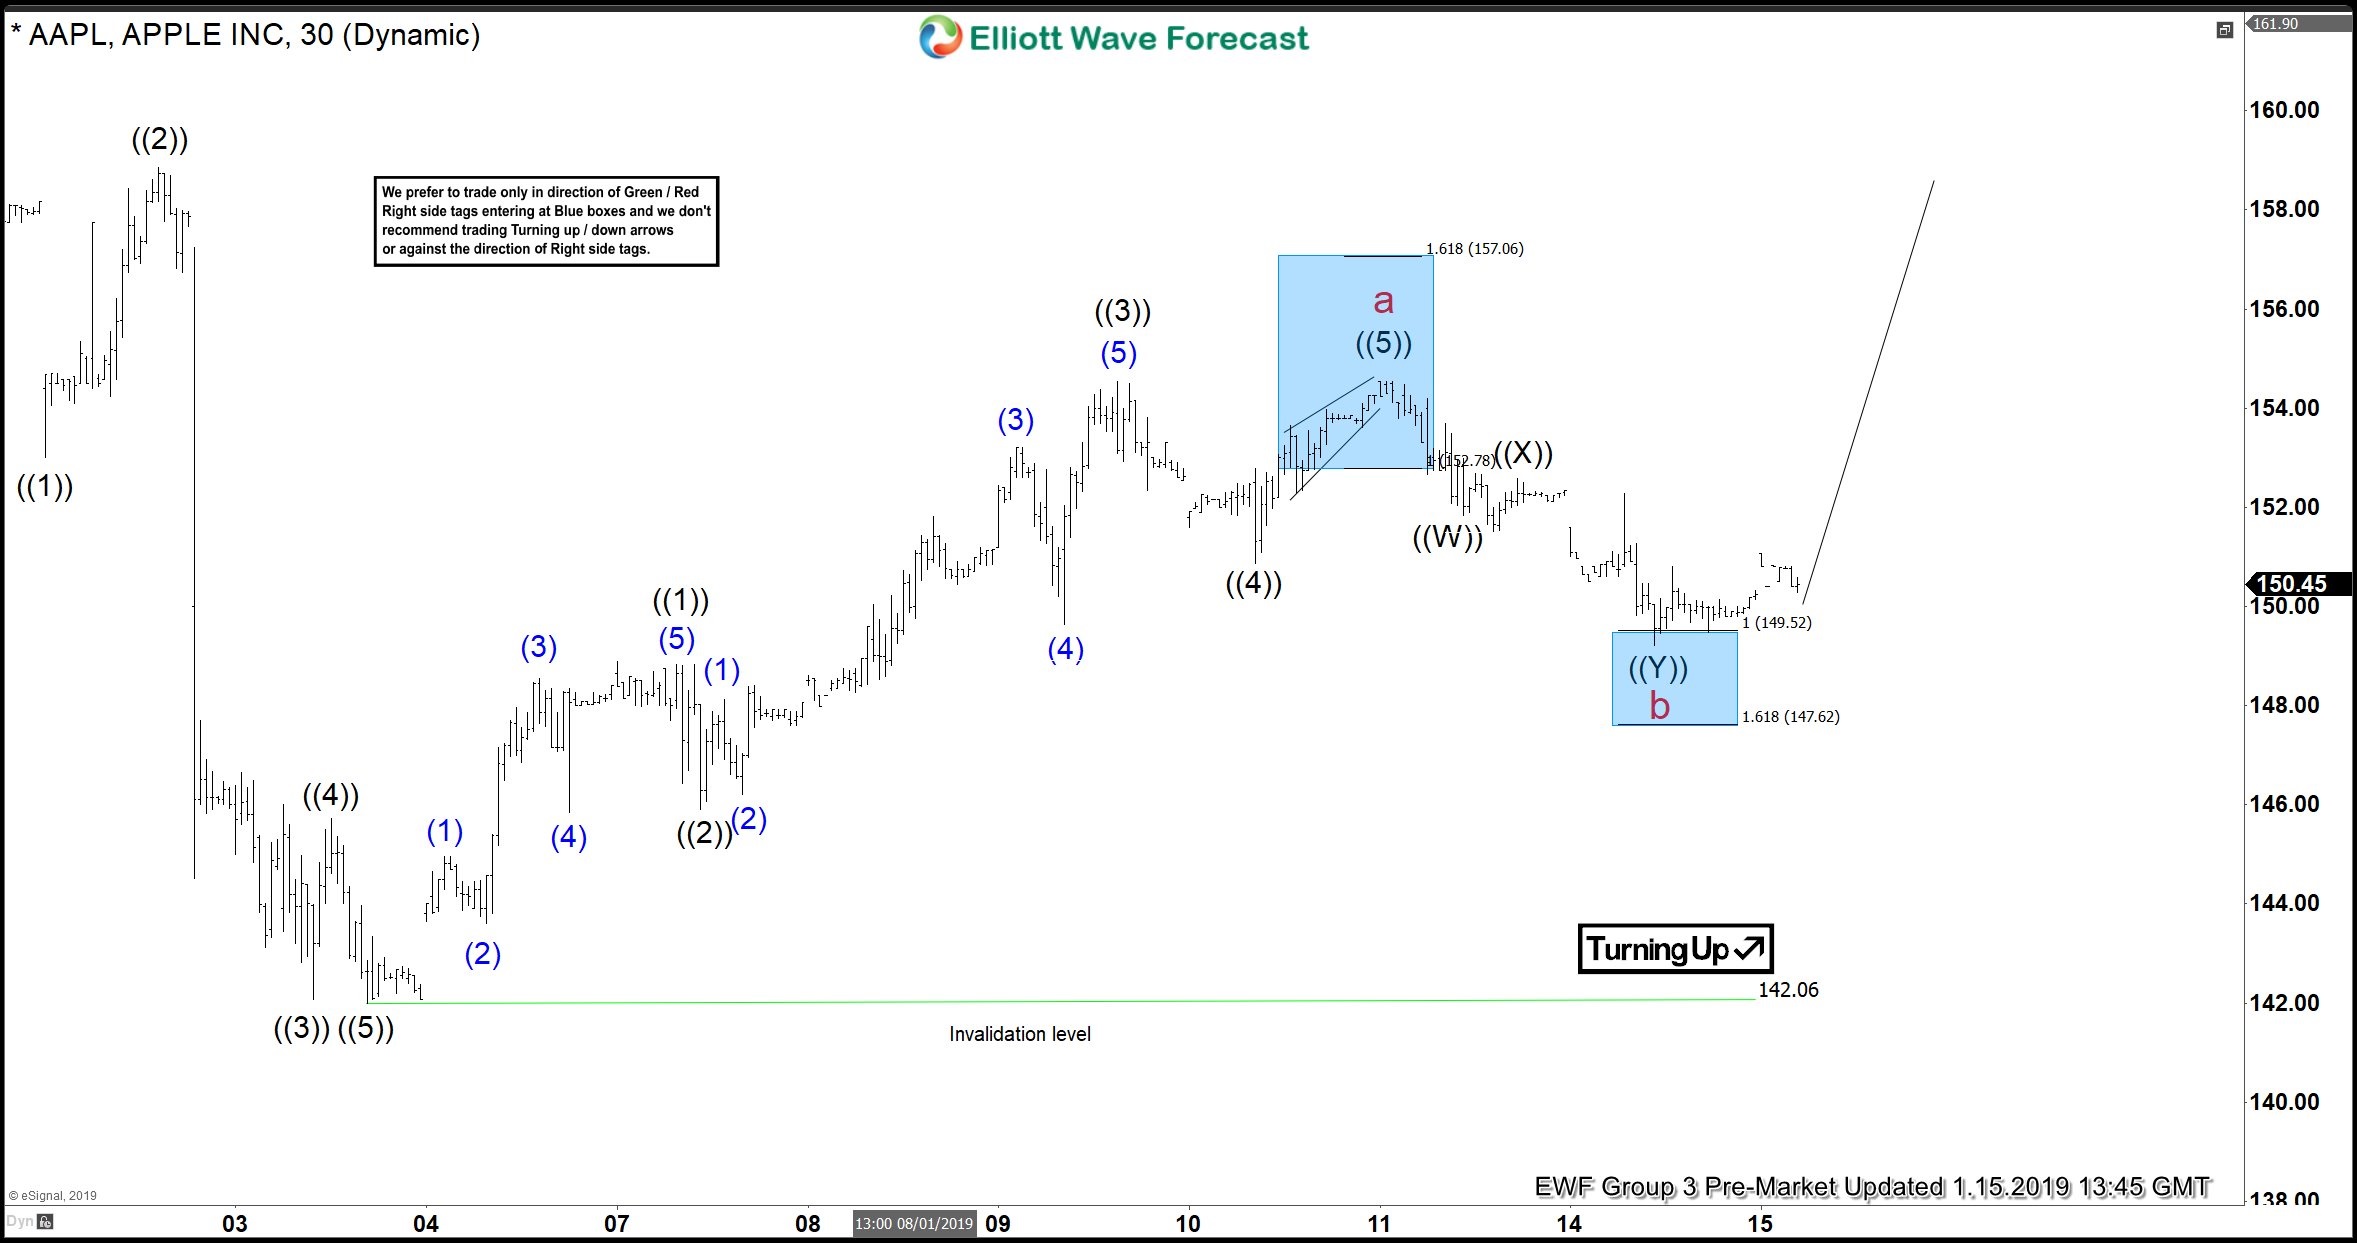
Apple Forecasting The Elliott Wave Bounce
Read MoreIn this technical blog, we are going to take a look at the past performance of Apple ticker symbol: $AAPL, 1 hour Elliott Wave charts that we presented to our clients. We are going to explain the structure and the forecast below. Apple 1 Hour Elliott Wave Chart From 01/13/2019 Above is the 1 Hour Elliott […]