-

SPX Short-term Elliott Wave update 4.23.2015
Read MoreSince our last update on SPX500, Index pulled back to 2091 (50 fib) and has rallied to new highs as expected. Focus remain on 2122 – 2139 area to complete red wave “W” which we think would complete a double three i.e. ((w))-((x))-((y)) Elliott wave structure up from 3/11 (2039) low. This is where buyers […]
-

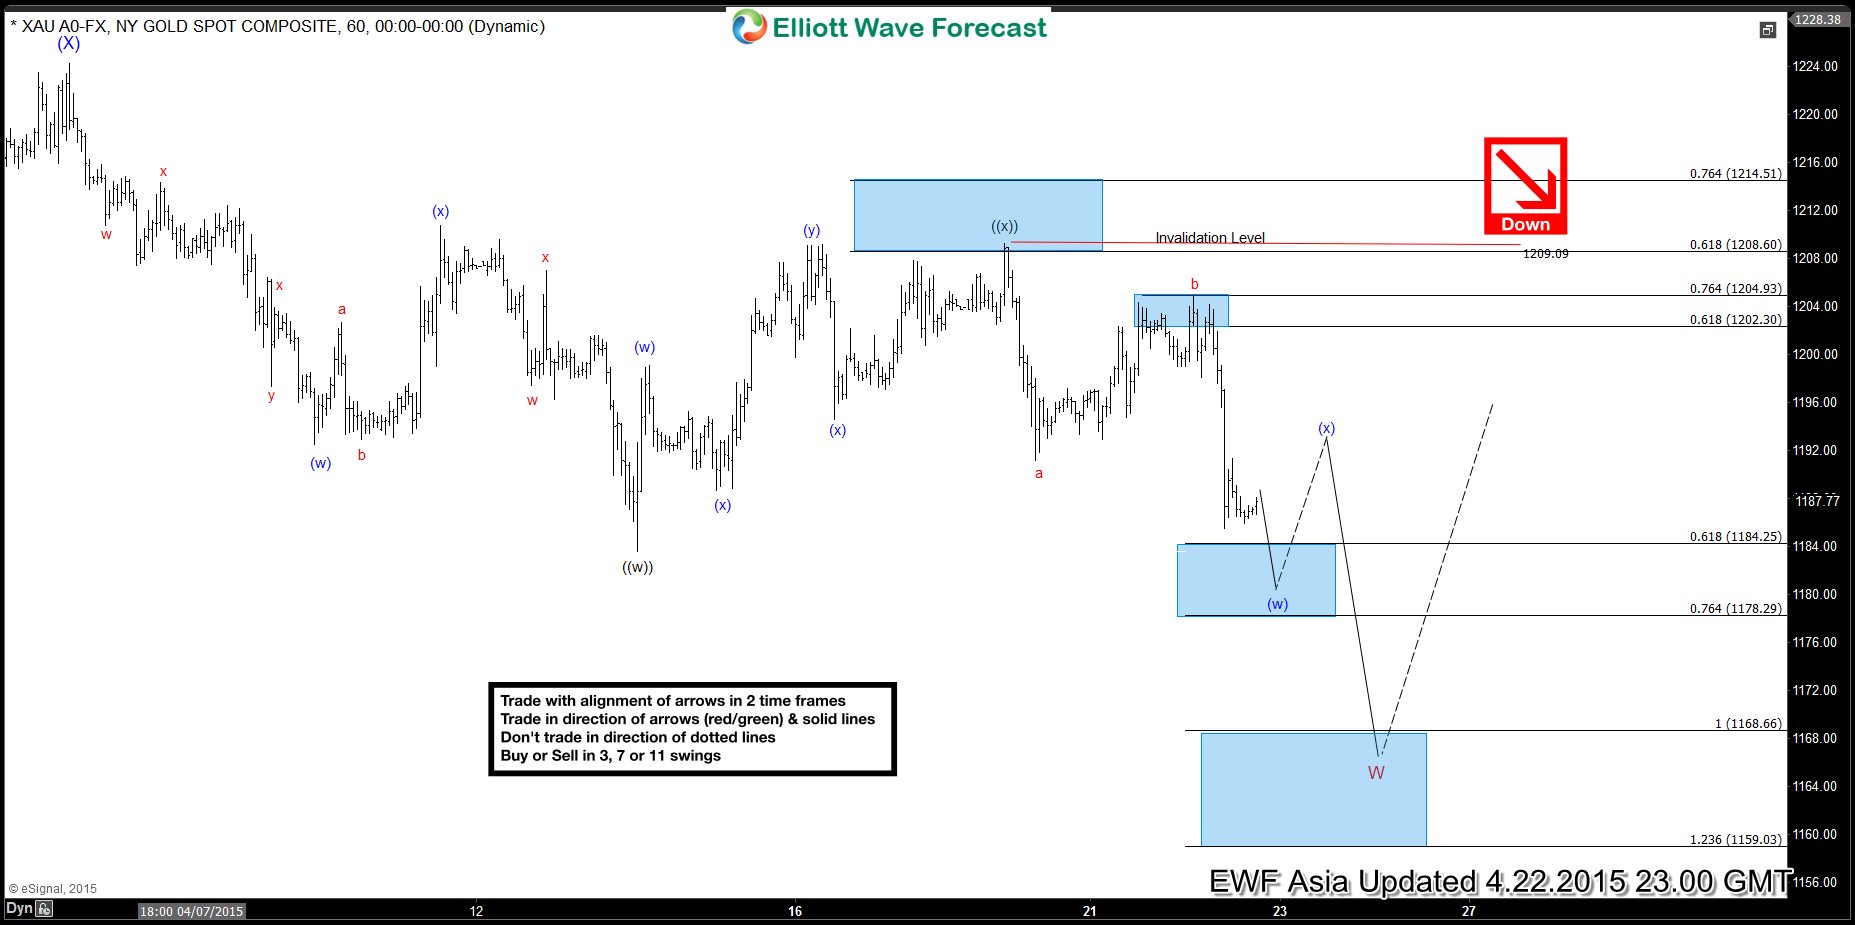
XAU (Gold) Short-term Elliott Wave Analysis 4.22.2015
Read MoreGold is proposed to be doing a ((w))-((x))-((y)) Elliott wave structure 1224 (4/6) high. Wave ((w)) ended at 1183.60, wave ((x)) completed at 1209.09 and wave ((y)) lower is proposed to be in progress. We need to see a break below 1183.60 (4/14) low to add more conviction to this view as that would make it […]
-

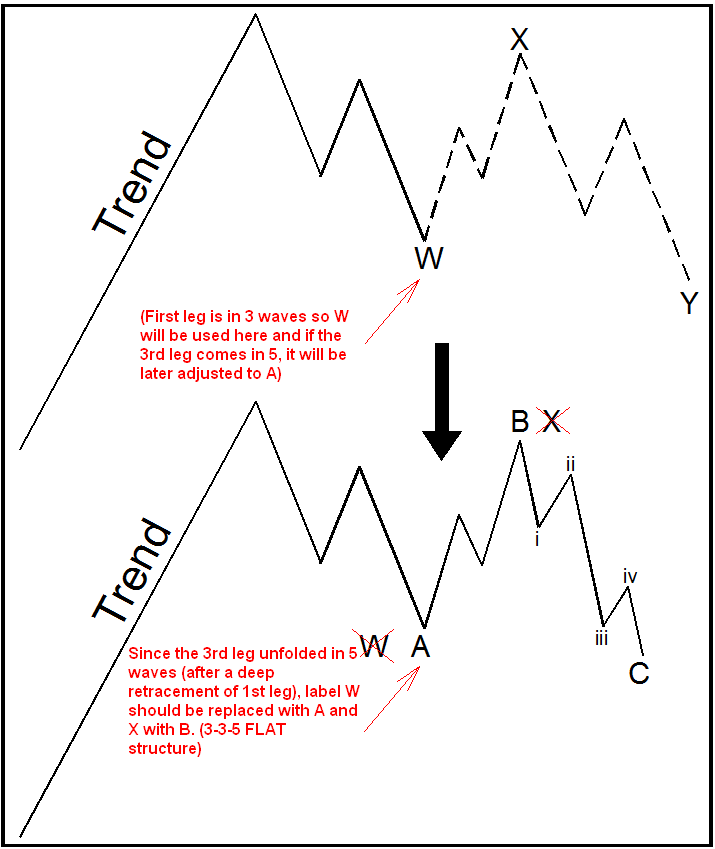
Labeling Elliott Wave Patterns
Read MoreThe patterns that usually occur in the market can be subdivided in two main categories: Impulsive pattern and corrective pattern. The main difference between these two groups is in Impulsive pattern the move in the market is sharp and without overlap but in corrective pattern, we see sideway and overlapping price actions. The impulsive patterns […]
-

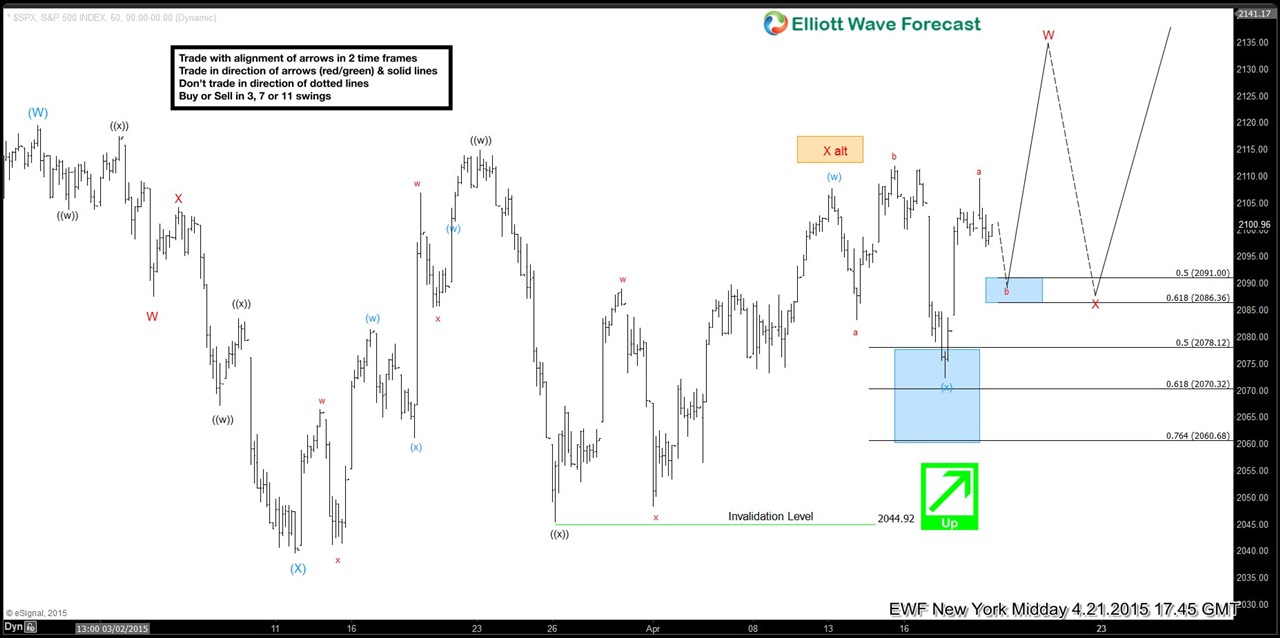
$SPX Short-term Elliott Wave update 4.21.2015
Read MorePreferred Elliott wave view suggests a cycle from (x) low has ended and a pull back in wave “b” is in progress. 2091 – 2086 is the ideal area to complete this pull back and then we expect the rally to resume. Green arrow indicates the trend is up and also the line going toward “b” […]


