McDonald’s (MCD) is the world’s largest fast food restaurant chain, serving over 69 million customers daily in over 100 countries in more than 40,000 outlets as of 2021. McDonald’s is best known for its hamburgers, cheeseburgers and french fries, although their menu also includes other items like chicken, fish, fruit, and salads.
Since the largest fast food franchise in the world was created, it has been a money-making machine. The share prices has always kept bullish, facing very well catastrophic scenarios such as the last financial and real estate crisis of 2008. Only in certain specific periods of history can we see that the value dropped more than 40% of its price. In 1975, the oil crisis; 1987, Black Monday; in 2000 with the dotcom crisis and now with the COVID19 pandemic. If you are a long-term investor, this MCD stock should definitely be in your portfolio.
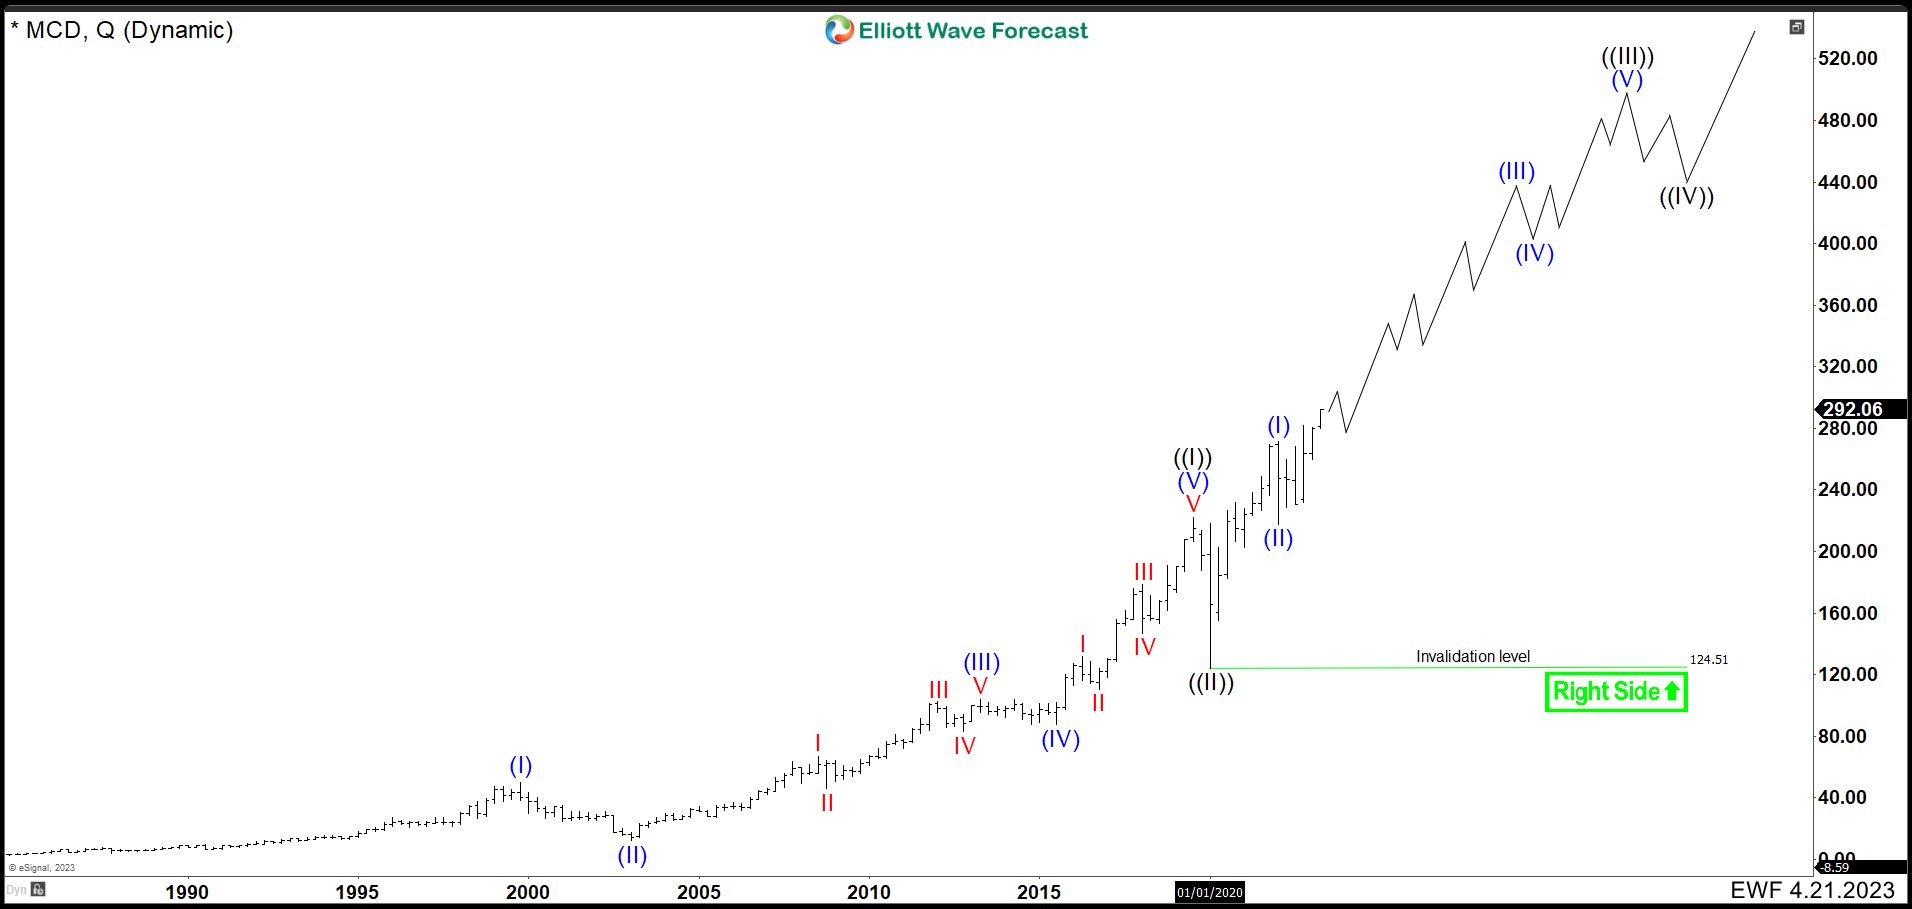
McDonald’s MCD Quarterly Chart April 2023
In the chart above, we have MCD’s quarterly elliott wave analysis. The first important cycle was completed before the dotcom crisis, ending wave (I) at $49.56. The recessive period ended at the beginning of 2003, lowering the price to $12.12 and ending wave (II). Then, it had 10 years of growth reaching the price of $103.70 in 2013 with more than 700% yield. This was wave (III). In this year it entered a period of lethargy and sideways movement ending the wave (IV) at $87.50. The last 5 waves completed an impulse as wave (V) at $221.93 and all the grand super cycle ((I)) in 2019. (If you want to learn more about Elliott Wave Theory, please follow these links: Elliott Wave Education and Elliott Wave Theory).
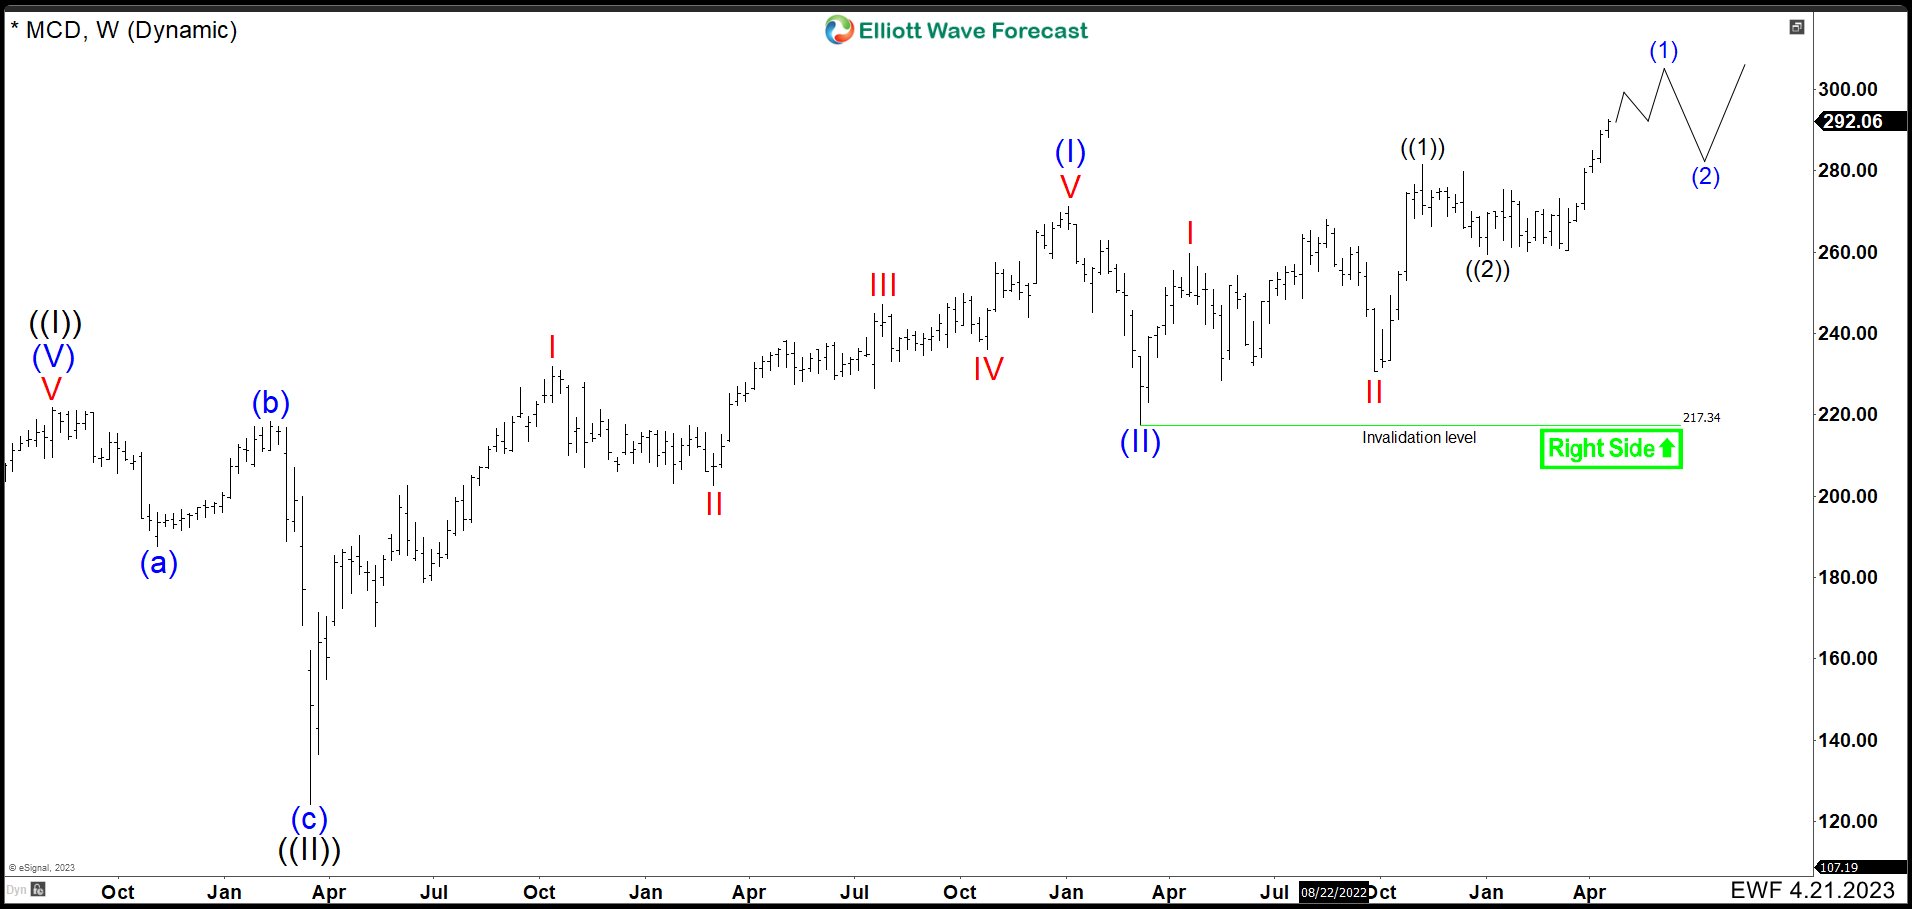
McDonald’s MCD Weekly Chart April 2023
In the weekly chart we can clearly see the retracement of the entire wave ((I)). The correction took on a flat Elliott Wave structure. Wave (a) ended at $187.55, the corrective bounce reached $218.38 completing wave (b). The drop in the form of an impulse occurred at the beginning of the COVID19 pandemic. Wave (c) ended at $124.23 and so did wave ((II)) in a fast pullback with losses above 43% in March 2020. Since this date, MCD holds a bullish stock price, reaching almost at $300 dollars per share. As long as the price remains above $217.68 and more importantly above $124.23, the MCD share price should continue the long-term rally within wave ((III)).
Taking 14 Days Trial
Elliottwave Forecast updates one-hour charts 4 times a day and 4-hour charts once a day for all our 78 instruments (Stocks, ETFs, Indices, Commodities, Forex, Cryptos). We do a daily live session where we guide our clients on the right side of the market. In addition, we have a chat room where our moderators will help you with any questions you have about what is happening in the market.
Let’s trial 14 days for only $9.99 here: I want 14 days trial. Cancel Any time at support@elliottwave-forecast.com
Back


