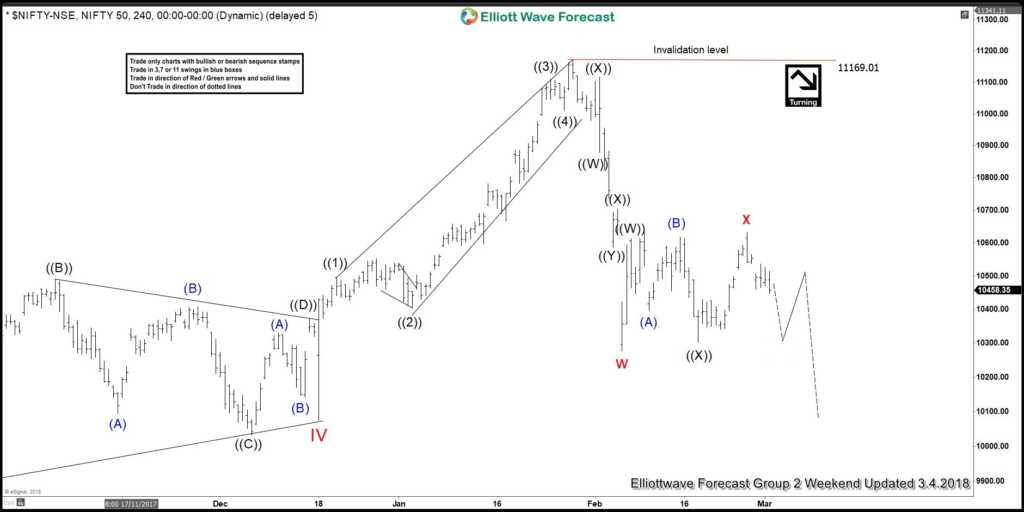
Today, we will have a look at some Elliott Wave structures of Nifty which we presented to our members in the past at in the members area. Below, I attached our 4-hour weekend update chart presented to our members on the 03/04/18. Calling more downside after a double three Elliott wave correction.
We suggested to our members that NIFTY ended the cycle from 02/06 low in red wave X in a truncation at around the areas of 10610. Consequently, we mentioned that the market should ideally extend into new lows in red wave Y. In our Daily Live Analysis Session, we explained to our members that the European indices ended at that time a cycle and therefore we went with the more aggressive view in calling Nifty completed. With that said, we advised members that the right side remains to the downside in near-term. As we were looking for another similar 4-hour push lower.
Nifty 03.04.2018 4 Hour Chart Elliott Wave Analysis
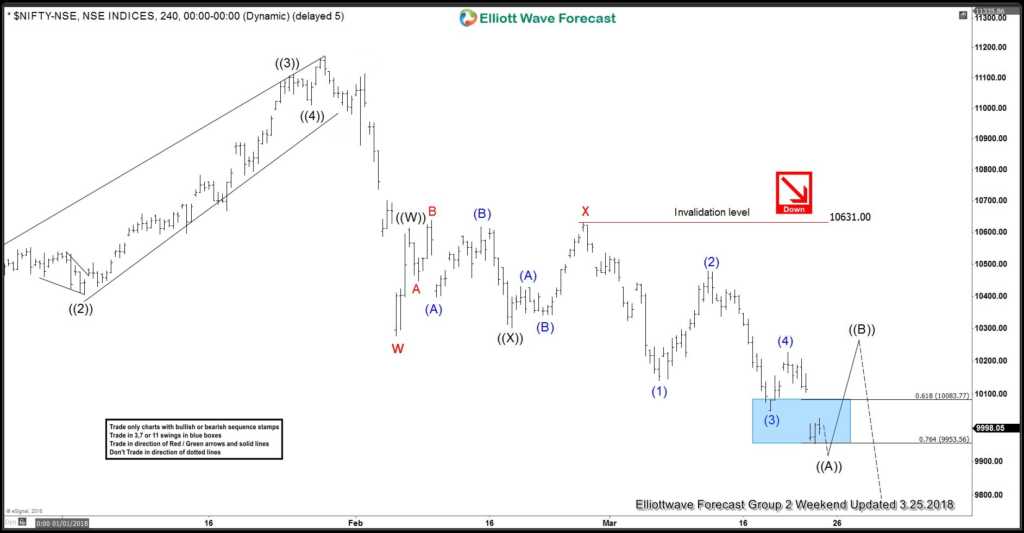
In the latest Elliott wave chart below, you can see that Nifty continued the weakness nicely to the downside. As it took 02/06 low (red wave w), it opened up a short-term bearish sequence from 01/29 high, targeting the equal legs of around 9740 areas. At this moment in time, Nifty has reached the 0.618-0.764 areas from red wave w-x. Ideally, we should get soon a bounce in possible black wave ((B)) before the market should continue the weakness to equal legs.
Nifty 03.25.2018 4 Hour Chart Elliott Wave Analysis
I hope you enjoyed this short blog about the Indian Index.
We believe in cycles, distribution, and many other tools in addition to the classic or new Elliott wave Principle.
Also, we are currently running a Spring Break Discount. You can save 30% on all monthly plan. Join us today and see our latest trading setups and charts.
Back


