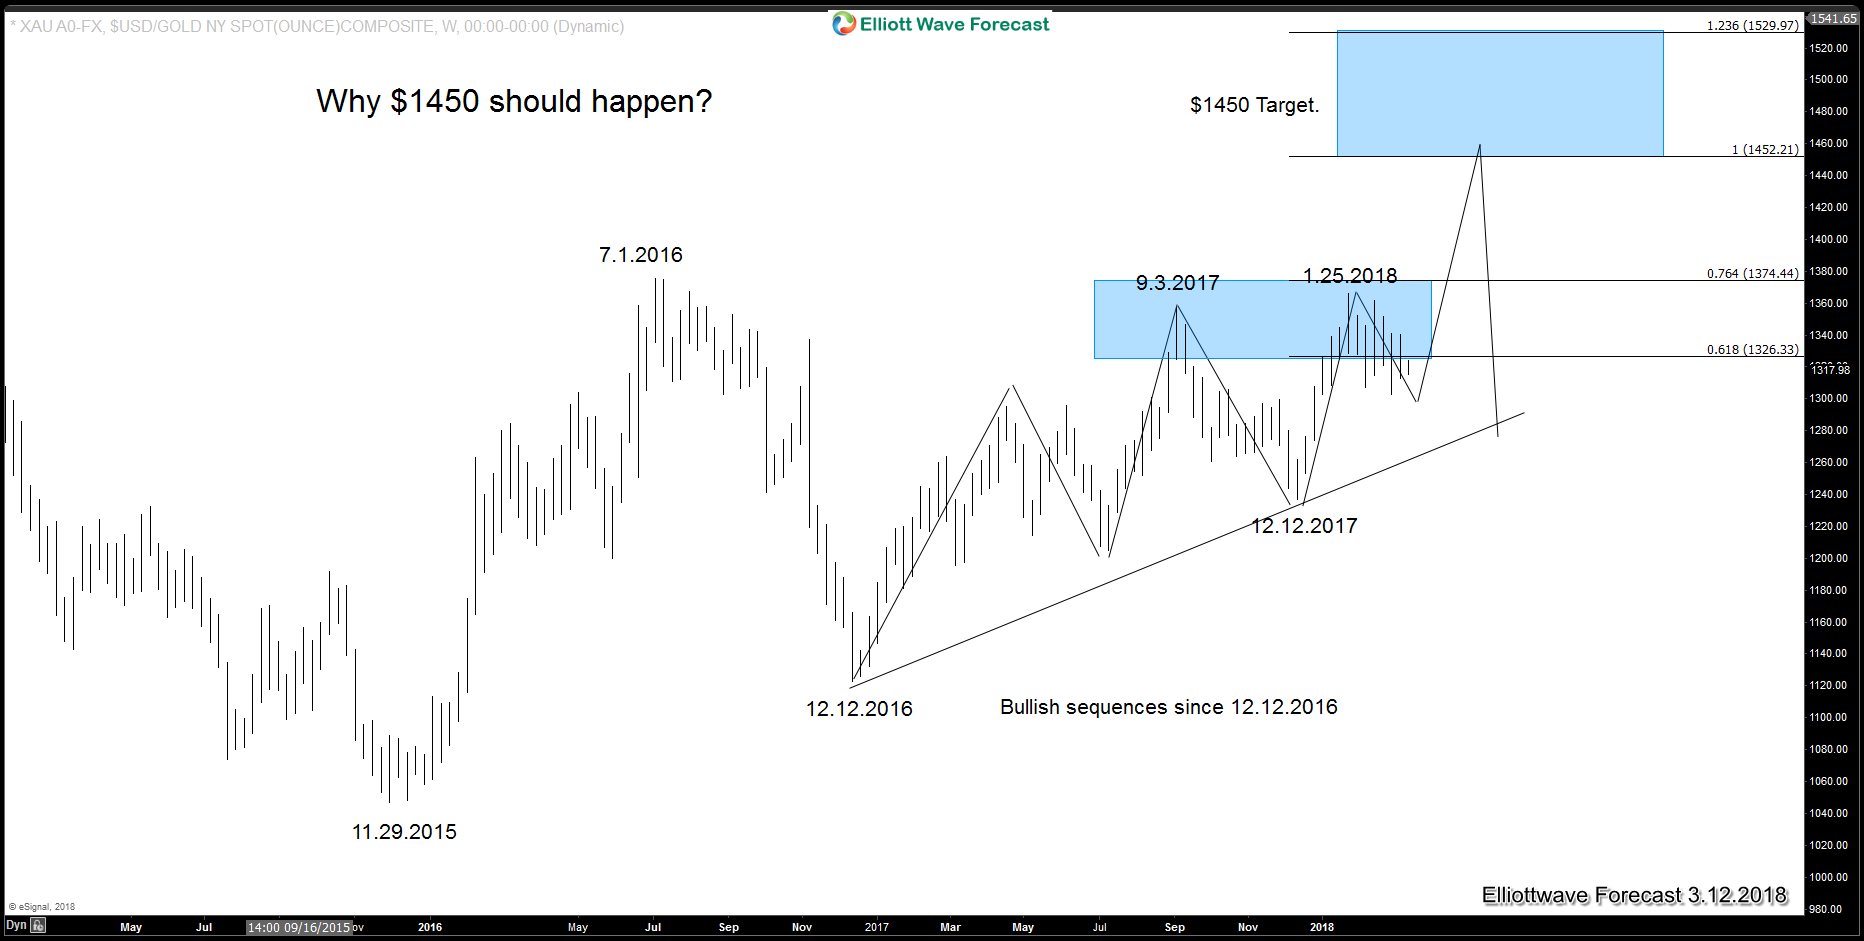
Gold has been trending higher since making the lows at 12.3.2015. From $1046.54 low, Gold rallied in 3 waves into the 7.6.2016 peak ($1375.15) and then pullback in 3 waves into the low at 12.15.2016 ($1122.81). Cycle from 12.15.2016 low has a 4 hour Bullish sequence as the yellow metal shows 5 swing sequence with a target of $1450.00. As far as Gold stays below below 7.6.2016 peak ($1375.15), there are various possible Elliott wave structures which can form.
$XAUUSD Gold Daily Sequence

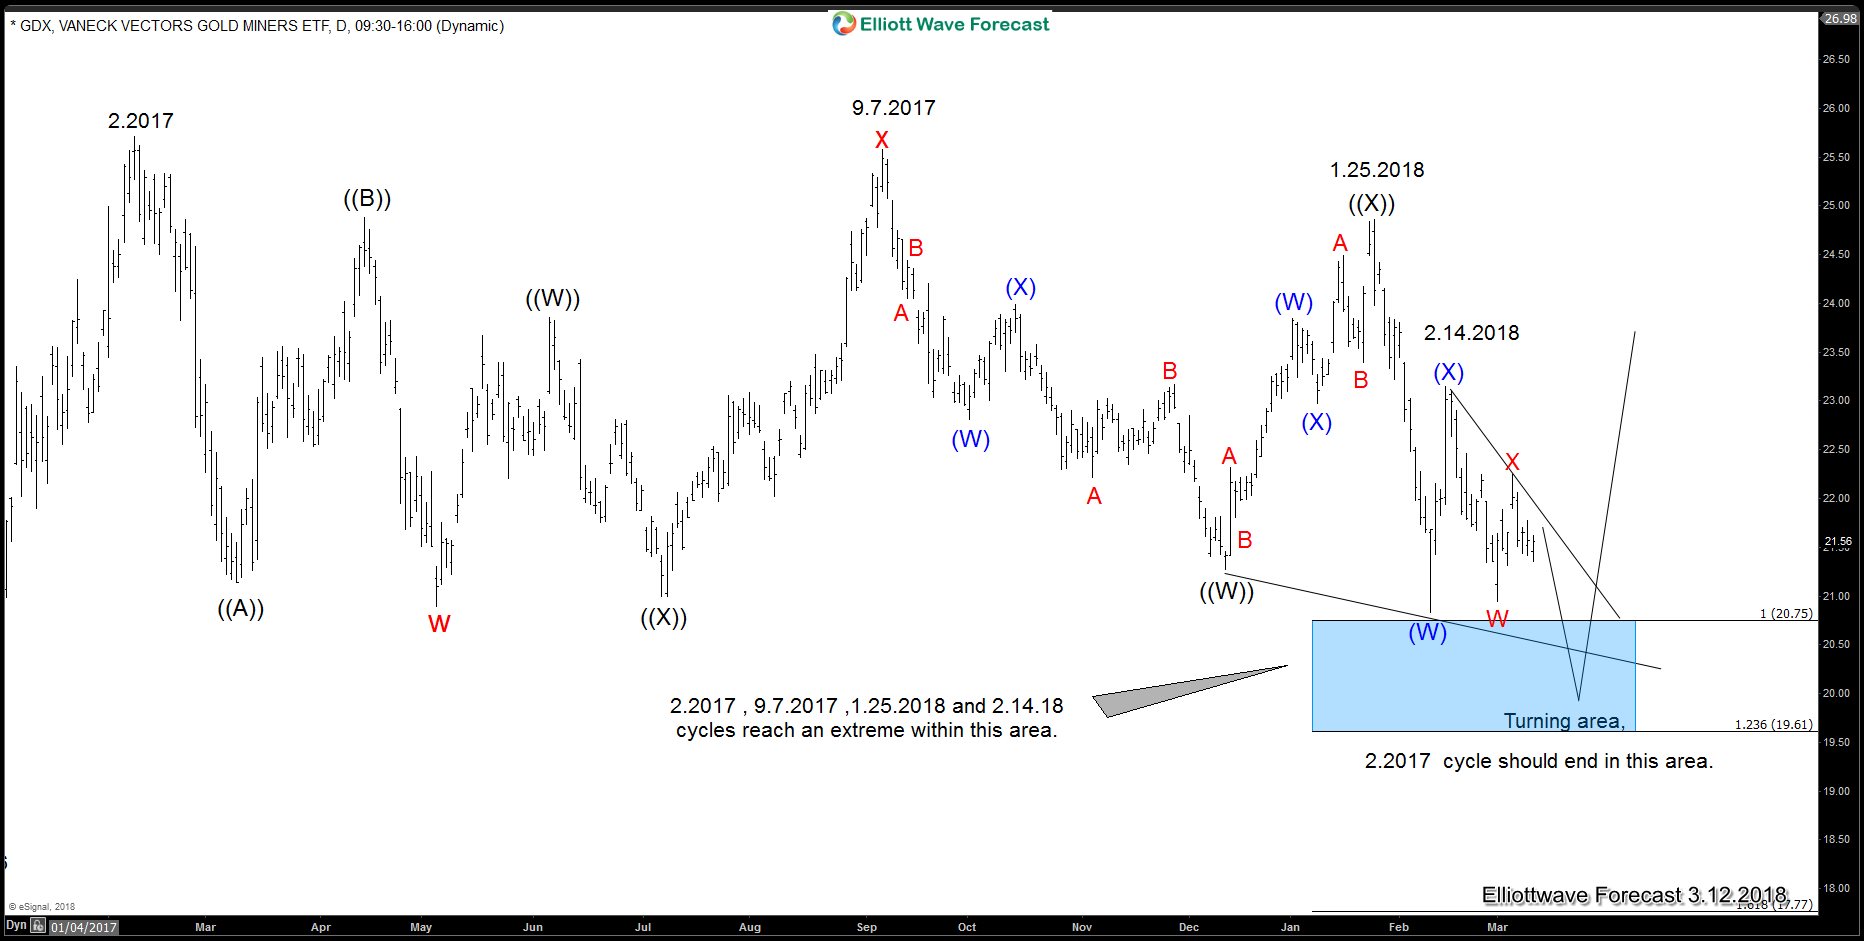
However, we at Elliottwave-Forecat.com use The One Market concept to forecast the best path by looking at related instrument. In this case, we are looking at $GDX which is Gold Miners ETF. This instrument is very well correlated with $XAUUSD. GDX is doing a WXY structure from 2.2017 and reaching an area between the $20.75 – $19.61 in which 4 degrees of Blue Boxes should be seen. This area is a strong support for at least 3 waves bounce. Consequently, that bounce will support $XAUUSD (Gold) to rally.
$GDX Daily Elliott wave count

As we can see in the charts and video below, “The One Market only” concept is eliminating some possibilities in $XAUUSD. It leads us to follow the most aggressive path in the yellow metal which is going to $1450, as far as pullbacks remain above the 12.12.2017 low ($1236.66). The market cannot be forecasted only by using The Elliott wave Theory and tools like One Market concepts and extreme areas are needed to provide a better forecast. In Conclusion, we believe $1450 should happen based in the sequences since 12.15.2016 low and the bounce in GDX. Therefore, buying the dips in Gold is the right side.

